• 概述
  • 评论
  • 评论

TP and SL Values for MT5

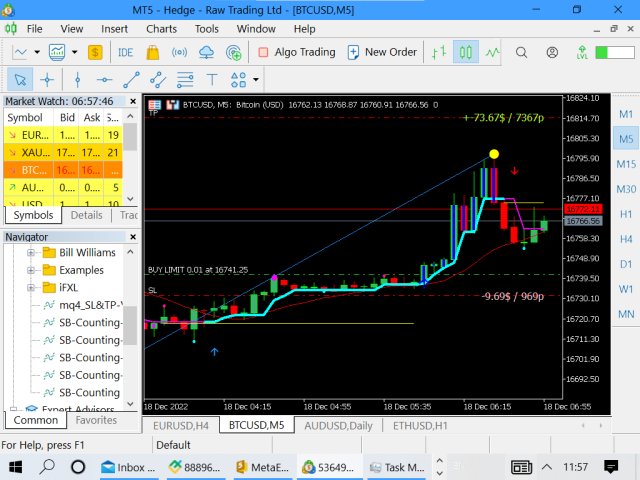
该指标将向您显示您已经为图表上的每个订单设置的 TP 和 SL 值(以该货币表示)(接近交易/订单行),这将帮助您估算每个订单的利润和损失。它还会向您显示 PIP 值。显示的格式是“我们的损益/PIP 值的货币值”。 TP 值将以绿色显示,SL 值将以红色显示。


如有任何问题或了解更多信息,请随时通过 fxlife.asia@hotmail.com 或 fxlife.asia@yahoo.com 与卖家联系


(而指标中即将加入的下一个功能是“自动或半自动TP和SL设置”,我们的客户将免费获得更新版本。谢谢...^_^)


(或者如果您认为在指示中应该增加一些功能,请随时告诉我们)

========================================================

推荐产品
Trend Fibonacci is a unique indicator that combines a power of Fibonacci sequences and ranges. How to read: - There are three zones --> red, gold and green - Red candlestick = downtrend - Green candlestick = uptrend   - Gold candlestick = no established trend Inputs: Per = number of bars used for calculations FirstRatio = first Fibonacci ratio (Or use any ratio you want) SecondRatio = second Fibonacci ratio (Or use any ratio you want) !! IF YOU PURCHASE THE INDICATOR, CONTACT ME FOR
47 USD
The best time to trade Using this Indicator is when the time reach exactly hour,half,45 minutes,15 minutes and sometimes 5 minutes.. This indicators is helpful to those who trade boom and crash indecies.How to read this indicator first you'll see Blue allow and Red allow all these allows used to indicate or to detect the spike which will happen so the allow happens soon before the spike happen.This indicator works properly only in boom and crash trading thing which you have to consider when
30 USD
Noize Absorption Index
Ekaterina Saltykova
Noize Absorption Index - is the manual trading system that measures the difference of pressure between bears forces and bulls forces. Green line - is a noize free index that showing curent situation. Zero value of index shows totally choppy/flat market.Values above zero level shows how powerfull bullish wave is and values below zero measures bearish forces.Up arrow appears on bearish market when it's ready to reverse, dn arrow appears on weak bullish market, as a result of reverse expectation.
199 USD
Alpha Binary Pro
Rafael Alejandro Rey Alves
1 (1)
The Alpha Binary Pro indicator is intended to work in different scenarios. This indicator uses a combination of technical indicators to detect buy or sell opportunities. The indicator works with any currency pair, stocks, cryptocurrencies and synthetic indices. The indicated can be used for both traditional trading and binary options. The indicator works with any time frame, from M1 to MN. When the blue arrow is pointing upwards this indicates that the signal is to buy. When the red
30 USD
Universal Trend
Maryna Shulzhenko
The Universal Trend indicator was created to detect trends in price movement and allows you to quickly determine not only the direction of the trend, but also understand the levels of interaction between buyers and sellers. The indicator works on all timeframes and currency pairs. The indicator gives fairly accurate signals and it is customary to use it both in trending and flat markets. It is advisable to use the indicator in combination with other tools for more reliable signals and making a
111 USD
Modified Rainbow
Rafael Alejandro Rey Alves
Modified Rainbow   The Modified Rainbow indicator is intended to work in different scenarios. The indicator uses a combination of technical indicators to detect buy or sell opportunities (different Moving Averages and other technical indicators). The indicator works with any currency pair, stocks, cryptocurrencies and synthetic indices. The indicator can be used for both traditional trading and binary options. The indicator works with any time frame, from M1 to MN. When the blue arrow
30 USD
MT5 指标。 自动画出三个级别的 Fibonacci 支撑阻力位。 分别为: 月线级别:紫色 周线级别:红色 日线级别:蓝色 颜色可通过参数调整。 此指标主要用来分析将来的支撑与阻力位,以便更好过行交易分析。 如果在支撑位多次有效支撑,行情再往上突破前期高点,有效的   趋势突破 做多。 如果下跌之后,行情多次上冲不过压力位,再次下行向下突破前期低点,有效的趋势突破做空位置。 当行情走到历史的高低点时,图表上可能只画出两个级别的 Fibonacii 线,没有日线级别的提示,这是正常的,因为指标需要等到行情回调一定的空间才会绘制,指标自动过滤的在高点价格区间的小幅波动,还不足以用来分析短周期的有效支撑与阻力位置。 关于参数: high or low prices previous day-lines:如果月线级别画的高点不符合图表,请调整此参数,一般是前期高(低)点到现在日线K线数量。 Month level color:月线级别的线条及文件提示颜色 Weekly Level color: 周 线级别的线条及文件提示颜色 Dayline Level color: 日 线级
40 USD
A powerful oscillator that provide Buy and Sell signals by calculating the investor liquidity. The more liquidity the more buy possibilities. The less liquidity the more sell possibilities. ( let me say this is a fuc*ing bomb!!! ) Just download the demo and run a backtest!!! Trust me! ;) HOW IT WORKS: The oscillator will put buy and sell arrow on the chart in runtime only . Top value is 95 to 100 -> Investors are ready to buy and you should follow. Bottom value is 5 to 0 -> Investors are ready
49 USD
"The trend is your friend" is one of the best known sayings in investing, because capturing large trendy price movements can be extremely profitable. However, trading with the trend is often easier said than done, because many indicators are based on price reversals not trends. These aren't very effective at identifying trendy periods, or predicting whether trends will continue. We developed the Trendiness Index to help address this problem by indicating the strength and direction of price trend
49 USD
PZ Trend Trading MT5
PZ TRADING SLU
3.67 (3)
许多盈利交易者不仅知道如何识别市场趋势,而且也能把握趋势建立后的交易机会。 Pz 趋势交易 指标设计用来在趋势行情中尽可能的赚取利润。 已建立的趋势提供了一揽子交易机会,但大多数趋势交易指标完全忽视了它们,让交易者在趋势行情时完全不知道该如何做!一般趋势指标只通知有关的趋势变化,但根本不足以得到卓越的回报. Pz 趋势交易 指标比一般趋势指标显示多达 20 倍的交易 , 因为它注重所谓的市场时机。它不仅显示当前的市场趋势,也有回调,内柱线的突破和调整。它令您在趋势回调之后介入,安全的柱线内突破金字塔加仓,以及发现潜在的反转,和已知的调整。 趋势改变 一个趋势改变在市场方向变化时发生。趋势变化在图表上用带数字的彩色圆圈显示。蓝色 (1) 信号为上涨开始, 而红色 (1) 信号为下跌开始。趋势变化并非评估当前价格动作的结果, 它意味着交易设置是不定时地。如果您正确使用本指标, 在趋势变化时, 您将将已经入场 (参看下面的调整)。 回调 但凡趋势在运动中,行情上下抖动,盈利者收割利润,且其它参与者入场。趋势回调代表好的买入机会,通常是由主力获利离场导致。如果行情在回调后回归上行, 指
125 USD
Follow The Line MT5
Oliver Gideon Amofa Appiah
4.23 (22)
This indicator obeys the popular maxim that: "THE TREND IS YOUR FRIEND" It paints a GREEN line for BUY and also paints a RED line for SELL. (you can change the colors). It gives alarms and alerts of all kinds. IT DOES NOT REPAINT and can be used for all currency pairs and timeframes. Yes, as easy and simple as that. Even a newbie can use it to make great and reliable trades. NB: For best results, get my other premium indicators for more powerful and reliable signals. Get them here: https://www.m
FREE
Key level wedge MT5
Presley Annais Tatenda Mfck
The   Key level wedge MT5   indicator automatically draws rising wedge pattern and falling wedge pattern for you on the chart. This pattern is really good when used as a confirmation entry at key support & resistance, supply & demand and reversal zones. Advantages  The   Key level wedge MT5   block DOES NOT RE-PAINT, giving you confidence when a signal appears and also helps when looking back.  The   Key level wedge MT5   includes an on/off button on the chart to easily keep the charts cle
59 USD
Your Trend Friend
Luigi Nunes Labigalini
The trend is your friend! Look at the color of the indicator and trade on that direction. It does not  repaint. After each candle is closed, that's the color of the trend. You can focus on shorter faster trends or major trends, just test what's most suitable for the symbol and timeframe you trade. Simply change the "Length" parameter and the indicator will automatically adapt. You can also change the color, thickness and style of the lines. Download and give it a try! There are big movements
99 USD
Perfect Sniper
Ignacio Agustin Mene Franco
Perfect Sniper! is a triple indicator with support resistance detection, downtrend channel, uptrend channel Bands included! where he hunts the rebounds in the red lines for sale, in the green lines mark purchase, in the lower bands that are the breaks gives another second entry either buy or sell, perfect to take advantage of the double entrance, It is used in any temporality, It is used to scalp and long on h1 or h4 to D1. It works for Forex markets, All pairs. It is used for the synthetic inde
100 USD
Laguerre SuperTrend Clouds   adds an Adaptive Laguerre averaging algorithm and alerts to the widely popular SuperTrend indicator. As the name suggests,   Laguerre SuperTrend Clouds (LSC)   is a trending indicator which works best in trendy (not choppy) markets. The SuperTrend is an extremely popular indicator for intraday and daily trading, and can be used on any timeframe. Incorporating Laguerre's equation to this can facilitate more robust trend detection and smoother filters. The LSC uses the
30 USD
To get access to MT4 version please click here . - This is the exact conversion from TradingView: "Stochastic Momentum Index" By "UCSgears". - This is a popular version of stochastic oscillator on tradingview. - This is a light-load processing and non-repaint indicator. - Buffers are available for the lines on chart. - You can message in private chat for further changes you need. Thanks for downloading
40 USD
Weis Wave with Alert MT5
Panagiotis Diamantopoulos
4.92 (13)
** NEW PLUTUS SIGNALS and ALL IN ONE ** Wychoff's UpThrust + Spring, Fake Breaks and Plutus  trading signals added (for more info visit    http://www.tradethevolumewaves.com  ) (for more info visit    http://www.tradethevolumewaves.com )   Different Wave Types,  choose what your cumulative Histogram diplays: Volume, Pips, Progressive Volume Rate, Time or Emphasized Volume Waves  ** IF YOU PURCHASE DO NOT FORGET TO CONTACT ME BECAUSE THERE IS MORE: Two Hrs Webinar + Training Room + Trade with th
499 USD
The Accumulation / Distribution is an indicator which was essentially designed to measure underlying supply and demand. It accomplishes this by trying to determine whether traders are actually accumulating (buying) or distributing (selling). This indicator should be more accurate than other default MT5 AD indicator for measuring buy/sell pressure by volume, identifying trend change through divergence and calculating Accumulation/Distribution (A/D) level. Application: - Buy/sell pressure: above
45 USD
Be notified of every color change of Heiken Ashi (HA) candles. The indicator will trigger past and new signals every time that HA candles change their colors. ( Note : this tool is based on the code of Heiken Ashi indicator developed by MetaQuotes Software Corp.) Features The signals are triggered at closing of last bar/opening of a new bar; Any kind of alerts can be enabled: Dialog Box, Email message, SMS notifications for smartphones and tablets, and Sound alerts; By default, up arrows are p
35 USD
HMA Trend Professional MT5
Pavel Zamoshnikov
4.4 (5)
Improved version of the free HMA Trend indicator (for MetaTrader 4) with statistical analysis. HMA Trend is a trend indicator based on the Hull Moving Average (HMA) with two periods. HMA with a slow period identifies the trend, while HMA with a fast period determines the short-term movements and signals in the trend direction. The main differences from the free version: Ability to predict the probability of a trend reversal using analysis of history data. Plotting statistical charts for analyz
30 USD
SBA scalping v75
Umri Azkia Zulkarnaen
110 USD
This is a Lite version of my Binary Wave Advance Oscillating indicator:  https://www.mql5.com/en/market/product/90734 It reduces the less useful indicators, while keeping it's predictive modifications to make each indicator within better than their stock counter part. I reduced it and made it simpler, in the hopes it would be less overwhelming and more approachable. Contains: ADX Chaikin Money Flow Index Each have separate smoothing controls to tame faster periods, as well as the Main has it's o
30 USD
Wapv Price and volume
Eduardo Da Costa Custodio Santos
40 USD
Volality Index Scalper
Lesedi Oliver Seilane
Volality Index scalper indicator  Meant for Volality pairs such as Volality 10, 25, 50, 75 and 100 The indicator works on all timeframes from the 1 minute to the monthly timeframe the indicator is non repaint the indicator has 3 entry settings 1 color change on zero cross 2 color change on slope change 3 color change on signal line cross Orange line is your sell signal Blue line is your buy signal.
35 USD
An indicator of pattern #31 ("Long Island") from Encyclopedia of Chart Patterns by Thomas N. Bulkowski. The second gap is in the opposite direction. Parameters: Alerts - show alert when an arrow appears   Push - send a push notification when an arrow appears (requires configuration in the terminal) GapSize - minimum gap size in points ArrowType - a symbol from 1 to 17 ArrowVShift - vertical shift of arrows in points   ShowLevels - show levels ColUp - color of an upward line ColDn - color of a
30 USD
Double HMA MTF for MT5
Pavel Zamoshnikov
5 (2)
This is an advanced multi-timeframe version of the popular Hull Moving Average (HMA) Features Two lines of the Hull indicator of different timeframes on the same chart. The HMA line of the higher timeframe defines the trend, and the HMA line of the current timeframe defines the short-term price movements. A graphical panel with HMA indicator data from all timeframes at the same time . If the HMA switched its direction on any timeframe, the panel displays a question or exclamation mark with a tex
30 USD
Magic Finger 能帮助你清晰的发现趋势及交易机会。此系统根据经典策略加上个人交易经验制作。您也可以根据此指标加上您的交易风格去编写EA。 手指指向为开仓信号,变色线为趋势确认。如果您是日内交易者,可以选择在交易活跃的时间段内交易,参考变色线作为下单方向依据,手指信号作为过滤器。 如果你是趋势交易者,可以选择在H1以上的周期,在关键价格区域等待手指信号的出现,并入市交易,然后以变色线作为趋势的确认。 止损可以止损圆点作为依据。 输入参数如下: RISK 5 MONEY RISK 2.0 AlertOption ********************************* Local Alert true TimesOfAlerts 2 E-Mail Alert false App PUSH Notification  false ***ADR Option**  *********************************  Display ADR  true  ATR Period  18  Normal Col
188 USD
No Demand No Supply MT5
Panagiotis Diamantopoulos
No Demand No Supply   This indicator identifies   No Demand –No Supply candles  to your chart and plots volume bars colored according to the signal. It can be applied to all timeframes or to a specific one only. It can also be used as regular volume indicator  with exceptional future of WEIGHTED VOLUME. Furthermore is has an alert notification, sound and email when a signals occurs. The indicator does not repaint but the alert will come on two candles back due to the definition of No Demand No S
80 USD
To download MT4 version please click here . - This is the exact conversion from TradingView: "Trend Direction Force Index - TDFI [wm]" By "causecelebre". - This indicator uses multiple levels of averaging to detect trend strength. - You can optimize filter low and filter high levels to achieve best results. - You have access to buffers to use in EAs. - This is a light-load processing and non-repaint indicator. - You can message in private chat for further changes you need.
40 USD
该产品的买家也购买
Entry Points Pro for MT5
Yury Orlov
4.55 (116)
这款指标用于 MT5,可提供准确的入场交易信号,且无重绘。 它可应用在任何金融资产:外汇、加密货币、贵金属、股票、指数。 它将提供极其精准的评估,并告诉您何时开仓和平仓的最佳时机。 观看 视频 (6:22),其中包含一个仅处理单一信号的示例,该信号即可值回指标购价! 大多数交易者在 Entry Points Pro 指标的帮助下,在第一个交易周内即改善了他们的交易结果。 订阅我们的 Telegram 群 ! Entry Points Pro 指标的益处。 入场信号无重绘 如果信号出现,并得到确认,则它不会再消失;不像是重绘指标,它会导致重大的财产损失,因为它们可以在显示信号后再将其删除。 无差错开仓 指标算法可令您找到入场交易(买入或卖出资产)的理想时机,从而提高每位交易者的成功率。 Entry Points Pro 可操作任何资产 它允许您在 MT5 平台上交易任何经纪商的加密货币、股票、贵金属、指数、大宗商品和货币。 提供任何方向的信号 Entry Points Pro 指标提供针对任意价格走势的入场交易信号 - 上涨、下跌或横盘(横向)。
125 USD
Advanced Supply Demand MT5
Bernhard Schweigert
4.36 (11)
任何新手或专业交易者的最佳解决方案! 该指标是一款独特、高质量、且价格合理的交易工具,因为我们已经整合了许多专有功能和新公式。 依据此更新,您将能够显示双重时间帧区域。 您不仅可以显示一个较高的时间帧,还可以同时显示图表时间帧,加上更高的时间帧:显示嵌套时区。 供需双方所有交易者都会喜欢它。 :) 重要信息披露 高级供需的最大潜力,请访问 https://www.mql5.com/zh/blogs/post/720245   想象您的交易如何得以改善,是因为您能够精准定位入场或目标位吗? 构建于新的底层算法,它可以更轻松地识别出买卖双方之间的潜在失衡。 这是因为它以图形方式展示供需最强劲区域,及其过去的表现(显示旧区域)。 这些功能旨在帮助您更轻松地发现最佳入场区域和价位。 现在您可以针对您的交易品种和时间帧来优化和编辑区域强度! 高级供需指标适用于所有产品和时间帧。 它是一个新的公式,非常新的功能是两个区域强度函数可由用户输入进行调整! 这在交易中是一大优势。 当您学习如何使用专有功能,例如带有价格游离最小 X 因子的区域强度时,您能够判断该区域强劲与否。 供需区域用作警报触发器
199 USD
Royal Wave Pro M5
Vahidreza Heidar Gholami
5 (2)
Royal Wave is a Trend-Power oscillator which has been programmed to locate and signal low-risk entry and exit zones. Its core algorithm statistically analyzes the market and generates trading signals for overbought, oversold and low volatile areas. By using a well-designed alerting system, this indicator makes it easier to make proper decisions regarding where to enter and where to exit trades. Features Trend-Power Algorithm Low risk Entry Zones and Exit Zones Predictions for Overbought and Over
129 USD
Blahtech Market Profile MT5
Blahtech Limited
5 (7)
Market Profile defines a number of day types that can help the trader to determine market behaviour. A key feature is the Value Area, representing the range of price action where 70% of trading took place. Understanding the Value Area can give traders valuable insight into market direction and establish the higher odds trade. It is an excellent addition to any system you may be using. Blahtech Limited presents their Market Profile indicator for the MetaTrader community. Inspired by Jim Dalton’s
142 USD
Stargogs Spike Catcher
Lorenzo Edward Beukes
5 (6)
Stargogs Spike Catcher V3 This Indicator is Developed To milk the BOOM and CRASH indices . Send me Message if you need any help with the indicator.  CHECK OUT THE STARGOGS SPIKE CATCHER EA/ROBOT V3: CLICK HERE ALSO CHECK OUT SECOND TO NONEFX SPIKE CATCHER:   CLICK HERE STARGOGS SPIKE CATCHER V3 WHATS NEW! Brand New Strategy. This is the Indicator you need for 2023. The Indicator Gives you an Entry at a time when conditions are met and you should use TP & SL. New Trendline that changes color in
100 USD
Blahtech Supply Demand MT5
Blahtech Limited
4.45 (11)
Supply Demand uses previous price action to identify potential imbalances between buyers and sellers. The key is to identify the better odds zones, not just the untouched ones. Blahtech Supply Demand indicator delivers functionality previously unavailable on any trading platform. This 4-in-1 indicator not only highlights the higher probability zones using a multi-criteria strength engine, but also combines it with multi-timeframe trend analysis, previously confirmed swings and engulfing detecto
142 USD
Royal Scalping Indicator M5
Vahidreza Heidar Gholami
5 (8)
Royal Scalping Indicator is an advanced price adaptive indicator designed to generate high-quality trading signals. Built-in multi-timeframe and multi-currency capabilities make it even more powerful to have configurations based on different symbols and timeframes. This indicator is perfect for scalp trades as well as swing trades. Royal Scalping is not just an indicator, but a trading strategy itself. Features Price Adaptive Trend Detector Algorithm Multi-Timeframe and Multi-Currency Trend Low
149 USD
PZ Swing Trading MT5
PZ TRADING SLU
5 (4)
Swing Trading 是第一个旨在检测趋势方向的波动和可能的反转波动的指标。它使用在交易文献中广泛描述的基准摆动交易方法。该指标研究多个价格和时间向量,以追踪总体趋势方向,并检测市场超卖或超买并准备好进行修正的情况。 [ 安装指南 | 更新指南 | 故障排除 | 常见问题 | 所有产品 ] 市场波动的利润不会被窃取 指示器始终显示趋势方向 彩色价格带代表机会基准 彩色虚线表示可能的反转波动 该指标分析其自身的质量和性能 它实现了一个多时间仪表板 可定制的趋势和波动周期 它实现了电子邮件/声音/推送警报 指示器为非重涂或重涂 什么是摇摆交易 摇摆交易是一种尝试在一天到一周内从证券中获得收益的交易方式,尽管某些交易最终可以保持更长的寿命。摇摆交易者使用技术分析来买入弱点和卖出力量,并有耐心等待这些机会的发生,因为在发生一波抛售浪潮之后购买证券而不是陷入抛售更有意义。 机会基准 关于历史数据的大量研究证明,适合于波动交易的市场倾向于在基线价格带上下交易,基线价格带由图表显示,使用平均真实区间计算得出。波动交易者使用基线,该策略是购买常态和卖出躁狂,或做空常态并掩盖沮丧。
125 USD
PZ Day Trading MT5
PZ TRADING SLU
2.6 (5)
该指标仅使用价格行为分析和donchian渠道以锯齿形检测价格反转。它是专门为短期交易而设计的,根本不需要重新粉刷或补漆。对于精明的交易者来说,这是一个绝佳的工具,旨在增加他们的运作时间。 [ 安装指南 | 更新指南 | 故障排除 | 常见问题 | 所有产品 ] 极易交易 它在每个时间段都提供价值 实施自我分析统计 它实现了电子邮件/声音/视觉警报 基于可变长度的突破和拥挤区域,该指标仅使用价格行为来选择交易并对市场快速做出反应。 显示过去信号的潜在利润 该指标分析其自身的质量和性能 突围的损失突出显示并解决 该指标是不可重涂和不可重涂的 该指标将帮助盘中交易者不要错过单个价格反转。但是,并非所有价格反转都是一样的,也不是具有相同的可行质量。决定要突破哪些突破而忽略哪些取决于交易者的良好判断。 如何解释统计数据 该指标研究其自身信号的质量,并在图表上绘制相关信息。将分析每笔交易,并在图表的左上角显示总体历史结果,这使您可以针对任何给定的工具和时间范围自行优化指标参数。每个乐器和时间表都有其自己的最佳设置,您可以自己找到它们。 最大优惠交易:对于任何给定的交易,MFE都是
125 USD
God win spike system
Israr Hussain Shah
1 (1)
• Non Repaint • DelayNo Lag •Pop Up notification • 98% Verified Accuracy • Real time arrows to catch spikes at least 4-8 bars We forward guide video how milk spikes  We also add in telegram group for better quality help  +see live trading results  https://youtu.be/DCG4CAWlg4I you will see an arrow signal and open trade for spike stop-loss of trade will be 8 or 10 candles if no spike exit you just need to follow spike arrow signals and for more good results follow inst
200 USD
Trade system "PAX Multi TMA/HMA 8" for MT5 it is a ready-made trading system for trading on any instrument and any timeframe. An experienced trader on one instrument can get a profit   from 100% to 400% per day . Completely ready for manual trading and use in robots. Not redrawn signals. It is convenient to work on any timeframe. Tested on metals, currency pairs, oil, international stocks, Russian stocks, cryptocurrencies, monetary and cryptocurrency indices. What the trading sy
144 USD
Quantum Currency Array Indicator for MT5
QUANTUM TRADING SOFTWARE LIMITED
This indicator has been developed to identify and display these trends quickly and easily, allowing you to see instantly, those currency pairs which are trending, and those which are not – and in all timeframes, with just one click. The 28 currency pairs are displayed as a fan as they sweep from strong to weak and back again, and this is why we call it the ‘currency array’. All 28 pairs are arrayed before you, giving an instant visual description of those pairs that are trending strongly, those
197 USD
Introduction to X3 Chart Pattern Scanner X3 Cherart Pattern Scanner is the non-repainting and non-lagging indicator detecting X3 chart patterns including Harmonic pattern, Elliott Wave pattern, X3 patterns, and Japanese Candlestick patterns. Historical patterns match with signal patterns. Hence, you can readily develop the solid trading strategy in your chart. More importantly, this superb pattern scanner can detect the optimal pattern of its kind. In addition, you can switch on and off individu
250 USD
AV Stop Hunter MT5
Anja Vivia Vogel
"AV Stop Hunter MT5" is an indicator for MetaTrader 5, which draws entry arrows for long and short after so-called Stop Hunt candles and has several notifications about them. Since this is a smart money concept, the periods H1 and H4 are the best. NEW: Increasing volume improves the signal, lines and arrows are then thicker. The MQL5 variant has colored stop-hunting candles. Definition / strategy: "Stop Hunting" is when the wick of a candle extends above a previous 3 Bar Fractal Candl
120 USD
WAPV Full MT5
Eduardo Da Costa Custodio Santos
## 使用 WAPV Full 專業操作並能夠跟踪 大玩家的錢在哪裡 想像一下,您手中有一個可以單獨進行閱讀的工具 主要市場參與者,顯示最佳交易區域 基於價格和數量分析。 WAPV Full 是一個完整的工具, 100% 專注於 R. Wyckoff 的操作 除了繪製交易波中的市場走勢外,它還繪製了 通過閱讀價格和數量來了解市場。 專業市場根據 R. Wyckoff 的 3 條定律運作 #因果關係 # 供給與需求 # 努力 x 結果 所有這些都在 WAPV Full 中提供,它為您提供 16 種基本工具 為您專業地分析市場,從而 改善你的結果。 查看圖片和視頻以了解我在說什麼。 ## Shǐyòng WAPV Full zhuānyè cāozuò bìng nénggòu gēnzōng dà wánjiā de qián zài nǎlǐ xiǎngxiàng yīxià, nín shǒuzhōng yǒu yīgè kěyǐ dāndú jìnxíng yuèdú de gōngjù zhǔyào shìchǎng cānyù zhě, xiǎnshì zuì jiā jiā
199 USD
MTF Supply Demand Zones MT5
Georgios Kalomoiropoulos
下一代自动化供需区。适用于任何图表的创新算法。所有区域都是根据市场的价格行为动态创建的。 两种类型的警报 --> 1) 当价格触及区域时 2) 当新区域形成时 你不会再得到一个无用的指标。您将获得一个完整的交易策略和经过验证的结果。     新的功能:     价格触及供需区时发出警报     创建新的供应/需求区时发出警报     推送通知警报     以点为单位的区域宽度标签     关于 MTF 的又一个时间表。因此,现在您将能够看到高于当前 3 个时间帧,而不是高于当前 2 个时间帧     启用/禁用警报/区域/MTF 功能的按钮 您获得的优势:     消除交易中的情绪。     客观化您的交易条目。     通过高概率设置提高您的利润。     节省绘图区域的时间。     像专业人士一样交易金融市场。     任何市场的即时多时间框架分析。 你在图表上看到了什么?     蓝色和红色矩形是当前时间范围的供需区。     虚线
149 USD
Offer 249 down from 350 for the next 3 copies. then back to 350 $ Are you tired of using outdated indicators that leave you guessing where to set your profit targets? Look no further than the AK CAP Opening Range Breakout Indicator. This powerful tool is backed by a US patent and has already helped countless traders pass funded challenges like FTMO. We use it daily on our prop traders and internal funds, and now it's available to you as well. The calculation behind the indicator is incredibly
249 USD
任何新手或专家交易者的最佳解决方案! 这个指标是一个独特的、高质量的、可负担得起的交易工具,因为我们纳入了一些专有的功能和一个新的公式。只需一个图表,你就可以读出28个外汇对的货币强度!想象一下,你的交易将如何得到改善,因为你的交易是在你的手中进行的。想象一下,你的交易将如何改善,因为你能够准确地确定新趋势或剥头皮机会的触发点? 用户手册:点击这里  https://www.mql5.com/en/blogs/post/697384 这是第一本,原版的! 不要买一个毫无价值的崇拜者的克隆品。 特别的 子窗口中的箭头显示强劲的货币势头GAP将指导你的交易! 当基础货币或报价货币处于超卖/超买区域(外盘斐波那契水平)时,在个人图表的主窗口中出现警告信号。 当货币力量从外围区间回落时,回撤/反转警报。 十字星模式的特别警报 可选择多个时间框架,以快速查看趋势! 货币强度线在所有的时间框架中都非常平稳,当使用较高的时间框架来识别总体趋势,然后使用较短的时间框架来确定精确的入口时,效果非常好。你可以根据自己的意愿选择任何时间框架。每个时间框架都由其自身进行了优化。 建立在
128 USD
TPA True Price Action indicator reveals the true price action of the market makers through 100% non-repainting signals strictly at the close of a candle! TPA shows entries and re-entries, every time the bulls are definitely stronger than the bears and vice versa. Not to confuse with red/green candles. The shift of power gets confirmed at the earliest stage and is ONE exit strategy of several. There are available now two free parts of the TPA User Guide for our customers. The first "The Basics"
168 USD
VTrende Pro
Andrey Dyachenko
VTrende Pro - MTF indicator for trend trading with a display panel for MT5 *** Videos can be translated into any language using subtitles (video language - Russian) Although the signals of the VTrende Pro indicator can be used as signals of a full-fledged trading system, it is recommended to use them in conjunction with the Bill Williams TS. VTrende Pro is an extended version of the VTrende indicator. Difference between Pro version and VTrende: - Time zones - Signal V - signal 1-2 waves
697 USD
Golden Spikes Detector
Batsirayi L Marango
5 (1)
Golden Spikes Detector This indicator is based on an advanced strategy primarily for trading spikes on Boom and Crash Indices. Complex algorithms were implanted to detect high probability entries only. It alerts on potential Buy and Sell entries. To trade spikes on the Deriv or Binary broker, only take Buy Boom and Sell Cash alerts. It was optimised for 5-minute timeframe. Features ·          Sends push notifications to mobile phone ·          Pop up and sound alerts on computer or laptop ·     
150 USD
本指标是实践实战交易完善的波浪自动分析的指标! 注:波浪分级用西方叫法不习惯,因 受到缠论(缠中说禅)命名方式习惯的影响,我是将基础波浪命名为 笔 , 将二级波段命名为 段 , 同时具有趋势方向的段命名为 主趋段 (以后笔记中都是这种命名方式,先告知大家),但是算法上和缠论关系不大切勿混淆.反映的是本人分析盘面总结的 千变万化纷繁复杂的运行规律 . 对波段进行了标准化定义,不再是不同人不同的浪 , 对人为干扰的画法进行了排除 , 在严格分析进场起到了关键的作用 . 指标内容 1.   基础波浪(笔): 首先我们找出了价格波动过程中的基础波动拐点,当然他的有序性还不算太强,为下一步的计算提供基础. 2.   二级波段(段) :在基础波浪的基础上,通过算法分析得到层级更明显的二级波段,二级波段为波浪提供了分析基础 3.   波浪(浪): 有着更清晰的趋势,更清晰直观的方向.分析一个波浪是否延续,需要看二级波段的形态,分析二级的构成,可以得出波浪后续的预测. 4.   通道: 通道计算采用了线性回归的方式进行计算. 5.   回撤: 波浪中的两个重要回撤会在每个波段终显示,实战所得这几个
188 USD
MetaBands M5
Vahidreza Heidar Gholami
5 (1)
MetaBands uses powerful and unique algorithms to draw channels and detect trends so that it can provide traders with potential points for entering and exiting trades. It’s a channel indicator plus a powerful trend indicator. It includes different types of channels which can be merged by the user to create new channels simply by using the input parameters. MetaBands uses all types of alerts to notify the user about market events. Features Supports most of the channel algorithms Powerful trend det
129 USD
PZ Harmonacci Patterns MT5
PZ TRADING SLU
3.25 (4)
可以说,这是您可以为MetaTrader平台找到的最完整的谐波价格形成自动识别指标。它检测19种不同的模式,像您一样认真对待斐波那契投影,显示潜在的反转区域(PRZ),并找到合适的止损和获利水平。 [ 安装指南 | 更新指南 | 故障排除 | 常见问题 | 所有产品 ] 它检测19种不同的谐波价格形态 它绘制了主要,衍生和互补的斐波那契投影(PRZ) 它评估过去的价格走势并显示每个过去的形态 该指标分析其自身的质量和性能 它显示合适的止损和获利水平 它使用突破来表明合适的交易 它在图表上绘制所有样式比率 它实现了电子邮件/声音/视觉警报 受斯科特·M·卡尼(Scott M. Carney)的书的启发,该指标旨在满足最纯粹和最熟练的交易者的需求。但是,它采取了一种使交易更容易的方式:在向交易发出信号之前,它会等待Donchian朝正确方向突破,从而使交易信号非常可靠。 斐波那契投影与向量无关 它实现了电子邮件/声音/推送警报 它绘制了ABCD投影 重要提示: 为了符合 Scott M. Carney先生 的商标申诉,某些图案名称已重命名为不言自明的替代方式, Scot
149 USD
PZ Divergence Trading MT5
PZ TRADING SLU
3.67 (3)
棘手的发现和频率稀缺是最可靠的交易方案之一。该指标使用您喜欢的振荡器自动查找并扫描常规和隐藏的发散。 [ 安装指南 | 更新指南 | 故障排除 | 常见问题 | 所有产品 ] 容易交易 发现常规和隐藏的分歧 支持许多知名的振荡器 根据突破实现交易信号 显示适当的止损和获利水平 可配置的振荡器参数 可自定义的颜色和尺寸 按条形过滤大小差异 实现绩效统计 它实现了电子邮件/声音/视觉警报 为了提供广阔的市场前景,可以使用不同的振荡器在同一张图表中多次加载该指标,而不会产生干扰。该指标支持以下振荡器: RSI CCI MACD OSMA 随机 动量 很棒的振荡器 加速器振荡器 威廉姆斯百分比范围 相对活力指数 由于差异可能会扩大很多,尤其是在外汇市场中,因此该指标产生了转折:它在等待交易突破之前等待donchian突破确认差异。最终结果是带有非常可靠的交易信号的重新粉刷指示器。 输入参数 幅度:用于寻找差异的之字形周期 振荡器-选择要加载到图表的振荡器。 突破期-交易信号的突破期,以柱为单位。 发散类型-启用或禁用发散类型:隐藏,常规或两者。 最小散度单位为条形-最
125 USD
Sends Alerts – On MT5 To Your Phone To Your Email Does not repaint . Works on any Forex pair, any timeframe. 10 Activations allowed so you are free from limitations >> MT4 Version Here What Is An Order Block? An Order Block  (or Banker Candle, or Institutional Candle)  is an opportunity to get very high risk to reward trades (often 5:1 or more) but you have to know how to trade them. >>>> Please see my video below on how to maximise the winners. An Order Block is formed when the banks
297 USD
Buy And Sell Signal Arrows On The Chart When The Price Is About To Reverse. Also Sends Alerts –On MT5 To Your Phone To Your Email. Does not repaint. Works on any pair, any timeframe.   (Just ajust the settings for your pair and timeframe.) 10 Activations allowed so you are free from limitations MT4 version here .   What is Price Rejection and Reversal and why is it important to you? If price shows certain signs of rejection e.g. a large wick, this often means that it will then re
297 USD
Volume by Price MT5
Brian Collard
5 (2)
The Volume by Price Indicator for MetaTrader 5 features Volume Profile and Market Profile TPO (Time Price Opportunity). Get valuable insights out of currencies, equities and commodities data. Gain an edge trading financial markets. Highest quality real-time and historical price data distributions. Versatile range selection methods. Drag and drop with time/price option. Unlimited segmentation. Session filtering with built-in presets for New York, London, Tokyo, Sydney and São Paulo. Composites w
149.95 USD
Buy And Sell Arrows On The Chart When The Trend Is About To Continue. Sends Alerts – On MT5 To Your Phone To Your Email. Does not repaint. Works on any pair, any timeframe.   (Just ajust the settings for your pair and timeframe.) 10 Activations allowed so you are free from limitations See an example of alerts from today (23 May 2020) using this and 2 other indicators  here . MT4 version here. The indicator provides accurate buy and sell arrows on the chart when the trend is about t
297 USD
Mega Spikes Max
Niccyril Chirindo
The best Tool to Catch Boom and Crash Spikes like a Pro!!! You want to become a constantly Boom and Crash Trader This is an advanced indicator used to catch Boom and Crash Indices spikes beforehand. It alerts on high probability entries with an amazing success rate. We recommend using a Virtual Private Server for receiving 24/7 notifications via email or phone How to trade with Mega Spikes Max 1.7 ? When arrow is displayed on the chart wait for audible alert or push notification to be sen
130 USD
作者的更多信息
This indicator will help you  a lot to caculate all of your orders ( Both real current orders and pending orders) for all of your charts  ( Calculation separately  in each charts).    And it will show you the direction of each chart (Settlement lot)   that it's  BUY, SELL or HEDGING with how many lot.   For example,  your EURUSD is  0.6 lots BUY (totally),   but   GBPUSD  is  1.5 lots SELL  (totally) and BTCUSD   is HEDGING  with total BUYs 0.5 lot and total SELLs  0.5 lot.    (including summar
149 USD
筛选:
无评论
回复评论