Trend Reversal Index MT4
- 指标
- Ekaterina Saltykova
- 版本: 1.10
- 更新: 22 九月 2022
- 激活: 5
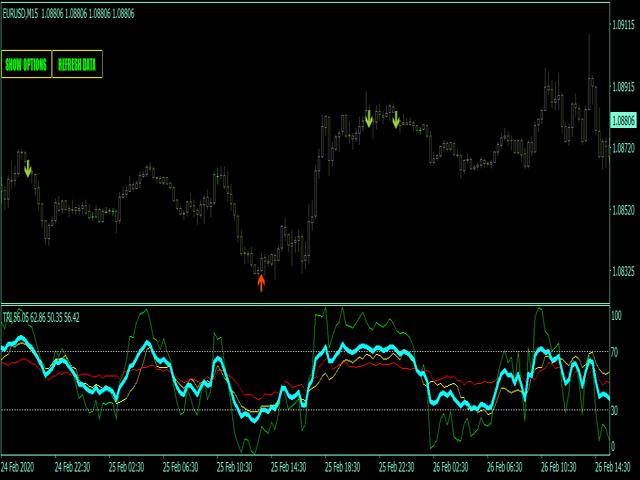
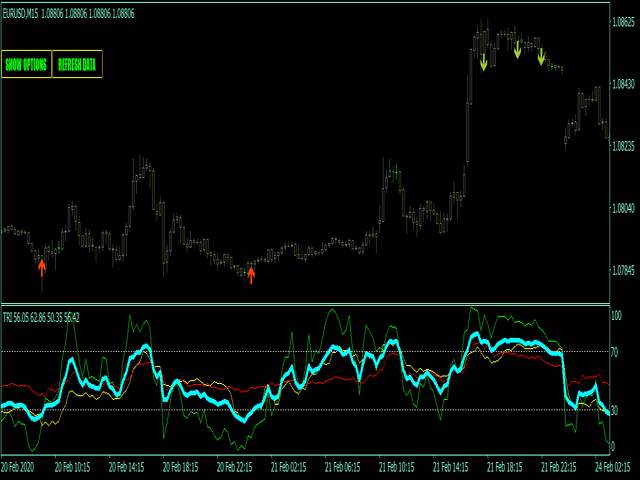
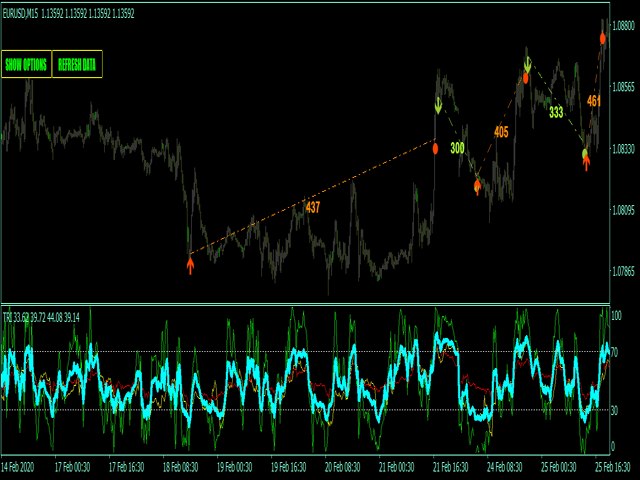
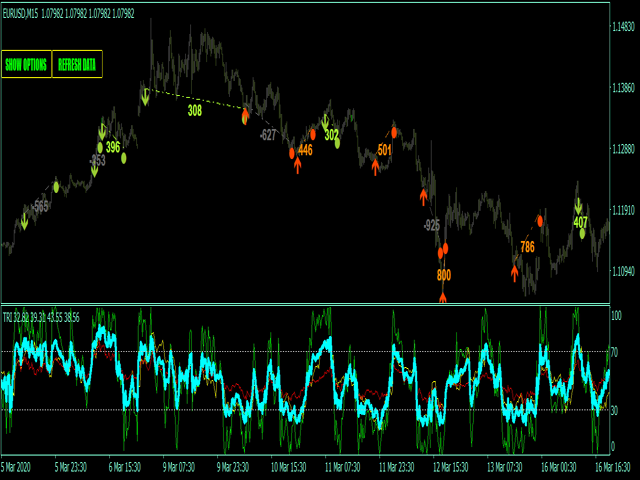
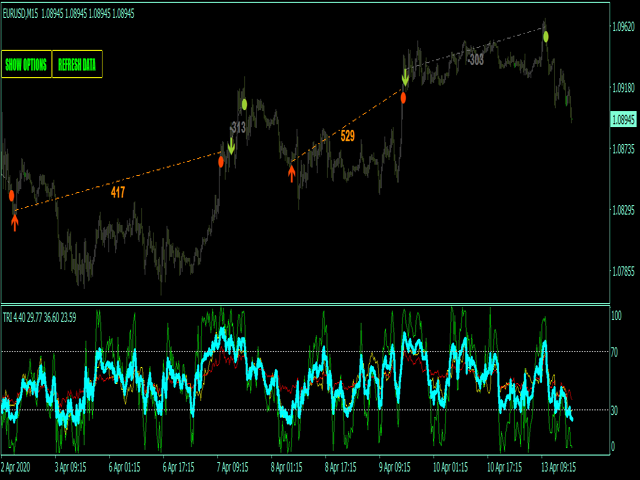
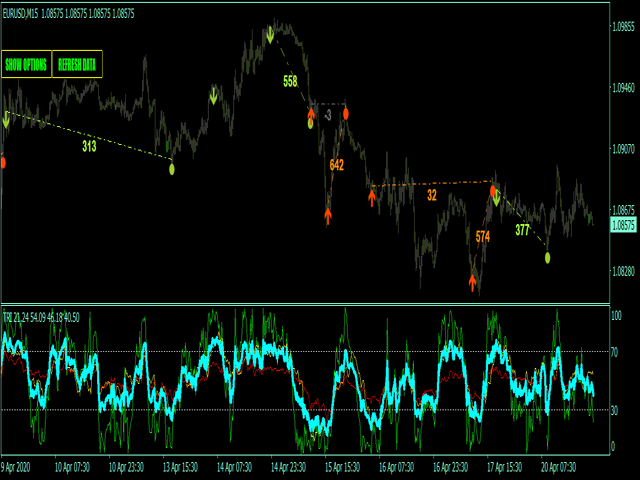
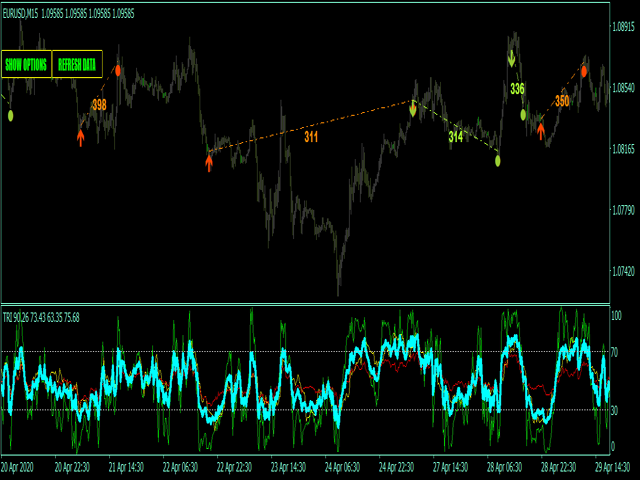
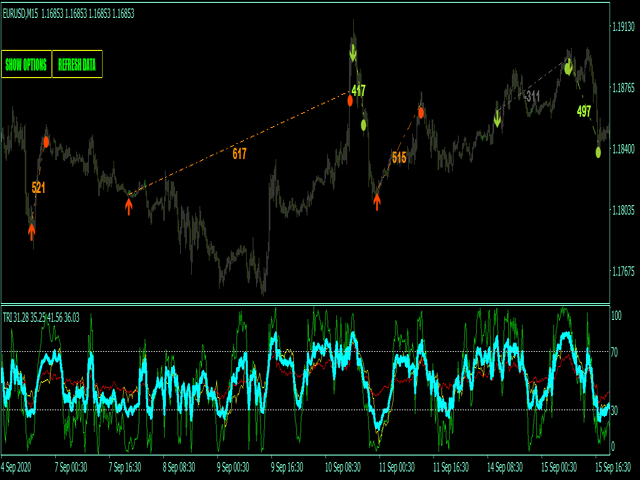
Trend reversal index - is the manual trading system that works with overbought , oversold levels and reversal patterns.
Sell arrow is plotted when indicator is higher than overbought level and here forms reversal pattern, all pattern points
located higher than overbought level. Opposite with buy arrow : ndicator is lower than oversold level and here forms reversal pattern, all pattern points located lower than overbought level.
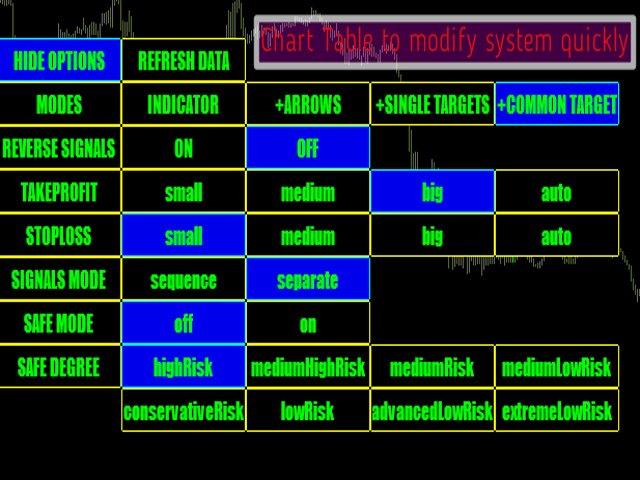
Main Indicator's Features
- Signals are not repaint, late or disappear;
- Every signal comes at the open of new bar(system uses only confirmed signals);
- Indicator has Alerts, Mail and Push notifications(allow to trade out of PC, from smartphone/mobile app);
- Indicator has profit/loss targets;
Recommendations for trading
- Volatility popular markets with low spread;
- Best timeframes - intraday timeframe;