Market Chopper Indicator MT4
- 指标
- Ekaterina Saltykova
- 版本: 4.20
- 更新: 22 九月 2022
- 激活: 5
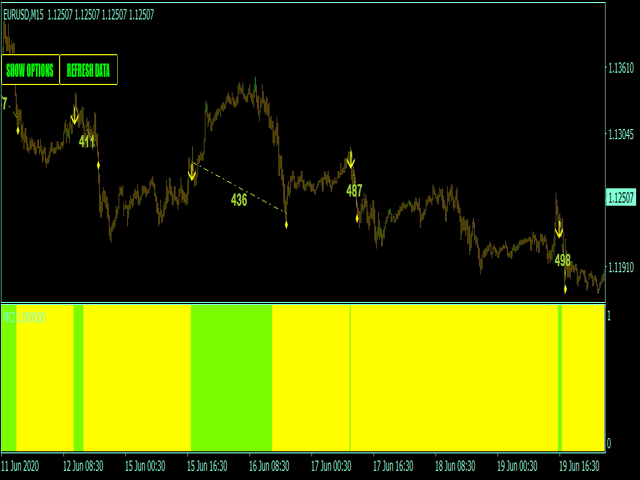
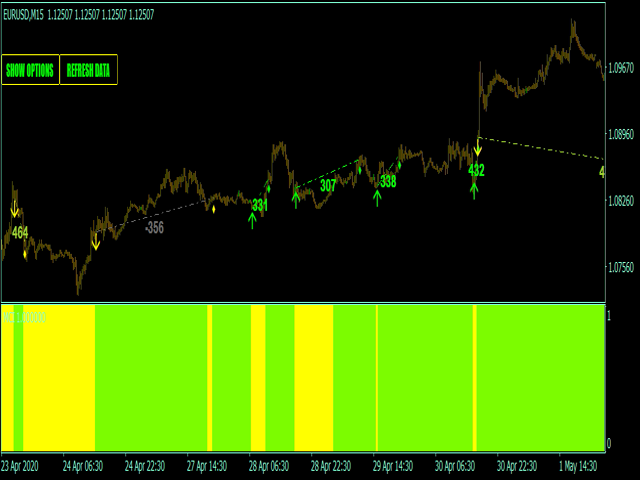
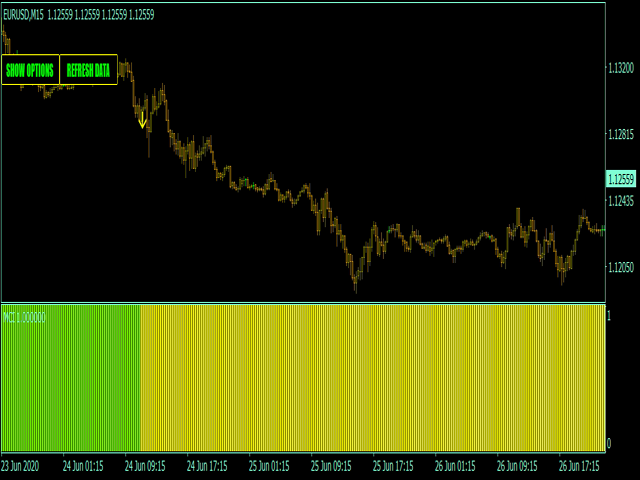
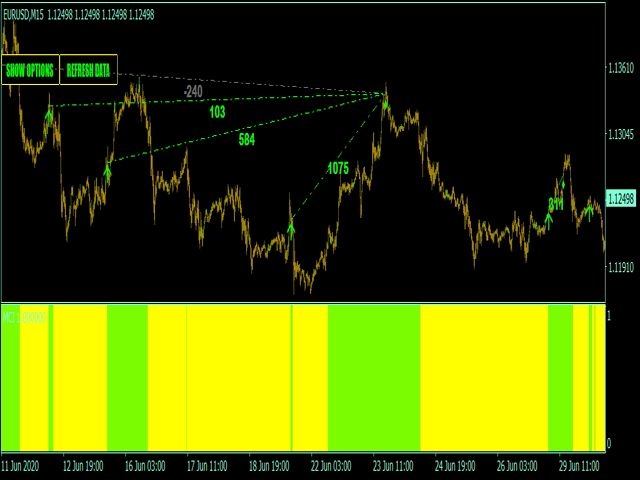
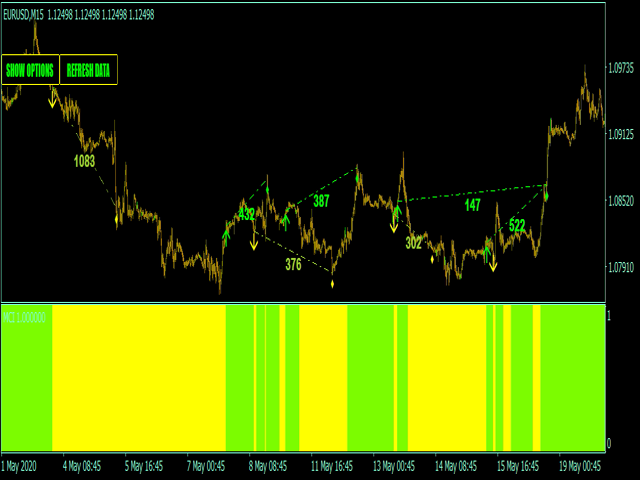
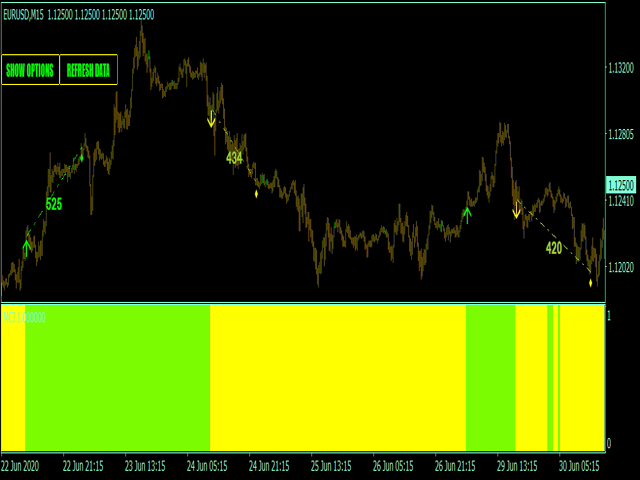
Market Chopper Indicator - is the manual system for market scalping. Indicator uses most accurate points to enter, when current trend has lost it's power and new one starts. Indicator shows : Enter points(buy/sell arrows), Exit points(Stoploss/Takeprofit arrows). Indicator makes market analysis and adapts to any market, any timeframe showing most relevant strategy for exact conditions.
Main Indicator's Features
- Signals are NOT repaint, late or disappear;
- Every signal comes at the open of new bar;
- Indicator has Alerts, Mail and Push notifications;
Recommendations for trading
- Best to use "scalping" timeframes : M5, M15, H1 or similar in case of non-standart timeframes;
- It can trade on all forex pairs, stocks and crypto;
Thanks for watching, Best trends !