BB St Dev
- 指标
- Stefan Stoyanov
- 版本: 2.0
- 更新: 22 八月 2018
- 激活: 5
BB St Dev
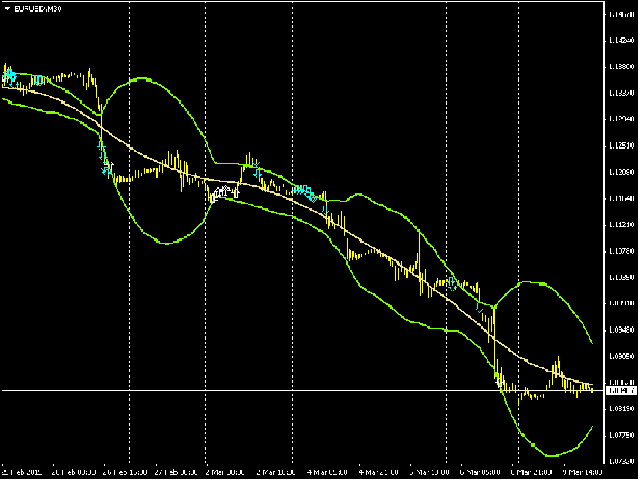
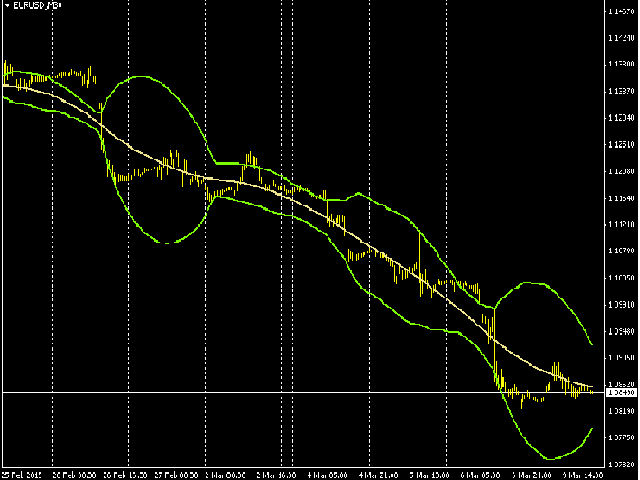
BB St Dev類似於布林線指標。
布林通道的上部和下部通過iStdDev計算。
iStdDev是МetaТrader4的標準指標。
移動平均線具有特殊的平滑算法。
設置
M - 移動平均線的周期
BandsDeviations參數 - 通道生成因子。 除了經典的布林帶外,BandsDeviations在這裡可以擁有任何價值。
Visio參數
如果Visio = False,則此指標將與布林帶指標一致。
如果Visio = True,此指標將顯示可能的訂單開倉點。
如何配置此指標
選擇:圖表=>指標列表=> BB和St Dev =>編輯。
將出現指標窗口。
設置參數。
創建模板:Charts => Template => Save Template。
Qiūjì zhékòu 50%=> 75 $ jǐn xiàn 35 měiyuán BB St Dev BB St Dev lèisì yú bù lín xiàn zhǐbiāo. Bù lín tōngdào de shàngbù hé xiàbù tōngguò iStdDev jìsuàn. IStdDev shì MetaTrader4 de biāozhǔn zhǐbiāo. Yídòng píngjūn xiàn jùyǒu tèshū de pínghuá suànfǎ. Shèzhì M - yídòng píngjūn xiàn de zhōuqí BandsDeviations cānshù - tōngdào shēngchéng yīnzǐ. Chúle jīngdiǎn de bù líndài wài,BandsDeviations zài zhèlǐ kěyǐ yǒngyǒu rènhé jiàzhí. Visio cānshù rúguǒ Visio = False, zé cǐ zhǐbiāo jiāng yǔ bù líndài zhǐbiāo yīzhì. Rúguǒ Visio = True, cǐ zhǐbiāo jiāng xiǎnshì kěnéng de dìngdān kāi cāng diǎn. Rúhé pèizhì cǐ zhǐbiāo xuǎnzé: Túbiǎo =>zhǐbiāo lièbiǎo => BB hé St Dev =>biānjí. Jiāng chūxiàn zhǐbiāo chuāngkǒu. Shèzhì cānshù. Chuàngjiàn múbǎn:Charts => Template => Save Template.


用户没有留下任何评级信息