• 概述
  • 评论
  • 评论 (12)
  • 新特性

Auto Trend Lines

Simply drop the indicator to the graph and support and resistance levels will be shown automatically!

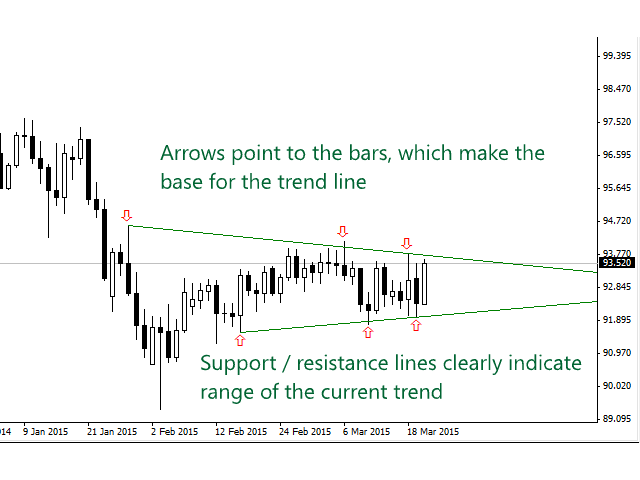
The indicator for automatic drawing of support and resistance levels based on THREE points.

  • Identified points are marked on the chart
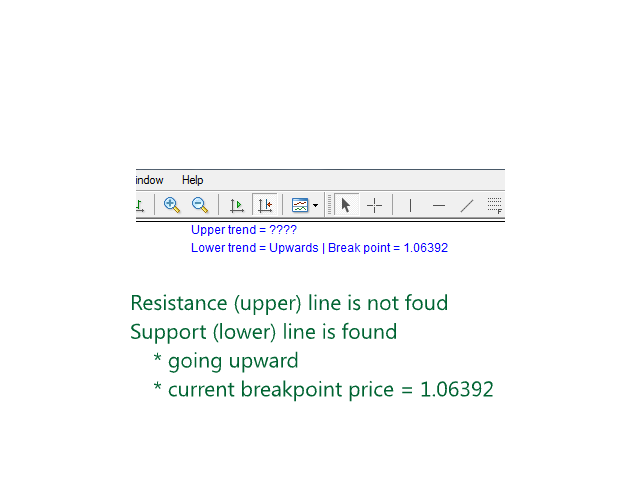
  • Indicator shows break through price for both bullish and bearish trends (if found)
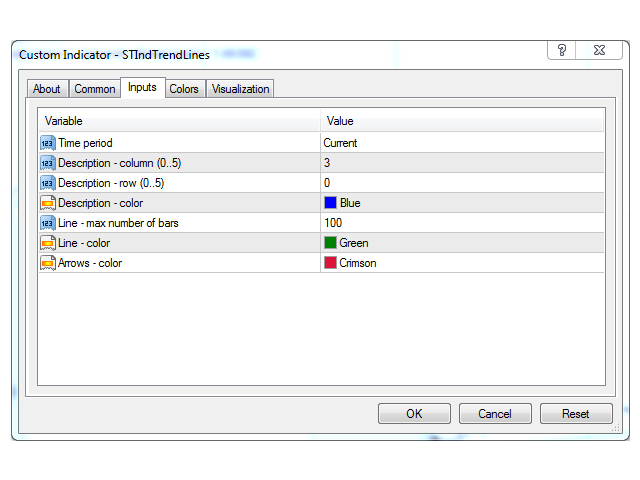
  • You can specify on how many bars the indicator shall look in order to identify supporting points.

In addition, you can select on which time frame the indicator will work. That means, you can use H1 chart for your analysis while seeing trend and break through points from H4.

Please contact the author if you have any suggestions for improving the indicator.

推荐产品
Simply drop the indicator to the chart and Fibonacci levels will be shown automatically! The indicator is developed for automatic drawing of Fibonacci levels on the chart. It provides the abilities to: Select the standard Fibo levels to be shown Add custom levels Draw the indicator on the timeframes other than the current one. For example, the indicator is calculated on the weekly period (W1) and is displayed on the monthly period (MN1) Select the timeframes the indicator will be available on Ca
该指标旨在与艾略特波浪理论相结合,提供了两种不同的工作方式: 自动工作: 在此模式下,指标会自动检测图表上的所有五个动机波浪,并为您提供预测和潜在的逆转区域。它还可以提供警报和推送消息。这种自动功能简化了识别和分析艾略特波浪模式的过程。 手动工作: 此选项适用于喜欢手动方法的交易员,用于手动绘制九个不同等级的波浪。每个等级都可以在它们出现后通过调整图表上的绘制线条来单独定义。此功能简化了手动绘制波浪的过程,使其更加高效。需要注意的是,所有绘图数据将保存在平台的数据文件夹中,以备将来参考。 参数: Name: 指标名称。 Use_System_Visuals: 启用或禁用指标主题,以匹配交易平台的整体外观。 Explain_Comment: 允许启用或禁用波浪编号的解释性注释,有助于理解已识别的波浪。 Show_Last_Candle_Counter: 启用或禁用蜡烛计时器,提供有关当前蜡烛收盘的剩余时间的信息。 Candle_Counter_Color: 蜡烛计时器文本的颜色。 Basic_Wave_Color: 用于表示波浪的主要颜色。 Bullish_Wave_Color: 当检测
SRP (Strong Retracement/Reversal Points) is a powerful and unique support and resistance indicator. It displays the closest important levels which we expect the price retracement/reversal! If all level are broken from one side, it recalculates and draws new support and resistance levels, so the levels might be valid for several days depending on the market! Key Features You can use it in all time-frames smaller than daily! Displays closest significant support and resistance levels Update the l
Capital Pivot
Mr Nisit Noijeam
Pivot Points และระดับ (Support) และ(Resistance) บนแผนภูมิการเทรดใน MetaTrader 4 สำหรับตลาด Forex : คำนวณ Pivot Points : สคริปต์คำนวณจุด Pivot โดยใช้ข้อมูลราคาประวัติศาสตร์ เช่น ราคาเปิด, ราคาสูงสุด, ราคาต่ำสุด, และราคาปิด จากช่วงเวลาที่กำหนด (เช่น วัน, ชั่วโมง, ฯลฯ) จุด Pivot และระดับต่างๆ เช่น R1, R2, R3 (ระดับการต้านทาน) และ S1, S2, S3 (ระดับการสนับสนุน) ถูกคำนวณออกมา แสดงบนแผนภูมิ : หลังจากคำนวณจุด Pivot และระดับต่างๆ, สคริปต์จะแสดงเส้นเหล่านี้บนแผนภูมิ MT4 เพื่อช่วยให้นักเทรดสามารถเห็นจุดที่
Auto Fibo mq
DMITRII GRIDASOV
“自动 FIBO”指标 - 交易中很棒的辅助工具! 指标自动计算并放置在图表斐波那契水平和局部趋势线(红色)上 斐波那契水平表明价格可能反转的关键区域 最重要的水平是 23.6%、38.2%、50% 和 61.8% 您可以将其用于反转剥头皮或区域网格交易 使用自动 FIBO 指示器还有很多机会来改进您当前的系统 ............................................................................................................. // 这里提供更多优秀的 EA 交易和指标: https://www.mql5.com/en/users/def1380/seller // 也欢迎您加入盈利、稳定、可靠的信号 https://www.mql5.com/en/signals/1887493 它是仅在该 MQL5 网站上提供的原创产品。
Black series MT4
Dmitriy Kashevich
1 (1)
Black series MT4 - The indicator is designed for trading on binary options with Timeframe M1-M5-M15 Multicurrency (Works on cryptocurrency and currency pairs) The signal appears when the candle opens Up to 90% correct signals There is no signal redrawing at all Can be used with other indicators. Good for scalping! In Settings there is: -Indicator working methods -I Allert Arrow color Red signal down Blue signal up Also watch the video how the indicator works and signals
The indicator draws trend lines based on Thomas Demark algorithm. It draws lines from different timeframes on one chart. The timeframes can be higher than or equal to the timeframe of the chart, on which the indicator is used. The indicator considers breakthrough qualifiers (if the conditions are met, an additional symbol appears in the place of the breakthrough) and draws approximate targets (target line above/below the current prices) according to Demark algorithm. Recommended timeframes for t
UniversalIndicator
Andrey Spiridonov
UniversalIndicator is a universal indicator. A great helper for beginners and professional traders. The indicator algorithm uses probabilistic and statistical methods for analyzing the price of a trading instrument. The indicator is set in the usual way. Advantages of the indicator works on any time period works with any trading tool has a high probability of a positive forecast does not redraw Indicator Parameters LengthForecast = 30 - the number of predicted bars
Fibonacci SR Indicator
Martin Eshleman
3 (2)
菲波纳奇支撑阻力指标 本指标创建支撑和阻力线。此指标基于菲波纳奇回撤和扩展级别。它会考虑菲波纳奇级别的多种组合,并在这些基础上绘制支撑/阻力线。此指标使用的顶部和底部由之字折线指标计算而来。如有必要,之字折线也可以在图表上绘制。 本指标考虑许多过去的反转点和菲波纳奇比率级别的组合,而当它看到多条线在相同的价格汇合,那么这将成为指标绘制的支撑/阻力线。未来的市场反转往往会正好出现在这些线附近。这是一个自动指标。所以,旧线将被删除,新线将随着市场的进步而绘制。 设置 Bars_Back - 向后一定数量的柱线用于所有计算。数量较少则较少反转点将被使用,因此,绘制的支撑和阻力线较少。向后更多柱线则有更多反转点将被使用,因此,绘制的支撑和阻力线较多。  Buffer_Space - 这表示每个已计算的菲波纳奇级别所需的汇合之间的最大点数。该数值越高,则确切的汇合必须越少。数字越低,则精确汇合必须更多,因此有较高的可靠性。例如, 让我们设为 10 点, 且指标运行在非分形的 4-位报价经纪商 (同样是 10 点)。此指标看到 3 个 菲波纳奇 回撤级别,分别在 1.4995, 1.5000,
FREE
Free automatic fibonacci
Tonny Obare
4.64 (61)
Free automatic Fibonacci is an indicator that automatically plots a Fibonacci retracement based on the number of bars you select on the BarsToScan setting in the indicator. The Fibonacci is automatically updated in real time as new highest and lowest values appears amongst the selected bars. You can select which level values to be displayed in the indicator settings. You can also select the color of the levels thus enabling the trader to be able to attach the indicator several times with differe
FREE
VSAs Volume Channel
Alexander Lasygin
Индикатор высчитывается по сложному авторскому алгоритму. Он строится с учетом тенденции по зонам перекупленности перепроданности объёмов . Это позволяет выявлять дивергенцию объёмов , выявить так называемые приседающие бары. Также он определяет уровни входа в рынок и цели. Средняя линия канала является предполагаемым уровнем отката. RPeriod- период расчета индикатора Indicator_Level - уровень зон перекупленности перепроданности Draw Fibo Levels - отображаем целевые уровни Fibo Level Col
Fibonacci convergence master TTT
The Trading Team Ltd
5 (1)
Launch promotion For a limited time only:  30$ instead of 157$ Summary Shows multiple Fibonacci retracements, projections and expansions ratios at a glance Description A Fibonacci confluence level is a price zone where Fibonacci retracements, projections and expansions meet closely when measuring a swing This technique is used by  intermediate and advanced traders to detect possible reversal zones Tired of manually drawing the same Fibonacci ratios for the same X, A, B, C points to eventually f
Auto Levels
Yaroslav Varankin
Auto Level this tool is able to determine the levels of support and resistance. search and display when the price has broken through the level and when it pushed off from it. the indicator can be useful if you use resistance support levels in your trading. or the highs and lows of the price, then it will greatly simplify your work and help you more quickly and more accurately determine the rebound or breakdown of the current trend or tendencies level. blue line bottom uptrend red line on top dow
The indicator displays 4 current levels between which the price is located. The levels are calculated based on the range of the previous day. The number and value of levels is arbitrary and expressed as a percentage. The position of the levels is calculated from the minimum of the previous day (an example can be found in the description of the parameters). It is advisable to place the levels in the settings line in order, nevertheless, the indicator will sort them by itself and if levels are fou
Introduction In the fast-paced world of financial market trading, success often hinges on the ability to spot and leverage trends. Among the various strategies available, momentum trading stands out as a powerful tool for traders seeking to capitalize on market movements. In this article, we will delve into the concept of momentum, its significance in trading, and the numerous benefits it offers to traders. What is Momentum? Momentum in trading refers to the tendency of assets to continue movin
The Wing Patterns indicator scans for many different kinds of Patterns using an XABCD structure. The term Wing Pattern is used to refer to all types of patterns based on a general XABCD structure, which is plotted in an alternate high-low extreme form. In other words, assume that point X is started at a low point on the chart. The point A is plotted at the next highest point within a certain number of bars. This certain number of bars is called the depth level. In this example, point B would be
Fibonaccitools
Aymn Sʿyd Ahmd Hsn Alkwmy
斐波那契回撤是交易者可以用來繪製支撐線、確定阻力位、下止損單和設定目標價格的流行工具。 斐波納契回撤是通過在股票圖表上取兩個極值點並將垂直距離除以關鍵斐波納契比率 23.6%、38.2%、50%、61.8% 和 100% 來創建的。 斐波那契工具指標將繪製斐波納契工具,例如 回撤、弧線、扇形、擴張、時區。 基於鋸齒形指標" 斐波那契回撤是交易者可以用來繪製支撐線、確定阻力位、下止損單和設定目標價格的流行工具。 斐波納契回撤是通過在股票圖表上取兩個極值點並將垂直距離除以關鍵斐波納契比率 23.6%、38.2%、50%、61.8% 和 100% 來創建的。 斐波那契工具指標將繪製斐波納契工具,例如 回撤、弧線、扇形、擴張、時區。 基於鋸齒形指標"
The indicator detects and displays the AB=CD harmonic pattern on the chart according to the scheme provided in the screenshot. The pattern is plotted by the extreme values of the ZigZag indicator (included in the resources, does not require additional installation). After detecting the pattern, the indicator notifies of that by the pop-up window, a mobile notification and an email. The indicator highlights not only the complete figure, but also the time of its formation. During the formation the
Infinity Trend Pro
Yaroslav Varankin
1 (1)
This is a trend indicator without redrawing Developed instead of the binary options strategy (by the color of the Martingale candlestick) Also works well in forex trading When to open trades (binary options) A signal will appear in the place with a candle signaling the current candle It is recommended to open a deal for one candle of the current timeframe M1 and M5 When a blue dot appears, open a deal up When a red dot appears, open a trade down. How to open trades on Forex. When a signal is rec
FiboRec
Alfred Kamal
This indicator depends on Fibonacci lines but there is a secret lines i used them, by using FiboRec indicator you will be able to know a lot of important information in the market such as: Features You can avoid entry during market turbulence. You can enter orders in general trend only. You will know if the trend is strong or weak. Signal Types and Frame used You can use this indicator just on H1 frame. Enter buy order in case Candle break out the square area and closed over it, at least 20
Introducing our innovative trading indicator, designed to transform the way you analyze price movements. The [Indicator Name] goes beyond traditional methods by dynamically drawing two distinct trends on the chart. The space between these trends acts as a unique reflection surface, providing valuable insights into potential market reversals and trend continuations. Key Features: Dual Trend Drawing: Automatically draws two trends on the chart, creating a visually distinctive analysis of price mov
The indicator detects and displays 3 Drives harmonic pattern (see the screenshot). The pattern is plotted by the extreme values of the ZigZag indicator (included in the resources, no need to install). After detecting the pattern, the indicator notifies of that by a pop-up window, a mobile notification and an email. The indicator highlights the process of the pattern formation and not just the complete pattern. In the former case, it is displayed in the contour triangles. After the pattern is com
PABT Pattern Indicator - it's classical system one of the signal patterns. Indicator logic - the Hi & Lo of the bar is fully within the range of the preceding bar, look to trade them as pullback in trend. In the way if indicator found PABT pattern it's drawing two lines and arrow what showing trend way.  - First line - it's entry point and drawing at: 1. On the high of signal bar or on middle of the signal bar (depending from indicator mode) for buy; 2. On the low of signal bar or on middle of t
COG LR Osc AM
Andriy Matviyevs'kyy
The presented indicator allows you to determine potential entry points into the market and set protective orders at reasonable levels. This product can be useful for both beginners and experienced traders. The indicator is based on calculation methods proven by time and practicing traders. The indicator is calculated in two stages: At the first stage, linear regression (LR) of the selected price type is determined for a given number of chart periods. At the second stage, the obtained data is p
UPD1 Fibo Levels
Vitaliy Kuznetsov
5 (3)
该指标分析指定数量的蜡烛并根据高低绘制斐波那契水平。 由于级别正在重新排列,我们对范围的右侧感兴趣。 价格会吸引水平并对触摸做出反应。 使用此工具在修正后找到趋势入口点。 如果在左边我们看到水平已经完美上升,那么我们可以假设我们已经在极值点找到了运动的终点。 所有线条都通过缓冲区或对象绘制(可选)。 输入参数 。 Bars Count - 计算范围 。 Visual Button - 按钮显示(启用/禁用) 。 Corner - 按钮锚定角度 。 X indent - 以像素为单位的水平填充 。 Y indent - 以像素为单位的垂直填充 。 Label Visual - 显示级别标签 。 Label Font Size   - 字体大小 。 Label Shift Bars   - 在酒吧的铭文的缩进 。 Label Tooltip   - 在关卡上方的光标下显示文本 。 Draw Lines   -  使用缓冲区或对象绘制 。 Box Visual   - 启用/禁用框视觉 。 Box Width   - 箱线粗细 。 Box Style   - 框线样式 
FREE
This Indicator is use the ZigZag to calculate the Upper and  Lower Bound and the uptrend and the downtrned. Red for downtrend, Green for uptrend and Yellow is for the horizontal trend this horizontal trend also bookmarked the upper limited and the lower limited the the price swings.  Or in simple the Support and the Resistance level. However, You may use the Heikin Ashi to confirm the trend of the buy sell signal above. I cannot guarantee the win rate, Nevertheless, you must study well the timef
BuySellAlert
Oleg Borisov
The BuySellAlert arrow indicator is developed based on the use of HMA, Laguerre, CCI, and ATR . The BuySellAlert arrow indicator: generates  entry points  for BUY and SELL  displays current profit ; displays  current spread. The profitability of the indicator is shown in the screenshot on the example of the GBPUSD pair Does not redraw and works on opening bar. Time frames - M1-M30. Recommended Time frames M5-M15. Setting ALARM - enable/disable the alarm; Push    - enable/disable Push notificatio
Fibo World
Pavel Verveyko
The indicator builds a graphical analysis based on the Fibonacci theory. Fibo Fan is used for the analysis of the impulses and corrections of the movement. Reversal lines (2 lines at the base of the Fibonacci fan) are used to analyze the direction of movements. The indicator displays the of 4 the target line in each direction. The indicator takes into account market volatility. If the price is above the reversal lines, it makes sense to consider buying, if lower, then selling. You can op
CyberZingFx Volume Plus
Afsal Meerankutty
4.93 (15)
Advanced version of CyberZingFx Volume Plus, the ultimate MT4 indicator for traders seeking highly accurate buy and sell signals. With an additional strategy and price action dot signals that enhances its effectiveness, this indicator offers a superior trading experience for professionals and beginners alike. The CyberZingFx Volume Plus Advanced version combines the power of volume analysis and historical price data with an additional strategy, resulting in even more precise and reliable signals
Koala Fibo Base Time
Ashkan Hazegh Nikrou
3 (1)
欢迎来到考拉菲波基地时间     欢迎来到考拉菲波时区     欢迎来到考拉斐波时间延长     欢迎使用Meta Trade错过的工具! 简单介绍: 斐波那契时区是基于斐波那契序列的垂直线。这些线沿X轴(日期轴)延伸,作为一种机制,可根据经过的时间预测逆转。 通常将主要的低点或高点作为起点。距离开始较小,并且随着斐波那契数列的扩展而增加。 图表专家可以将斐波纳契时区扩展到未来,以预测潜在的反转点。 您可以通过Google搜索“ Fibo Base Time,Fibo时区,Fibo Time Extension”按这些名称找到该指标 基本定义为更多信息:     斐波那契时区是垂直线,代表潜在的区域,在该区域中可能会出现高,低或反转的趋势。     斐波那契时区可能并不表示确切的反转点。它们是需要注意的基于时间的区域。     斐波那契时区仅表示与时间相关的潜在重要区域。不考虑价格。该区域可能标记为次要的高或低,或显着的高或低。     斐波那契时区基于斐波那契数列,这给了我们黄金分割率。在整个自然和建筑中都可以找到这个比例。
FREE
该产品的买家也购买
TrendMaestro
Stefano Frisetti
5 (2)
note: this indicator is for METATRADER4, if you want the version for METATRADER5 this is the link: TRENDMAESTRO recognizes a new TREND in the bud, he never makes mistakes. The certainty of identifying a new TREND is priceless. DESCRIPTION TRENDMAESTRO identifies a new TREND in the bud, this indicator examines the volatility, volumes and momentum to identify the moment in which there is an explosion of one or more of these data and therefore the moment in which prices have strong probability of f
引入神奇外汇指标:释放精准交易的力量 你是否厌倦了寻找在所有时间框架上都能取得出色结果的完美外汇指标?别再继续寻找了!神奇外汇指标已经来到,改变您的交易体验,将您的利润推向新的高度。 神奇外汇指标基于尖端技术和多年的精心开发,堪称外汇市场上的强大和精确的巅峰之作。这个卓越的工具旨在满足各个层次的交易者需求,在追求持续盈利性方面提供无与伦比的优势。 神奇外汇指标的独特之处在于其无与伦比的适应性。无论您是日内交易者、波段交易者还是更喜欢长期持仓,该指标都经过优化,能在所有时间框架上取得出色的结果。然而,当在1小时时间框架上使用时,它的准确性和捕捉市场复杂走势的能力得到真正展示。 准备好对神奇外汇指标的准确性和可靠性感到惊讶。其先进的算法无缝结合了强大的指标、统计分析和趋势识别,实时为您提供全面的市场视图。指标的智能和动态信号使您能够自信地做出明智的交易决策,最大限度地提高获胜交易的机会。 不再犹豫和迷茫。神奇外汇指标消除了交易的猜测,使您在市场参与者中具有独特的优势。其用户友好的界面和直观的设计使得无论是经验丰富的专业人士还是初学者都能轻松掌握这一卓越工具的力量。 有了神奇外汇指标的支持,
Gann Price Level
Kirill Borovskii
The indicator is designed to work on any trading platform. The program is based on proprietary algorithms and W.D.Ganna's mathematics, allowing you to calculate target levels of price movement based on three points with the highest degree of certainty. It is a great tool for stock trading. The indicator has three buttons: NEW - call up a triangle for calculation. DEL - delete the selected triangle. DELS - completely remove all constructions. The probability of achieving the goals is more than 80
Ferox Breakout
Tat Dat Nguyen
The breakout algorithm is a technique based on price, price features, to shape a breakout strategy. The strategy in this indicator will not be redrawn (none-repaint indicator), it is suitable for short or long term traders In the screenshot is the EURUSD pair, these currency pairs, commodities or stocks, it have similar strength *Non-Repainting (not redrawn) *For Metatrader4 Only *Great For Scalping *Great For Swing Trading *Arrow Entry, Green is Long, Red is Short *Works On Any Timeframe *Work
IA Trendx3 PRO
Marco Aurelio Santos Costa
What if God Created a Trade System? No miracles... Just see how mathematics can be effective in the market. We managed to combine technical analysis / price action into indicators, creating the best setup for trading, be it in Forex, Indices, or stocks. It took us 2 years to create something that really works, and now it's time for you to discover it. TrendX3 is a revolution in trend analysis. Based on advanced algorithms and real-time data, it provides valuable insights so that you can make inf
Gann Swing Structure
Kirill Borovskii
5 (1)
This indicator is based on the mathematics of the great trader W.D. Ganna. With its help, you can easily find strong levels by analyzing swings to find the optimal entry point. The indicator works on all instruments and all timeframes. The indicator is fully manual and has control buttons. All you need to do is press the NEW button, a segment will appear, which you can place on any movement, swing or even 1 candle that you want to analyze. By placing the segment, press the OK button. A grid (th
SMCpro VIP MT4  Original Price  $620   ---  Currently Price 20% OFF ( for unlimited use )   BONUS  AUX VIP Club 2024 : Include  EA Airbag  and  Load Data History  to enhance the performance of this tool to its maximum potential  Click Here to Download Files   ( for users only )   Hello World! Introducing.. SMCpro VIP tool and Indicator for MetaTrader 4, designed to revolutionize your trading experience with the ICT Smart Money Concept. This system is meticulously crafted to empower trad
Candle Power Pro
Thushara Dissanayake
4.33 (6)
使用 Candle Power Pro 指示器释放真实体积信息的力量。此动态工具捕获每根蜡烛的实际交易量数据,并将其显示为总交易量的百分比。通过这样做,它使您能够辨别市场上买卖双方之间正在进行的斗争。 Candle Power Pro 显示买家和卖家之间的战斗占总交易量的百分比,为您提供有关市场动态的宝贵见解。您可以通过分析买家和卖家的交易量轻松确认突破,确保更准确的进入和退出点。此外,您可以利用买家和卖家的交易量来确认趋势,从而提高交易策略的可靠性。此外,您可以通过分析买家和卖家的交易量变化来识别趋势逆转,从而让您领先于市场变化。 该指标提供了一系列功能来增强您的交易体验。您可以将成交量平均值绘制为线条以便于可视化,并将成交量百分比与其他 19 个符号进行比较以进行进一步分析。 Candle Power Pro 还采用基于体积百分比的彩色蜡烛,能够快速识别市场变化。移动和弹出提醒让您了解重要的市场动向,同时轻松访问账户信息确保快速参考。 通过将实际交易量信息纳入您的交易策略,您可以获得宝贵的见解并改进您的决策过程。对于任何认真的外汇交易者来说,都不要错过这款经济实惠且必不可少的工具。
Market Breaker Updated version 3
Allistair Kabelo Mandow
1 (1)
Features for software Main functions: Accurate entry signals WITHOUT REPAINTING! Once a signal appears, it remains valid! This is a significant distinction from repainting indicators that might provide a signal and then alter it, potentially leading to deposit losses. Now, you can enter the market with higher probability and precision. There's also a function to colour candles after an arrow appears until the target (take profit) is reached or a reversal signal appears . Display of STOP LOSS
Weis Wave with Alert
Trade The Volume Waves Single Member P.C.
4.79 (19)
Rental/Lifetime Package Options and Privileges' * For optimum results the yearly or lifetime package is suggested due to live training and Discord  channel trading with the  creator! Rent Monthly Six Months   Yearly/Lifetime Weis Wave with Speed with Alert+Speed Index x x x Manual  x x x Quick Set up Video x x x Blog x x x Lifetime Updates x x x Setup and Training Material x x Free Rectangle Break Alert Tool      x Discord Access Channel "The SI traders" x 2-hour live methodology traini
Full STO
Roman Smoroda
完整的 STO 指标(包括三个 STO 指标的所有版本:高级版、黄金版、白银版) - STABLE TRADE OPTION 专为自动二元期权交易而设计。 请仔细阅读!!!!! 重要事项 在一个终端中创建两个不同到期时间的模板,一个为 18:01、18:02,到期时间为 1 至 15 分钟的模板,另一个为 22:00,到期时间为 10 至 20 分钟的模板。 胜率:过去 5 年为 71 资金管理:存款的 0.3 此版本的指标仅用于莫斯科时间 18:01、18:02、22:00 的交易,白银和黄金的到期时间为 1 至 15 分钟,高级版本的到期时间为 10 至 20 分钟。信号出现在蜡烛内部并立即打开交易,如果您使用连接器,则在蜡烛内部打开一个标记。 该指标配置齐全,您无需自行更改。安装并交易 请勿在未经任何检查和测试的情况下购买该指标,我花了两年多时间在真实账户上检查所有版本的sto并查看结果。经过多年测试,我们选择了最佳参数。 应用算法 1. 将指标安装到信号顾问中,信号顾问会自动向经纪商平台发送信号。 - mt2trading.
Full Forex Market View Dashboard
Opengates Success International
5 (2)
完整的外汇市场视图仪表板指示器 这是一个自定义指标,旨在让交易者全面了解市场上正在发生的事情。 它使用实时数据访问市场并显示成功交易所需的每一点信息。 安装: 在将此指标附加到您的窗口图表之前,请转到您的 MT4 的市场观察面板并隐藏所有您不需要或交易的货币对,并将其余货币对留在那里。 原因是 FFMV 仪表板将显示出现在 MT4 市场观察中的所有货币对。 它最多可以显示 30 个或更少的货币对。 如果它超过您 MT4 的市场观察中的那个,它会模糊和毁坏 FFMV 仪表盘上的字体和图像! 它不会正确显示。 用法:      单人交易      对于篮子交易(见截图如何)      也可用于多单交易      确认从您自己的交易系统等收到的信号的有效性。 成分:      时间范围:从 M1 到 MN1 当前蜡烛状态(买入/卖出      趋势:币种整体走势      影响:货币变动的幅度/波动性,见下文:      建立:货币正在建立      好:货币越来越严重      高:币值值得关注      强:要考虑方向  
Idea: RSI ( Relative Strength Index) and CCI ( Commodity Channel Index ) are powerfull to solved the market.  This indicator has Smoothed Algorithmic signal of RSI and CCI. So that, it separates the market into buy and sell zones, these areas are marked with arrows, red for downtrend, green for uptrend. This algorithm has the effect of predicting the next trend based on the historical trend, so users need to be cautious when the trend has gone many candles. Please visit screenshots
Chaos Indicator
Stefano Frisetti
DESCRIPTION The CHAOS INDICATOR has been developed to be used for the TRADING STRATEGY OF CHAOS, as described in the book. The book is in italian language only and can be obtained only on my website indicated below. DATAS COLLECTED AND SHOWN ON GRAPHS The CHAOS INDICATOR apply easily to any graph and any asset, and it is a TRADING FACILITATOR, as it identify immediately the following items on any graph: - The GP (= RIGHT PRICE) i.e. the price to which the asset should be attracted within 24
MT4平台"鹰眼指标":提升二元期权交易精准性 激发二元期权交易的潜力,带来无与伦比的准确性,"鹰眼指标"登场!作为一款强大的工具,引领交易者在波澜壮阔的金融市场中找到盈利机会。 利用MetaTrader 4(MT4)平台的直观性,"鹰眼指标"结合先进的算法和技术分析,实时提供全面的市场动态。其强大功能使交易者能够基于对价格模式、趋势和关键市场指标的全面评估做出明智的决策。 "鹰眼指标"核心的能力在于准确识别最佳的进出点。通过对价格走势的精确扫描,该指标能够快速检测潜在的反转、突破和趋势延续,使交易者能够抓住最有利可图的交易时机。 "鹰眼指标"提供用户友好的界面,确保交易体验顺畅。通过可定制的设置和可调整的参数,它能够适应个体化的交易风格、偏好和风险承受能力,为每个用户提供量身定制的体验。 "鹰眼指标"真正的力量在于减少情绪交易决策的影响。它提供客观、基于数据的洞察力,作为可靠的伙伴,减轻交易焦虑和不确定性。这个宝贵的工具使交易者能够做出有纪律性和理性的选择,培养更具策略性和盈利性的二元期权交易方法。 作为鹰眼指标的可靠性证明,它在二元期权交易社区中赢得了忠实的追随者。那些拥抱这一革命
Gann Zone Pro
Kirill Borovskii
This indicator identifies and displays zones, as it were areas of strength, where the price will unfold. The indicator can work on any chart, any instrument, at any timeframe. The indicator has two modes. The indicator is equipped with a control panel with buttons for convenience and split into two modes. Manual mode: To work with manual mode, you need to press the NEW button, a segment will appear. This segment is stretched over the movement and the LVL button is pressed. The level is displayed
This is a trend Predictor. Honestly I have to give some credit to some few developers I know personally because they helped pulled this off.  The trend indicator uses special optics to direct the flow of price . it detects where the trend is moving into  It uses price action and a few other embedded custom indicator. You can use it in all timeframes and will be available at a much cooler price.  Please test this Indicator before buying to make sure you like what you see. I can't guarantee th
如果您经常因为只使用一种指标而亏损交易,那么请尝试此交易工具。 该交易工具使用多个指标。 我经常观察只使用 RSI 指标的交易者。 很多时候,市场超卖但仍然下跌,或者市场超买但仍然上涨。 因此,您需要使用多个指标。 隆重推出新版本 V 3.40 MTF PPAAF:多时间框架精确价格行为箭头过滤。 该交易工具使用各种指标来加强市场走势的方向。 该交易工具中使用的第一个指标是双随机指标。 在这里,我使用两种随机指标,即快速随机指标和慢速随机指标。 在快速随机指标中,有一条快速随机指标主线和一条快速随机指标信号线。 同样,在慢随机指标中,有一条慢随机指标主线和一条慢随机指标信号线。 主线和信号线的交叉/交叉将形成向上和向下箭头。 第二个指标是Double RSI,即快速RSI和慢速RSI。 两者相交将形成一个向上和向下的箭头。 第三个指标是Double CCI,即快速CCI和慢速CCI。 两者相交将形成一个向上和向下的箭头。 第四个指标是双MACD。 与双随机指标类似,这里有快速 MACD 和慢速 MACD。 在快速 MACD 中,有一条快速 MACD 主线和一条快速 M
Market Breaker Pro
Allistair Kabelo Mandow
PYTHONFX INCEPTION TRADING SYSTEM THE BROKERS WORST NIGHTMARE... IMPORTANT! After the purchase please send me a private message to receive the installation manual and the setup instructions. We proudly introduce the PYTHONFX ROYAL CIRCLE Inception trading system, your key to financial freedom.   This is the brokers worst nightmare. Seriously! Modern market conditions require modern solutions & if you are still struggling to analyse the charts and struggling to find consistency in the
"Dragon's Tail"是一种综合交易系统,而不仅仅是一个指标。这个系统以分钟为单位分析每一个蜡烛,这在市场波动性高的情况下特别有效。 "Dragon's Tail"系统确定市场的关键时刻,称为"公牛和熊的战斗"。基于这些"战斗",系统给出交易方向的建议。在图表上出现箭头的情况下,这表明有可能在指示的方向上开设两个交易。黄线和绿线分别作为第一和第二个交易的获利水平。在达到黄线水平并关闭第一笔交易后,建议在第二笔交易开启的水平上设定止损。 时间框架和工具的选择取决于交易员的偏好,但为了达到最佳结果,建议使用H4和D1的时间框架,并考虑所选工具的差价大小。 "Dragon's Tail"的设置参数可以分为两组: 直接影响交易结果的参数: 历史深度 - 只影响图表上入口点的显示。推荐值:D1 - 10,H4 - 15,H1 - 20。 获利1和获利2 - 影响最终结果。取决于时间框架的推荐值:D1 - 250/450,H4 - 150/250,H1 - 75/150。 负责系统视觉设计的参数。可以根据交易员的意愿进行设置。 重要的是要记住,"Dragon's Tail"是一个需要交易员
Intro to APAMI, PROfessional edition Trace exactly how far prices trend between two price levels with fractional pip precision, while qualifying price movement between the same price levels. Completely automate when trends change direction and volatility, without any lag .  This is possible because the Accurate Price Action Measurement Indicator (APAMI) actually does what no other indicator can:  measure price distance between two points and simultaneously qualify the price action that occurs
Fibonacci Retracements Pro
Savia Forex Software Solutions
Fibonacci Retracements Pro The Fibonacci Retracements Pro is a powerful yet easy to use indicator. It automatically plots all the important Fibonacci retracement and extension levels for you. FRP is dynamic powerful and seamlessly adjusts to whatever timeframe you are analyzing. Fibonacci Retracement Pro is optimized for ALL timeframes and ALL Currency pairs, Indices, Commodities, and Cryptocurrency pairs. Trade with improved confidence and maximize your success rate. Benefits Dynamic and Power
The Stochastic Basket Currency Strenght  brings the Stochastic indicator to a new level.  Expanding the boundaries of TimeFrames and mono-currency analysis, the SBCS take the movements of each currency that composes the cross and confront them in the whole basket of 7 crosses.  The indicator works with any combination of AUD, CAD, CHF, EUR, GBP, JPY, NZD, USD pairs and with full automation takes in account every stochastic value (main line) for the selected Time Frame.  After that, the indicator
Fnix l long position
Monique Ellen Miranda Dos Santos
现在用中文: 您是寻找金融市场长期机会的投资者吗? 我向您介绍自定义长期趋势指标。该指标专为希望在比日线、周线和月线更长时间跨度上交易仓位的交易者设计。 凭借清晰而准确的信号,您将获得所需的支持,以做出明智的决策。 主要特点: 长期策略:该指标非常适合致力于长期交易的投资者。 推荐时间框架: 我建议在比日线更长的时间框架上使用该指标,以获得最佳结果。 准确的信号: 等待指标生成的信号和蜡烛图的收盘,以做出明智的决策。 挂单交易: 为了优化使用,请考虑使用挂单交易,如买入止损单或卖出止损单。 适当的手数: 账户余额较小的情况下,可以通过使用0.01手的手数来进行有效的风险管理。 推荐货币对: 该指标的理想货币对包括XAUUSD(黄金)、XAGUSD(白银)、EURUSD(欧元/美元)和GBPUSD(英镑/美元)。 重要提示: 请记住,该指标是长期交易者的有价值工具。遵循推荐的指南,并将其适应到您的交易风格中。 如有任何问题或需要支持,请联系作者。 请注意,该指标是技术分析工具,不能保证盈利。 在使用任何指标或交易策略时,进行全面的市场分析并适当管理风险至关重要。 选择通过电子邮件直接从卖
Daotradingfx
Huynh Cong Chinh
标题:“Daotradingfx - 7年经验的波浪交易的完美关键” 外汇交易永远不是一件容易的事情,但通过daotradingfx指标,我找到了一个可靠的伙伴,为波浪交易打开了成功之门。建立在我七年的交易经验基础上,这个指标不仅仅是一个工具,更是市场理解和交易便利性的全面画布。 Daotradingfx以使用多个时间框架的能力而脱颖而出,这是一个关键功能,帮助我更深入地理解市场趋势和来自不同角度的市场动态。同时监控多个时间框架使我能够做出更准确的交易决策,提高任何策略成功的可能性。 Daotradingfx的另一个显着优势是其在跟踪多个货币对方面的灵活性。这种多样化不仅使我能够专注于多个货币对,而且扩大了市场观察范围,增加了发现交易机会的潜力。 特别是,daotradingfx非常适合波浪交易,在这种交易中,我可以利用短期波动来获取利润。多时间框架的功能是在趋势之间灵活转变的关键,帮助我抓住机会并避免不必要的风险。 Daotradingfx易于使用的特性不仅限于其功能;它还在于其易用性。即使对于初学者来说,适应这个指标的界面也是一种便利的体验。它的简单性不会降低
Channel Cluster
Vitalyi Belyh
5 (2)
Cluster indicator working in the price channel. For operation, the indicator builds a channel line - (dashed line). Inside the channel, cluster sections are determined that determine the direction of the price movement - (histograms in two directions), start with large arrows. Small arrows are plotted above / below each histogram - indicator increase volatility. The indicator does not redraw the values. Works on any tools and timeframes. Entrances are made when large arrows appear, inside s
Introducing the "Magic Trades" for MetaTrader 4 – your ultimate tool for precision trading in dynamic markets. This innovative indicator revolutionizes the way you perceive market trends by harnessing the power of advanced analysis to detect subtle changes in character, paving the way for optimal trading opportunities. The Magic Trades Indicator is designed to empower traders with insightful entry points and well-defined risk management levels. Through its sophisticated algorithm, this indica
Oni Scalper
Goh Cheng Wai
5 (2)
Dear Onis, This Indicator is used for   GBPUSD, US30 and GOLD on 1-Min Chart . For US30 , Depending on your broker, Minimum Lot Size will differ from 0.01 to 1.0 lots. My Current Account is trading at 1.0 lots at $1 per point . Please check with your Broker what's the Margin Required for your Minimum lot sizes before you trade on your Real account. I have Forward Tested the indicator for around 6 months before releasing it to the public. ( No Demo is available for the Indicator, Strategy
VTrende Pro mt4
Andrii Diachenko
3 (2)
VTrende Pro MT4 - MTF indicator for trend trading with a display panel for MT5 *** Videos can be translated into any language using subtitles (video language - Russian) Although the signals of the VTrende Pro indicator can be used as signals of a full-fledged trading system, it is recommended to use them in conjunction with the Bill Williams TS. VTrende Pro  MT4 is an extended version of the VTrende indicator. Difference between Pro version and VTrende: - Time zones - Signal V - signal 1-
Clidro FX
Mahmood Abdur Rafey Siddiqui
Clidro FX is a complete trading system designed and developed by Auxrum Analytics targeting the EURUSD, USDJPY, and GBPUSD FX pairs. It is currently available to MetaTrader 4 users. The Clidro FX algorithm, along with the optimized money-management and order-management rules sets up the basis for excellent trading results consistently over an extended period of time. The fundamental premise of the system is that each FX pair displays its unique quantitative characteristics while oscillating thro
作者的更多信息
Simply drop the indicator to the chart and Fibonacci levels will be shown automatically! The indicator is developed for automatic drawing of Fibonacci levels on the chart. It provides the abilities to: Select the standard Fibo levels to be shown Add custom levels Draw the indicator on the timeframes other than the current one. For example, the indicator is calculated on the weekly period (W1) and is displayed on the monthly period (MN1) Select the timeframes the indicator will be available on Ca
The indicator for automatic drawing of Fibonacci-based Moving Averages on the chart. It supports up to eight lines at a time. The user can configure the period of each line. The indicator also provides options to configure color and style of every line. In addition, it is possible to show indicator only on specific time frames. Please contact the author for providing additional levels or if you have any other suggestions.
Spread Tracker
Semion Tremsin
The indicator for presenting current spread in real time. It is a very simple still useful indicator for manual trading and market analysis. The indicator shows current spread (in 4-digit format) for the selected instrument. You can specify the place on the chart where indicator shall print the output as well as output color. Please contact the author if any changes are required.
Advanced ADX indicator that allows operating on many timeframes simultaneously! Unique indicator with the ability to display ADX charts not only on the current timeframe, but also on higher ones. The example attached shows how it is possible to see 3 ADX chart on M5, M15 and M30 timeframes respectively. This functionality allows to significantly improve the accuracy of determining the trend. The Timeframe Delta parameter specifies how much the indicator’s timeframe should be different from the t
Simply drop the indicator on a chart, and you will always know when candlesticks form one of the Price Action patterns! The indicator automatically analyzes recently closed candles, and notifies if they form any of the Price Action patterns. The following classical patterns are analyzed: Pin bar Outer bar Pivot Point Reversal Double base Closing price reversal Force bar Mirror bars Move-congestion-move For each pattern, the indicator also shows trade direction in accordance with the classical Pr
筛选:
无评论
回复评论
版本 1.6 2020.03.25
The indicator was recompiled on MT4 build 1260 in order to improve the performance, get the latest fixes and support the latest features of the MT4 library.
版本 1.5 2016.10.26
* Added optional sound alerts in case if new trenline is identified
* Added optional visual alerts in case if new trenline is identified
版本 1.4 2015.03.13
Now you can specify which colors will be used for drawing the indicator.