• 概述
  • 评论 (1)
  • 评论 (4)
  • 新特性

Basic Harmonic Patterns Dashboard MT5

5
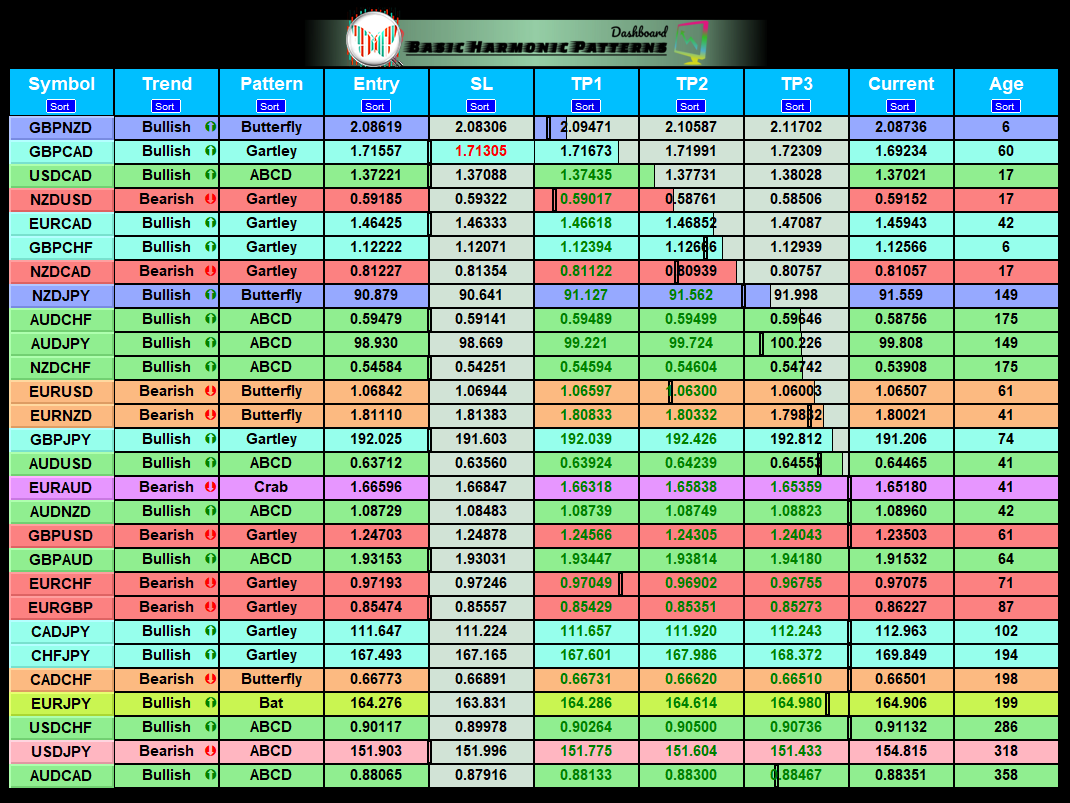
该仪表盘显示所选符号的最新可用谐波形态,因此您可以节省时间并提高效率 / MT4 版本

免费指标: Basic Harmonic Pattern

指标列

  • Symbol: 显示所选符号
  • Trend:  看涨或看跌
  • Pattern:  形态类型(Gartley、蝴蝶、蝙蝠、螃蟹、鲨鱼、Cypher 或 ABCD)
  • Entry:  入口价格
  • SL:止损价
  • TP1:第一止盈价
  • TP2:第二次获利价格
  • TP3:第三次获利价格
  • Current price:  当前价格
  • Age (in bars): 最后绘制的模式的年龄


主要输入

  • Symbols: 从 "28 种主要货币对 "或 "选定符号 "中选择。
  • Selected Symbols: 希望监控的符号,用逗号分隔("EURUSD,GBPUSD,XAUUSD")。如果您的经纪商为货币对设置了后缀或前缀,您必须在以下两个参数中添加(货币对前缀或货币对后缀)。
  • Max Iteration: 调整模式的最大迭代次数(如果该值越小,则模式越少,性能越快;如果该值越大,则模式越多,性能越慢)。事实上,它的工作原理如下:如果该值为 200,那么指标将检查最近的 200 个模式,不会再检查更多。如果是 50,则只检查最后 50 种形态。
  • Max allowed deviation (%):  该参数是指允许形成谐波形态的容差。该参数决定了谐波形态的结构可以变化多少,而指标不会将其视为有效形态。因此,如果设置的百分比越高,则模式识别的灵活性就越大,而如果设置的值越低,则限制性就越大。例如:如果设定值为 30%,那么指标将把当前价格 ±30% 范围内符合形态比例的形态视为有效形态。
  • Depth该参数决定了谐波形态的每个波浪中必须存在的最小条数。也就是说,在向上或向下运动中必须出现多少个条形图,指标才能将其识别为一个波浪。数值越大,形态越长,反之亦然。
  • Deviation偏差是指在一个波浪的两个震荡(波峰或波谷)之间,价格仍被视为有效的最大允许偏差量。因此,偏差越大,波峰或波谷之间的价格差异幅度就越大。
  • Backstep该参数指定指标在确定一个点是否为有效的高点或低点时要向后移动多少个条形图。换句话说,它表示在绘制 "之 "字形线时要考虑多少个回溯柱形图。
  • Pop-up alert向 MT5 终端发出警报。
  • Email alert: 电子邮件提醒。
  • Push notification alert: 向手机发送提示。
*其他输入与自定义颜色和透明度有关*。


如何使用

您可以按列对仪表盘进行排序,也可以在图形上显示形态(见下面的视频)。


重要提示:MT4 策略测试器无法测试多货币对指标/专家(您可以测试 MT5 版本以查看排名性能)。
警告: 使用第八项输入,您可以选择指标是重新显示还是延迟显示。如果设置为延迟,则指标不会在形态形成后调整信号。对于那些希望避免错误信号并提高交易一致性的交易者来说,这个选项可能更合适。不过,需要注意的是,延迟指标可能会失去灵敏度和适应市场快速变化的能力。

评论 1
Kenneth Wallace
183
Kenneth Wallace 2023.03.04 00:49 
 

GREAT product. was able to make profits same day as purchase. very verse indicator with lots of GOODIES. support system is also 10 out of 10.

推荐产品
Gartley Projections D
Oleksandr Medviediev
3 (2)
具有经过验证的概念和盈利能力的最佳、最有效、可靠的产品。感谢您的考虑。  该指标根据H.M.Gartley的发展(《股票市场利润》,1935年)识别和确认谐波模式(XABCD)。 它将D点投影为透视投影中的一个点(在设置中指定ProjectionD_Mode = true)。 不会重绘。当工作时间段的柱形图关闭时,如果已识别的模式点在Patterns_Fractal_Bars柱中未移动,则在图表上出现一个箭头(指向预期价格运动的方向)。从此刻起,箭头将永久保留在图表上。 注意:连续出现2-3个或更多箭头 - 这是市场条件的变化,而不是重绘。 总共有85种模式(包括Gartley-222和Gartley-222WS,完整列表可在评论部分的Google Drive链接中找到)。在所有已识别的模式中,只有最新识别的模式填充了单一颜色。 参数 DrawPatterns(true/false)- 以实心颜色绘制模式 ProjectionD_Mode(true/false)- 定义D点作为透视投影模式 Patterns_Fractal_Bars - 在认定为形成分形
Price Breakout pattern Scanner is the automatic scanner for traders and investors. It can detect following patterns automatically from your chart. Head and Shoulder - Common tradable pattern. Reverse Head and Shoulder - This pattern is the reverse formation of the Head and Shoulder. Double Top - When the price hits resistance level twice and decline toward the support level, the trader can anticipate sudden bearish breakout through the support level. Double Bottom - The double bottom pattern is
Introduction to X3 Chart Pattern Scanner X3 Cherart Pattern Scanner is the non-repainting and non-lagging indicator detecting X3 chart patterns including Harmonic pattern, Elliott Wave pattern, X3 patterns, and Japanese Candlestick patterns. Historical patterns match with signal patterns. Hence, you can readily develop the solid trading strategy in your chart. More importantly, this superb pattern scanner can detect the optimal pattern of its kind. In addition, you can switch on and off individu
The indicator detects and displays М. Gartley's Butterfly pattern. The pattern is plotted by the extreme values of the ZigZag indicator (included in the resources, no need to install). After detecting the pattern, the indicator notifies of that by the pop-up window, a mobile notification and an email. The pattern and wave parameters are displayed on the screenshots. The default parameters are used for demonstration purposes only in order to increase the amount of detected patterns. Parameters
Pan PrizMA CD Phase
Aleksey Panfilov
The Expert Advisor and the video are attached in the Discussion tab . The robot applies only one order and strictly follows the signals to evaluate the indicator efficiency. Pan PrizMA CD Phase is an option based on the Pan PrizMA indicator. Details (in Russian). Averaging by a quadric-quartic polynomial increases the smoothness of lines, adds momentum and rhythm. Extrapolation by the sinusoid function near a constant allows adjusting the delay or lead of signals. The value of the phase - wave s
Elliott Wave Trend MT5
Young Ho Seo
4 (3)
Elliott Wave Trend was designed for the scientific wave counting. This tool focuses to get rid of the vagueness of the classic Elliott Wave Counting using the guideline from the template and pattern approach. In doing so, firstly Elliott Wave Trend offers the template for your wave counting. Secondly, it offers Wave Structural Score to assist to identify accurate wave formation. It offers both impulse wave Structural Score and corrective wave Structure Score. Structural Score is the rating to sh
Matreshka
Dimitr Trifonov
5 (1)
Matreshka self-testing and self-optimizing indicator: 1. Is an interpretation of the Elliott Wave Analysis Theory. 2. Based on the principle of the indicator type ZigZag, and the waves are based on the principle of interpretation of the theory of DeMark. 3. Filters waves in length and height. 4. Draws up to six levels of ZigZag at the same time, tracking waves of different orders. 5. Marks Pulsed and Recoil Waves. 6. Draws arrows to open positions 7. Draws three channels. 8. Notes support and re
Trend and Signals MT5  indicator scans  30 trading Instruments (Forex, Metals and Indices).     It uses special algorithm on the  current market   based on   Pure Price Action   and display the overall trend and signal on the dashboard. When signals are produced the indicator sends alert and notification. Strategy for Signals This indicator uses the daily timeframe to determine the direction of the trend. The hourly timeframe is used to identify possible entries. Main trend and is determined by
123模式 是最受欢迎,功能强大和灵活的图表模式之一。该模式由三个价格点组成:底部,峰值或谷值以及38.2%至71.8%之间的斐波纳契回撤位。当价格突破最后一个峰值或谷值时,该形态被认为是有效的,此时指标绘制箭头,发出警报并可以进行交易。 [ 安装指南 | 更新指南 | 故障排除 | 常见问题 | 所有产品 ] 清除交易信号 可自定义的颜色和尺寸 实施绩效统计 可定制的斐波那契回撤水平 显示适当的止损和获利水平 该指标可用于查找连续或反转形态 它是不可重涂和不可重涂的 它实现了电子邮件/声音/视觉警报 123模式 可以表现为连续或反转模式。为了简化操作,该指标使您可以选择要寻找哪种类型的形态,使其成为趋势或反转交易者的绝佳工具。 设置 将指标加载到任何图表时,将显示一组选项作为输入参数。如果您认为它们太多,请不要感到失望,因为参数被分组为不言自明的块。这就是每个参数块的作用。 幅度-幅度表示替代价格点之间的最小柱线量。要找到大图案,请增加幅度参数。要查找较小的模式,请减小幅度参数。 闵。回撤-形态中所需的最小斐波那契回撤。设置为零不对其进行评估。 最大。回撤-形态中可能
Fit Line Trending
Ta Thi Thuy Linh
Fit line supports to extrapolation next movement of market, support for buy/sell decision. Indicator using spline algorithm to extrapolation.  You can change number of spline with parameter "PointsNumber" and number of extrapolation point with "ExtrapolateBars". Eextrapolation points will be save into csv format, with prefix in parameter "PointsPrefix", and store in folder File of Data Folder.
Gekko RSI Plus
Rodrigo Galeote
This is Gekko's Cutomized Relative Strength Index (RSI), a customized version of the famous RSI indicator. Use the regular RSI and take advantage two entry signals calculations and different ways of being alerted whenever there is potential entry or exit point. Inputs Period: Period for the RSI calculation; How will the indicator calculate entry (swing) signals: 1- Produces Exit Signals for Swings based on RSI entering and leaving Upper and Lower Levels Zones; 2- Produces Entry/Exit Signals fo
All Harmonics 26
Alexey Isavnin
3.8 (5)
Harmonic patterns are characteristic series of price movements with respect to Fibonacci levels, which statistically precede price reversals. This indicator searches for harmonic patterns. It is capable of recognising 26 classical and non-classical harmonic patterns : Classical Gartley Butterfly Alternate Butterfly Bat Alternate Bat Crab Deep Crab Three Drives Non-classical Shark Alternate Shark Cypher 5-0 Anti Gartley Anti Butterfly Anti Alternate Butterfly Anti Bat Anti Alternate Bat Anti Crab
Blahtech Market Profile MT5
Blahtech Limited
5 (8)
Was: $249  Now: $99   Market Profile defines a number of day types that can help the trader to determine market behaviour. A key feature is the Value Area, representing the range of price action where 70% of trading took place. Understanding the Value Area can give traders valuable insight into market direction and establish the higher odds trade. It is an excellent addition to any system you may be using. Inspired by Jim Dalton’s book “Mind Over Markets”, this indicator is designed to suit the
Noize Absorption Index
Ekaterina Saltykova
Noize Absorption Index - is the manual trading system that measures the difference of pressure between bears forces and bulls forces. Green line - is a noize free index that showing curent situation. Zero value of index shows totally choppy/flat market.Values above zero level shows how powerfull bullish wave is and values below zero measures bearish forces.Up arrow appears on bearish market when it's ready to reverse, dn arrow appears on weak bullish market, as a result of reverse expectation.
Ichimoku Aiko MTF
Michael Jonah Randriamampionontsoa
Ichimoku Aiko MTF is a collection of technical indicators that show support and resistance levels, as well as momentum and trend direction. It is a multi-timeframe indicator so you don't need to change the chart timeframe when you want to see the ichimoku clouds on a higher timeframe.  eg. The chart timeframe is M15 and you want to see on the M15 timeframe chart the H1 ichimoku indicators (the ichimoku in Metatrader can't do that) that's why you need to use Ichimoku Aiko MTF.
Harmonic Pattern Plus MT5
Young Ho Seo
4.5 (4)
Introduction Harmonic Patterns are best used to predict potential turning point. Traditionally, Harmonic Pattern was identified manually connecting peaks and troughs points in the chart. Manual harmonic pattern detection is painfully tedious and not suitable for everyone. You are often exposed under subjective pattern identification with manual pattern detection. To avoid these limitations, Harmonic Pattern Plus was designed to automate your harmonic pattern detection process. The functionality
Time And Sales Delta
Evgeny Shevtsov
5 (2)
The indicator displays the delta and the cumulative delta based on the "Time & Sales" deals list data. In addition to the standard timeframes, the indicator displays data regarding the seconds timeframes (S5, S10, S15, S20, S30) to choose from. Using the rectangle, user can select an arbitrary area in the indicator subwindow to view the ratio of the volumes of deals of buyers and sellers within this area. Indicator features: The indicator works correctly only on those trading symbols for whi
Indicator and Expert Adviser  EA Available in the comments section of this product. Download with Indicator must have indicator installed for EA to work. Mt5 indicator alerts for bollinger band and envelope extremes occurring at the same time. Buy signal alerts occur when A bullish candle has formed below both the lower bollinger band and the lower envelope  Bar must open and close below both these indicators. Sell signal occur when A bear bar is formed above the upper bollinger band and upp
Elevate Your Trading Experience with Wamek Trend Consult!   Unlock the power of precise market entry with our advanced trading tool designed to identify early and continuation trends. Wamek Trend Consult empowers traders to enter the market at the perfect moment, utilizing potent filters that reduce fake signals, enhancing trade accuracy, and ultimately increasing profitability.   Key Features: 1. Accurate Trend Identification: The Trend Consult indicator employs advanced algorithms and unparall
FanTracer
Syed Oarasul Islam
This Indicator draws Fibonacci Fan levels in two different ways. You can select whether to draw Fibonacci Fan levels based on your favourite ZigZag settings or you can let the indicator to draw Fan levels based on given number of bars or candles.  You can also set Mobile and Email notification for your favourite Fan  levels individually. With this indicator you will not have to feel lonely as the it can generate Voice alerts, which will keep you focused on your trading and remove boredom.  Prod
Introduction to Smart Renko The main characteristics of Renko Charting concern price movement. To give you some idea on its working principle, Renko chart is constructed by placing a brick over or below when the price make the movement beyond a predefined range, called brick height. Therefore, naturally one can see clear price movement with less noise than other charting type. Renko charting can provide much clearer trend direction and it helps to identify important support and resistance level
Introduction to Chart Pattern MT Chart Pattern MT is a chart pattern scanner to detect the triangle pattern, falling wedge pattern, rising wedge pattern, channel pattern and so on. Chart Pattern MT uses highly sophisticated chart pattern detection algorithm. However, we have designed it in the easy to use with intuitive user interface. Chart Pattern MT will show all the patterns in your chart in the most efficient format for your trading. You do not have to do tedious manual pattern detection an
Introduction Excessive Momentum Indicator is the momentum indicator to measure the excessive momentum directly from raw price series. Hence, this is an extended price action and pattern trading. Excessive Momentum Indicator was originally developed by Young Ho Seo. This indicator demonstrates the concept of Equilibrium Fractal Wave and Practical Application at the same time. Excessive Momentum detects the market anomaly. Excessive momentum will give us a lot of clue about potential reversal and
Supply Demand Ranger
Krzysztof Janusz Stankiewic
5 (2)
The indicator draws supply and demand zones. The zone timeframe can be set independently of the chart timeframe. For instance, it is possible to set M5 zones on an H4 chart. The importance of zones can be adjusted using the zone strength parameter. Demand zones are displayed if at least one candle in the range of the zone is entirely above the zone. Similarly, supply zones are displayed if at least one candle within the zone is entirely below the zone.
Introducing the Power Trade Plus indicator designed by a small group of traders with a few years of experience trading the market profitably.  The Power Trade Plus is derived from the Power Trade indicator,  the indicator strive in powerful sniper entries and take profit levels,  with an algorithm that's can determine the markets volatility and Provides entries based on the current market volatility. This indicator is much more effective in stock ,currencies and indices.
KT Renko Patterns MT5
KEENBASE SOFTWARE SOLUTIONS
KT Renko Patterns scans the Renko chart brick by brick to find some famous chart patterns that are frequently used by traders across the various financial markets. Compared to the time-based charts, patterns based trading is easier and more evident on Renko charts due to their uncluttered appearance. KT Renko Patterns features multiple Renko patterns, and many of these patterns are extensively explained in the book titled Profitable Trading with Renko Charts by Prashant Shah. A 100% automate
Riko Trend mt5
Nadiya Mirosh
The Riko Trend indicator is a revolutionary trend trading and filtering solution with all the important features of a trend tool built into one tool! The Riko Trend indicator is good for any trader, suitable for any trader for both forex and binary options. You don’t need to configure anything, everything is perfected by time and experience, it works great during a flat and in a trend. The Riko Trend indicator is a technical analysis tool for financial markets that reflects the current price
Forex traders often observe increased market activity near Supply and Demand zones, which are levels formed based on zones where strong price movements have previously occurred. The Supply Demand Strong Weak Confirm Indicator utilizes fractals and the ATR indicator to identify and plot support and resistance zones on the price chart. These zones are categorized as follows: - Weak: significant high and low points in the trend. - Untested: crucial turning points in the price chart that the pr
Upgraded - Stars added to indentify Areas you can scale in to compound on your entry  when buying or selling version 2.4 Upgraded Notifications and alerts added version 2.3 *The indicator is suitable for all pairs fromm  Deriv pairs (Vix,jump,boom & crash indices) , Currencies, cryptos , stocks(USA100, USA30 ), and metals like gold etc. How does it work? Increasing the period make it more stable hence will only focus on important entry points However  lowering the period will mean the indica
该产品的买家也购买
Atomic Analyst MT5
Issam Kassas
3.64 (11)
首先值得强调的是,该交易指标是非重绘、非延迟的指标,这使其成为手动和机器人交易的理想选择。 Atomic Analyst是一种PA价格行动指标,利用价格的力量和动量来寻找市场上更好的机会。配备了高级过滤器,可帮助去除噪音和假信号,并提高交易潜力。使用多层复杂的指标,Atomic Analyst扫描图表,并将复杂的数学计算转化为任何初学者都能理解并用来做出一致交易决策的简单信号和颜色。 “Atomic Analyst”是专为新手和经验丰富的交易者量身定制的综合交易解决方案。它将高级指标和一流功能融合为一体的交易策略,使其成为所有类型交易者的多功能选择。 日内交易和剥头皮策略:专为快速准确的日内交易和短期交易而设计。 日内和摆动交易策略:可用作追求价格大幅波动的日内和摆动交易者的可靠工具。 多货币和市场:凭借其可靠的精度,在不同的工具和市场上运作。 多个时间框架:可在多个时间框架上使用,性能良好。 稳定性:所有指标均不重绘、不重绘和不滞后,确保可靠的信号。 信号清晰度:提供箭头信号,用于清晰的入场和出场点。 实时警报:通过交易入场、SL和TP警报通知交易者。 多个利润水平:使用
首先,值得强调的是,这个交易系统是一个非重绘、非重画和非滞后的指标,这使得它非常适合手动和机器人交易。 “智能趋势交易系统 MT5”是专为新手和经验丰富的交易者量身定制的综合交易解决方案。它结合了超过 10 个优质指标,具有 7 多个强大的交易策略,使其成为适用于各种市场条件的多功能选择。 趋势跟随策略:提供精确的入场和止损管理,以有效地跟随趋势。 反转策略:识别潜在的趋势反转,使交易者能够利用区域市场的机会。 剃头策略:专为快速准确的日内交易和短期交易而设计。 稳定性:所有指标都不会重绘、不会重画和不会滞后,确保可靠的信号。 定制:支持自定义策略,以满足个人交易偏好。超过 7 种策略和组合可帮助您找到最佳策略。 信号清晰度:提供箭头信号,以指示清晰的入场和退出点。 实时警报:通过交易进出警报使交易者保持了解。 深入分析:提供更高时间框架的趋势分析和实时交易监控。 自适应颜色编码:利用蜡烛颜色编码来显示成交量、趋势和反转蜡烛信号。通过蜡烛颜色分析市场方向。 “智能趋势交易系统 MT5”赋予交易者必要的工具,以便在各种市场条件下做出明智和战略性的交易决策。无论当前市场状态如何,都能够充满
Quantum Trend Sniper
Bogdan Ion Puscasu
5 (37)
介绍   量子趋势狙击指标 ,突破性的 MQL5 指标,正在改变您识别和交易趋势反转的方式!由拥有超过13年交易经验的资深交易员团队开发,     量子趋势狙击指标   旨在通过其创新的方式以极高的准确度识别趋势反转,将您的交易之旅推向新的高度。 ***购买量子趋势狙击指标,即可免费获得量子突破指标!*** 当量子突破指标识别出趋势反转时,它会向您发出警报和信号箭头,并建议您三个止盈水平。 它既适合新手交易者,也适合专业交易者。 量子 EA 通道:       点击这里 MT4版本:       点击这里 建议: 时间范围: 所有时间范围。为了获得最佳结果,我们建议在 M15、M30 和 H1 时间范围内使用它。 货币对:欧元兑美元、英镑兑美元、澳元兑美元、欧元兑英镑、, EURAUD,  XAUUSD 账户类型:ECN、Raw 或 Razor,点差极低 经纪时间:任意 经纪商:IC Markets、Pepperstone with Raw 和 Razor 的点差最低 建议止损:50 点 建议止盈水平:20 点、50 点和
FX Volume MT5
Daniel Stein
4.94 (17)
通过 mql5 和 Telegram 上 的 " 晨间简报 "获取每日市场更新,包括详细信息和屏幕截图 ! 外汇交易量(FX Volume)是第一个也是唯一一个从经纪商角度真正洞察市场情绪的交易量指标。 直接在您的图表上看到这些信息是真正改变游戏规则和突破性的交易解决方案。 受益于独特的市场数据洞察,如 比率(Ratios )显示货币多头和空头头寸的比率(百分比 比率变化 显示所选时间段内的多头比率及其百分比变化 总交易量 显示货币的总交易量(多头和空头),以手为单位 多头 交易量显示货币所有多头头寸的交易量 空头 交易量显示所有货币空头头寸的交易量 净多头 显示净多头交易量,即所有多头头寸减去所有空头头寸(以手为单位)。 净多头百分比 显示货币净多头交易量的变化 请阅读我们的基本教程 -> "如何使用外汇交易量进行交易 " 获取更多信息,如常见问题、交易技巧和教程视频,请访问我们的 外汇交易量公共信息频道 请 安装并运行 SI Connect 以建立与我们数据中心的持续连接 背景信息 我们都知道,外汇是一个分散的市场。这就是为什么我们必须打破常规思维,开发一个独
FX Power MT5 NG
Daniel Stein
5 (4)
通过 mql5 和 Telegram 上 的晨间简报获取每日市场更新,包括详细信息和屏幕截图 ! FX Power MT5 NG 是我们长期以来非常受欢迎的货币强度计算器 FX Power 的下一代产品。 这款下一代强度计算器能提供什么?您所喜爱的原版 FX Power 的所有功能 附加功能 黄金/XAU 强度分析 更精确的计算结果 可单独配置的分析周期 可自定义计算限制,以获得更好的性能 为希望查看更多信息的用户提供特殊的多实例设置 无尽的图形设置,可在每个图表中设置您最喜欢的颜色 无数的通知选项,让您再也不会错过任何重要信息 采用 Windows 11 和 macOS 风格的全新圆角设计 神奇的移动指标面板 FX Power 主要功能 所有主要货币的完整强势历史 所有时间框架内的货币强弱历史 所有经纪商和图表的计算结果完全相同 100% 可靠的实时计算 -> 无重绘 可通过下拉列表选择分析时段 通过自定义模式单独配置分析时段 可在一个图表中使用多个实例 可移动 FX Power 显示屏(通过拖放) 适用于高分辨率 QHD、UHD 和 4K 显示器 自动终端配置 针对平板电脑
首先,值得强调的是,这个交易工具是非重绘、非重画和非滞后的指标,非常适合专业交易。 智能价格行动概念指标是一个非常强大的工具,既适用于新手,也适用于经验丰富的交易者。它将超过20个有用的指标合并到一个指标中,结合了高级交易思想,如内圈交易员分析和智能资金概念交易策略。该指标侧重于智能资金概念,提供有关大型机构交易方式的见解,帮助预测它们的动向。 它在流动性分析方面尤其擅长,有助于理解机构的交易方式。它擅长预测市场趋势,并仔细分析价格波动。通过将您的交易与机构策略对齐,您可以更准确地预测市场走向。该指标多才多艺,擅长分析市场结构,识别重要的订单区块,并识别各种模式。 它擅长识别BOS和CHoCH等模式,理解动量的转变,并突出显示供需强劲的关键区域。它还擅长发现强大的不平衡,并分析价格创造更高高点或更低低点的模式。如果您使用斐波那契回撤工具,该指标可以满足您的需求。它还可以识别相等的高点和低点,分析不同的时间框架,并通过仪表板显示数据。 对于使用更高级策略的交易者,该指标提供了工具,如公平价值差指标和优惠和折扣区域的识别。它特别关注高时间框架订单区块,并在较长时间框架内彻
Advanced Supply Demand MT5
Bernhard Schweigert
4.53 (15)
任何新手或专业交易者的最佳解决方案! 该指标是一款独特、高质量、且价格合理的交易工具,因为我们已经整合了许多专有功能和新公式。 依据此更新,您将能够显示双重时间帧区域。 您不仅可以显示一个较高的时间帧,还可以同时显示图表时间帧,加上更高的时间帧:显示嵌套时区。 供需双方所有交易者都会喜欢它。 :) 重要信息披露 高级供需的最大潜力,请访问 https://www.mql5.com/zh/blogs/post/720245   想象您的交易如何得以改善,是因为您能够精准定位入场或目标位吗? 构建于新的底层算法,它可以更轻松地识别出买卖双方之间的潜在失衡。 这是因为它以图形方式展示供需最强劲区域,及其过去的表现(显示旧区域)。 这些功能旨在帮助您更轻松地发现最佳入场区域和价位。 现在您可以针对您的交易品种和时间帧来优化和编辑区域强度! 高级供需指标适用于所有产品和时间帧。 它是一个新的公式,非常新的功能是两个区域强度函数可由用户输入进行调整! 这在交易中是一大优势。 当您学习如何使用专有功能,例如带有价格游离最小 X 因子的区域强度时,您能够判断该区域强劲与否。 供需区域用作警报触发器
RelicusRoad Pro MT5
Relicus LLC
4.81 (21)
现在$ 147(更新后增加到$ 499) - 无限帐户(PC或Mac) RelicusRoad 用户手册 + 培训视频 + 访问 Private Discord Group + VIP 身份 一种看待市场的新方式 RelicusRoad 是世界上最强大的外汇、期货、加密货币、股票和指数交易指标,为交易者提供保持盈利所需的所有信息和工具。我们提供技术分析和交易计划,帮助每一位交易者取得成功,从初学者到高级。它是一个关键的交易指标,可以提供足够的信息来预测未来的市场。我们相信一个完整的解决方案,而不是图表上几个没有意义的不同指标。这是一个多合一指标,显示无与伦比且非常准确的信号、箭头 + 价格行为信息。 RelicusRoad 基于强大的人工智能,提供缺失的信息和工具来教育您并使您成为交易专家,成为成功的交易者。 几乎所有技术指标都滞后,这意味着它们只能报告已经发生的事情。因此,他们只确认您过去可以看到的价格已经在哪里。我们相信领先指标可以预测未来价格,而无需重新绘制,也不要过度依赖可能改变并导致重新绘制的滞后指标。如果您根据滞后指标进行交易并建立头寸,您就知道您已
XQ Indicator MetaTrader 5
Marzena Maria Szmit
5 (1)
Step into the realm of Forex trading with confidence and precision using XQ, a cutting-edge Forex indicator designed to elevate your trading game to unprecedented heights. Whether you're a seasoned trader or just stepping into the world of currency exchange, XQ Forex Indicator empowers you with the insights and signals needed to make informed trading decisions. The signal conditions are a combination of three indicators, and XQ Forex Indicator only display  medium and long-term trends . The ind
Volume by Price MT5
Brian Collard
5 (3)
The Volume by Price Indicator for MetaTrader 5 features Volume Profile and Market Profile TPO (Time Price Opportunity). Get valuable insights out of currencies, equities and commodities data. Gain an edge trading financial markets. Volume and TPO histogram bar and line charts. Volume Footprint charts. TPO letter and block marker charts including split structures. Versatile segmentation and compositing methods. Static, dynamic and flexible ranges with relative and/or absolute visualizations. Lay
介绍     Quantum Breakout PRO   ,突破性的 MQL5 指标,正在改变您交易突破区域的方式!由拥有超过13年交易经验的资深交易员团队开发,     量子突破 PRO     旨在通过其创新和动态的突破区域策略将您的交易之旅推向新的高度。 量子突破指标将为您提供带有 5 个利润目标区域的突破区域的信号箭头,以及基于突破框的止损建议。 它既适合新手交易者,也适合专业交易者。 量子 EA 通道:       点击这里 重要的!购买后请私信我领取安装手册。 建议: 时间范围:M15 货币对:GBPJPY、EURJPY、USDJPY、NZDUSD、XAUUSD 账户类型:ECN、Raw 或 Razor,点差极低 经纪商时间:GMT +3 经纪商:IC Markets、Pepperstone with Raw 和 Razor 的点差最低 规格: 不重漆! 最多 5 个建议利润目标区域 建议止损水平 可定制的盒子。您可以设置自己的 Box Time Start 和 Box Time End。 接触 如果您有任何疑问或需要帮
Entry Points Pro for MT5
Yury Orlov
4.54 (157)
这款指标用于 MT5,可提供准确的入场交易信号,且无重绘。 它可应用在任何金融资产:外汇、加密货币、贵金属、股票、指数。 它将提供极其精准的评估,并告诉您何时开仓和平仓的最佳时机。 观看 视频 (6:22),其中包含一个仅处理单一信号的示例,该信号即可值回指标购价! 大多数交易者在 Entry Points Pro 指标的帮助下,在第一个交易周内即改善了他们的交易结果。 订阅我们的 Telegram 群 ! Entry Points Pro 指标的益处。 入场信号无重绘 如果信号出现,并得到确认,则它不会再消失;不像是重绘指标,它会导致重大的财产损失,因为它们可以在显示信号后再将其删除。 无差错开仓 指标算法可令您找到入场交易(买入或卖出资产)的理想时机,从而提高每位交易者的成功率。 Entry Points Pro 可操作任何资产 它允许您在 MT5 平台上交易任何经纪商的加密货币、股票、贵金属、指数、大宗商品和货币。 提供任何方向的信号 Entry Points Pro 指标提供针对任意价格走势的入场交易信号 - 上涨、下跌或横盘(横向)。
ICT, SMC, SMART MONEY CONCEPTS, SMART MONEY, Smart Money Concept, Support and Resistance, Trend Analysis, Price Action, Market Structure, Order Blocks, BOS/CHoCH,   Breaker Blocks ,  Momentum Shift,   Supply&Demand Zone/Order Blocks , Strong Imbalance,   HH/LL/HL/LH,    Fair Value Gap, FVG,  Premium  &   Discount   Zones, Fibonacci Retracement, OTE, Buy Side Liquidity, Sell Side Liquidity, BSL/SSL Taken, Equal Highs & Lows, MTF Dashboard, Multiple Time Frame, BigBar, HTF OB, HTF Market Structure
AW Trend Predictor MT5
AW Trading Software Limited
4.76 (54)
一个系统中趋势和故障水平的组合。先进的指标算法过滤市场噪音,确定趋势、进入点以及可能的退出水平。指标信号记录在统计模块中,您可以选择最合适的工具,显示信号历史的有效性。该指标计算获利和止损标记。 手册和说明 ->   这里 / MT4 版本 ->   这里 如何使用指标进行交易: 使用趋势预测器进行交易只需三个简单的步骤: 第 1 步 - 开仓 收到买入信号,成功率超过 70% 第 2 步 - 确定止损 通过相反的信号选择中继线 第 3 步 - 定义止盈策略 策略一:达到 TP1 时平仓 策略 2:达到 TP1 时平仓 50%,达到 TP2 时平仓剩余 50% 策略三:在趋势反转时平仓 好处: 从不重绘结果,信号严格位于蜡烛收盘时 它可以在顾问中使用 获利和止损标记 对交易策略或独立策略的重要补充 市场噪音过滤算法 适用于任何工具 统计模块: 为了更好地选择配对,请使用内置的统计计算。 计算交易 - 给出统计数据的信号总数 成功评级 - 达到 TP1 的信号百分比,或反转那些正获利的信号时的百分比 TakeProfit1 Hit - 达到 TP1 的信号百分比 TakeProfit2
Auto Order Block with break of structure based on ICT and Smart Money Concepts Futures Break of Structure ( BoS )             Order block ( OB )            Higher time frame Order block / Point of Interest ( POI )    shown on current chart           Fair value Gap ( FVG ) / Imbalance   ,  MTF      ( Multi Time Frame )    Volume Imbalance     ,  MTF          vIMB Gap’s Equal High / Low’s     ,  MTF             EQH / EQL Liquidity               Current Day High / Low           HOD /
Blahtech Supply Demand MT5
Blahtech Limited
4.57 (14)
Was: $299  Now: $99   Supply Demand uses previous price action to identify potential imbalances between buyers and sellers. The key is to identify the better odds zones, not just the untouched ones. Blahtech Supply Demand indicator delivers functionality previously unavailable on any trading platform. This 4-in-1 indicator not only highlights the higher probability zones using a multi-criteria strength engine, but also combines it with multi-timeframe trend analysis, previously confirmed swings
ON Trade Gann Squares MT5
Abdullah Alrai
5 (1)
Gann 方块指标是一种强大的市场分析工具,基于 W.D. Gann 在其“市场预测数学公式”一文中介绍的数学概念。该指标融合了与平方数(如 144、90 和 52)有关的 Gann 技术,以及平方 9。此外,它还融入了  关于如何将平方 9 与通道和星形图案结合使用的方法。 用户手册和使用方式: 在使用该指标之前,我们建议您阅读用户手册,并与我们联系以获得任何澄清。您可以在我们的网站上找到完整的用户手册。 该指标提供了 MT5 的完整版本供购买,也提供了 MT4 的免费版本供测试。提供了两个版本的链接供您方便使用。 主要特点和功能: Gann 方块指标为您的交易环境提供了全套工具,使您能够基于几何图案和 Gann 的概念做出明智的决策。以下是主要特点: 平方 9 分析:   该指标可以绘制与平方 9 有关的各种元素,包括水平线、星形图案、网格、Gann 扇形等。这在您的图表上提供了 Gann 的几何概念的视觉表示。 Gann 方块:   该指标绘制了 Gann 方块 52、90 和 144,使您能够可视化和分析它们与价格走势的关系。 自由 Gann 星形图案:   该指标使您能够直接
TrendMaestro5
Stefano Frisetti
note: this indicator is for METATRADER4, if you want the version for METATRADER5 this is the link:  https://www.mql5.com/it/market/product/108106 TRENDMAESTRO recognizes a new TREND in the bud, he never makes mistakes. The certainty of identifying a new TREND is priceless. DESCRIPTION TRENDMAESTRO identifies a new TREND in the bud, this indicator examines the volatility, volumes and momentum to identify the moment in which there is an explosion of one or more of these data and therefore the mome
Owl Smart Levels MT5
Sergey Ermolov
4.47 (36)
MT4版本  |   FAQ Owl Smart Levels Indicator 是一個完整的交易系統,包含 Bill Williams 的高級分形、構建正確的市場波浪結構的 Valable ZigZag 以及標記準確入場水平的斐波那契水平等流行的市場分析工具 進入市場和地方獲利。 策略的详细说明 指示灯使用说明 顾问-贸易猫头鹰助手助理 私人用户聊天 ->购买后写信给我,我会将您添加到私人聊天中,您可以在那里下载所有奖金 力量在於簡單! Owl Smart Levels 交易系統非常易於使用,因此適合專業人士和剛開始研究市場並為自己選擇交易策略的人。 策略和指標中沒有隱藏的秘密公式和計算方法,所有策略指標都是公開的。 Owl Smart Levels 允許您快速查看進入交易的信號,突出顯示下訂單的水平並向您發送有關已出現信號的通知。 優點很明顯: 清楚地顯示主要和更高時間框架的趨勢方向。 指示儀器信號的出現。 標記開單、止損設置和固定利潤的水平。 沒有多餘的,只有必要的結構! ZigZag 表示全球趨勢的方向,因此也表示貿易方向。 市場反轉點的短線清楚地表明在什麼水平上構建斐波
Gartley Hunter Multi
Siarhei Vashchylka
5 (5)
Gartley Hunter Multi - An indicator for searching for harmonic patterns simultaneously on dozens of trading instruments and on all classic timeframes: (m1, m5, m15, m30, H1, H4, D1, Wk, Mn). Manual (Be sure to read before purchasing) | Version for MT4 Advantages 1. Patterns: Gartley, Butterfly, Shark, Crab. Bat, Alternate Bat, Deep Crab, Cypher 2. Simultaneous search for patterns on dozens of trading instruments and on all classic timeframes 3. Search for patterns of all possible sizes. Fr
Black Dragon indicator mt5
Ramil Minniakhmetov
4.82 (56)
趋势检测指标将补充任何策略,也可用作独立工具。   好处 易于使用,不会因不必要的信息而使图表过载; 可用作任何策略的过滤器; 具有内置的动态支撑和阻力水平,可用于获利和设置止损; 指标在烛台关闭后不会改变颜色;  适用于股票市场、指数、石油、黄金和所有时间范围; 具有吐司通知、邮件通知、推送通知和声音提醒功能。 我的其他开发可以在这里找到: https://www.mql5.com/zh/users/mechanic/seller 输入参数 Alert - 开/关。警报; Push Notification - 开/关。推送通知; Mail - 开/关电子邮件通知; Fibo 1,2,3,4,5,6,7,11,21,31,41,51,61,71 - 动态支撑和阻力位的设置。
Golden Spikes Detector
Batsirayi L Marango
5 (1)
Golden Spikes Detector This indicator is based on an advanced strategy primarily for trading spikes on Boom and Crash Indices. Complex algorithms were implemented to detect high probability entries only. It alerts on potential Buy and Sell entries. To trade spikes on the Deriv or Binary broker, only take Buy Boom and Sell Cash alerts. It was optimised to be loaded on 5-minute timeframe although multiple timeframe analysis is done in the background. Features ·             Desktop pop up and sound
Matrix Arrow Indicator MT5
Juvenille Emperor Limited
5 (14)
矩阵箭头指标 MT5   是一种独特的 10 合 1 趋势,遵循   100% 非重绘多时间框架指标 ,可用于所有符号/工具: 外汇 、 商品 、 加密货币 、 指数 、 股票 。 Matrix Arrow Indicator MT5 将在其早期阶段确定当前趋势,从多达 10 个标准指标中收集信息和数据,它们是: 平均定向运动指数 (ADX) 商品渠道指数 (CCI) 经典 Heiken Ashi 蜡烛 移动平均线 移动平均收敛散度 (MACD) 相对活力指数 (RVI) 相对强弱指数 (RSI) 抛物线SAR 随机振荡器 威廉姆斯的百分比范围 当所有指标给出有效的买入或卖出信号时,相应的箭头将打印在图表上,在下一根蜡烛/柱线开盘时,指示强劲的上升趋势/下降趋势。用户可以选择使用哪些指标,并可以单独调整每个指标的参数。 Matrix Arrow Indicator MT5 仅从选定的指标中收集信息,并仅根据其数据打印箭头。   Matrix Arrow Indicator MT5   还可以为所有新信号发送终端、推送通知或电子邮件警报。无论您是黄牛、日内交易者还是波段交易者, Mat
IX Power MT5
Daniel Stein
5 (2)
IX Power 终于将 FX Power 的无与伦比的精确性带到了非外汇交易符号中。 它能准确判断您喜爱的指数、股票、商品、ETF 甚至加密货币的短期、中期和长期趋势强度。 您可以 分析 终端提供的 一切 。试试吧,体验一下您在交易时如何把握 时机 。 IX Power 主要功能 100% 精确的非重绘计算结果 - 适用于您终端中的所有交易符号 下拉式选择预配置以及可单独配置的强度分析周期 通过电子邮件、消息和手机通知的无数种通知选项 可访问的 EA 请求缓冲区 可自定义计算限制,以获得更好的性能 为希望查看更多信息的用户提供特殊的多实例设置 无尽的图形设置,让您在每个图表中都能找到最喜欢的颜色 采用 Windows 11 和 macOS 风格的圆角新面板设计 神奇的移动指标面板,可在子窗口和主图表之间无缝移动 适用于高分辨率 QHD、UHD 和 4K 显示器,并针对平板电脑和触摸屏进行了优化 IX Power 参数 最重要的参数不言自明,但我们很快会在另一篇文章中为您提供所有 IX Power 参数的完整说明。 使用别名 "参数可为技术交易符号
Account Graph MT5
Kyra Nickaline Watson-gordon
5 (1)
An indicator to draw a graph of account current and historical state such as Balance, Equity, Margin, Free Margin, Margin Level, Drawdown, Account Profit, Deposit and Withdrawals. Indicator Inputs : Draw Balance Graph Draw Equity Graph Draw Margin Graph Draw Free Margin Graph Draw Margin Level Graph Draw Drawdown Graph Draw Account Profit Graph Hide Data on Chart and Buffers Connect Gaps by Lines Sign of DDs on Profit Sign of DDs on Loss Tips : The Indicator will draw historical balance gra
Golden Gate Algo MT5
James David Lane
4 (6)
40% 圣诞优惠!价格将于1月1日涨至$250! 推出GoldenGate Entries:前沿交易解决方案! 发现与GoldenGate Entries(GGE)一同进行交易的革命性方法,这是一款设计用于提升您交易体验的先进指标。GGE提供了一套全面的功能,以赋予用户在交易决策中的精准和信心。 交易对:任意(外汇 - 商品 - 股票 - 股票 - 加密货币) 时间框架:15分钟至H1 主要特点: 买入和卖出箭头指示:接收伴随弹出警报的买入和卖出箭头指示,确保您随时保持了解。 GoldenGate_Algo:通过GoldenGate_Algo深入了解市场状况,这是一款强大的工具,用于评估市场是否处于“超卖”或“超买”状态。 当前趋势分析:通过访问您正在查看的时间框架上的当前趋势,保持领先地位,使您能够将交易与市场当前方向对齐。 内置枢轴点:使用内置的枢轴点轻松识别关键市场点,提供有价值的支撑和阻力水平。 蜡烛扫描器:分析蜡烛形态和图案,找到最佳的入场点并过滤掉低概率的入场。 完全定制:通过完整的定制选项,完全掌控您的交易体验,允许您个性化从
Bill Williams Advanced
Siarhei Vashchylka
5 (3)
Bill Williams Advanced is designed for automatic chart analysis using Bill Williams' "Profitunity" system. The indicator analyzes four timeframes at once. Manual (Be sure to read before purchasing) Advantages 1. Automatically analyzes the chart using the "Profitunity" system of Bill Williams. The found signals are placed in a table in the corner of the screen. 2. Equipped with a trend filter based on the Alligator indicator. Most of the system signals are recommended to be used only accordi
TPA True Price Action indicator reveals the true price action of the market makers through 100% non-repainting signals strictly at the close of a candle! TPA shows entries and re-entries, every time the bulls are definitely stronger than the bears and vice versa. Not to confuse with red/green candles. The shift of power gets confirmed at the earliest stage and is ONE exit strategy of several. There are available now two free parts of the TPA User Guide for our customers. The first "The Basics"
TrendDecoder Premium MT5
Christophe, Pa Trouillas
5 (1)
确定范围和下一步可能的走势    |     获得早期信号和趋势强度   |     在反转之前获得明确的退出   |     了解价格将测试哪些斐波水平   |  非重绘、非延迟指标 - 手动和自动交易的理想选择 - 适用于所有资产和所有时间单位 推出时为   69 美元 --然后恢复到 >>   149 美元 购买后,  请联系我的频道  获取推荐设置 MT4 版本: 点击此处 使用 BladeSCALPER 和 PowerZONES 获取我们的完整方法 它是什么? TrendDECODER 集多种创新于一身,使趋势监测变得简单易行。 投射趋势线(Projective TrendLine )--快速参考即将到来的趋势 实时趋势线(RealTime TrendLine) 与投射趋势线(Projective TrendLine)的对比 - 与之前的同方向走势相比,市场是加速还是放缓? 实时趋势线交叉 -   趋势正在偏离轨道 使用 GreyBox -   市场不再是趋势并进入新的过渡序列 使用 DecoderSignals 和 Blue/Orange Clouds
作者的更多信息
Basic Harmonic Pattern MT5
Mehran Sepah Mansoor
4.77 (43)
该指标可识别预测市场反转点的最常用谐波形态。这些谐波形态是外汇市场上不断重复出现的价格形态,暗示着未来可能的价格走势/ 免费 MT4 版本 此外,该指标还内置了市场进入信号以及各种止盈和止损。需要注意的是,虽然谐波形态指标本身可以提供买入/卖出信号,但建议您使用其他技术指标来确认这些信号。例如,在进行买入/卖出之前,您可以考虑使用 RSI 或 MACD 等震荡指标来确认趋势方向和动能强度。 该指标的仪表盘扫描器:( Basic Harmonic Patterns Dashboard ) 包括的谐波形态 加特里 蝶形 蝙蝠型 螃蟹 鲨鱼 赛弗 ABCD 主要输入 Max allowed deviation (%):   该参数是指谐波图形形成时的允许偏差。该参数决定了谐波图样的结构可以变化多少,而指标不会将其视为有效图样。因此,如果设置的百分比越高,则模式识别的灵活性就越大,而如果设置的值越低,则限制性就越大。例如:如果设定值为 30%,那么指标将把当前价格 ±30% 范围内符合形态比例的形态视为有效形态。 Depth:   该参数决定了谐波形态的每个波浪中必须
FREE
Basic Supply Demand MT5
Mehran Sepah Mansoor
4.89 (9)
基本供求指标是 一款功能强大的工具,旨在加强您的市场分析,帮助您在任何图表上识别关键机会区域。这款免费的 Metatrader 指标拥有直观易用的界面,能让您清楚地了解供需区域,从而做出更明智、更准确的交易决策/ 免费 MT4 版本 该指标的仪表盘扫描器: ( Basic Supply Demand Dashboard ) 功能特点 该指标可自动扫描图表中的供需区,无需进行繁琐的手动分析 图形显示距离最近的供应区和需求区的剩余距离 供应区以一种独特的颜色突出显示,而需求区则以另一种颜色显示,便于快速准确地进行解读 该指标会自动计算最近的供应区或需求区与图表上当前价格之间的距离(以点为单位),为您提供清晰、可量化的参考。以点数为单位的距离会清晰地显示在图表上,让您可以快速识别与当前价格有较大或较小距离的区域 在接近或突破供需区时发出警报 适用于任何时间框架 可选择深色或浅色主题,自定义图表显示效果 如何使用 建议使用   M1   和   M5   时间框架。观看下面的视频,了解其工作原理。
FREE
Comprehensive Moving Average MT5
Mehran Sepah Mansoor
5 (3)
综合移动平均线 [CMA] 指标,包括所有类型的移动平均线。 MT4版本 类型 SMA ------------------- (简单) EMA ------------------- (指数) SMMA [RMA] --------(平滑) WMA ------------------(线性加权) DEMA ------------------ (双 EMA) TEMA ------------------ (三重 EMA) VWMA -----------------(体积加权) HMA ------------------ (船体) LSMA ------------------(最小二乘法) ALMA [高斯] ---- (阿诺·勒古) 特征 能够激活具有不同设置的两个 MA。 能够自定义图形设置。 能够突出显示 MA 之间的区域。 能够根据交叉 MA 或与 MA 的交叉价格更改蜡烛的颜色。 在出现交叉 MA 或交叉价格与 MA 的情况下发送警报。
FREE
Basic Harmonic Pattern
Mehran Sepah Mansoor
4.58 (50)
该指标可识别预测市场反转点的最常用谐波形态。这些谐波形态是外汇市场上不断重复出现的价格形态,暗示着未来可能的价格走势/ 免费 MT5 版本 此外,该指标还内置了市场进入信号以及各种止盈和止损。需要注意的是,虽然谐波形态指标本身可以提供买入/卖出信号,但建议您使用其他技术指标来确认这些信号。例如,在进行买入/卖出之前,您可以考虑使用 RSI 或 MACD 等震荡指标来确认趋势方向和动能强度。 该指标的仪表盘扫描器:( Basic Harmonic Patterns Dashboard ) 包括的谐波形态 加特里 蝶形 蝙蝠型 螃蟹 鲨鱼 赛弗 ABCD 主要输入 Max allowed deviation (%): 该参数是指谐波图形形成时的允许偏差。该参数决定了谐波图样的结构可以变化多少,而指标不会将其视为有效图样。因此,如果设置的百分比越高,则模式识别的灵活性就越大,而如果设置的值越低,则限制性就越大。例如:如果设定值为 30%,那么指标将把当前价格 ±30% 范围内符合形态比例的形态视为有效形态。 Depth: 该参数决定了谐波形态的每个波浪中必须出现的最
FREE
Basic Renko MT5
Mehran Sepah Mansoor
基本砖形指标在主图表上显示砖形框。 MT4版本 它的优点是您可以同时访问主图表和砖形图。 此外,您还可以了解形成每个砖形箱需要多少个砖块。 当发生逆转时,指标将通过弹出、推送和电子邮件警报通知您。 该指标没有复杂的设置,初学者和专业人士都可以轻松地在策略中使用它。 输入 Box Size :盒子的大小基于点 Upward Box Color :看涨盒子颜色 Downward Box Color :看跌框颜色 Box Opacity :不透明度量(0 到 100 之间的数字)透明度随着不透明度的减小而增加 Text Color :计算每个框中条形数量的数字的颜色 Font Size :数字文字大小 Max Bars :指标将执行计算的最大柱数[零表示所有可用柱] Pop-up alert :发生反转时向MT5终端发出提醒 Push Notification :发生逆转时向手机发出警报 Email :发生撤销时发送电子邮件
FREE
Basic Candlestick Patterns MT5
Mehran Sepah Mansoor
5 (1)
The   Basic Candlestick Patterns   is an excellent indicator for identifying candlestick patterns, which displays your chosen patterns on the chart and helps you make trade decisions. You can download  MT4 version The indicator has simple settings for coloring and alerts. You can also activate or deactivate the desired patterns using the panel on the chart.
FREE
Basic Renko MT4
Mehran Sepah Mansoor
基本砖形指标在主图表上显示砖形框。 MT5版本 它的优点是您可以同时访问主图表和砖形图。 此外,您还可以了解形成每个砖形箱需要多少个砖块。 当发生逆转时,指标将通过弹出、推送和电子邮件警报通知您。 该指标没有复杂的设置,初学者和专业人士都可以轻松地在策略中使用它。 输入 Box Size :盒子的大小基于点 Upward Box Color :看涨盒子颜色 Downward Box Color :看跌框颜色 Box Opacity :不透明度量(0 到 100 之间的数字)透明度随着不透明度的减小而增加 Text Color :计算每个框中条形数量的数字的颜色 Font Size :数字文字大小 Max Bars :指标将执行计算的最大柱数[零表示所有可用柱] Pop-up alert :发生反转时向MT4终端发出提醒 Push Notification :发生逆转时向手机发出警报 Email :发生撤销时发送电子邮件
FREE
Basic Supply Demand
Mehran Sepah Mansoor
基本供求指标是 一款功能强大的工具,旨在加强您的市场分析,帮助您在任何图表上识别关键机会区域。这款免费的 Metatrader 指标拥有直观易用的界面,能让您清楚地了解供需区域,从而做出更明智、更准确的交易决策/ 免费 MT5 版本 该指标的仪表盘扫描器: ( Basic Supply Demand Dashboard ) 功能特点 该指标可自动扫描图表中的供需区,无需进行繁琐的手动分析 图形显示距离最近的供应区和需求区的剩余距离 供应区以一种独特的颜色突出显示,而需求区则以另一种颜色显示,便于快速准确地进行解读 该指标会自动计算最近的供应区或需求区与图表上当前价格之间的距离(以点为单位),为您提供清晰、可量化的参考。以点数为单位的距离会清晰地显示在图表上,让您可以快速识别与当前价格有较大或较小距离的区域 在接近或突破供需区时发出警报 适用于任何时间框架 可选择深色或浅色主题,自定义图表显示效果 如何使用 建议使用 M1 和 M5 时间框架。观看下面的视频,了解其工作原理。
FREE
综合移动平均线 [CMA] 指标,包括所有类型的移动平均线。 MT5版本 类型 SMA ------------------- (简单) EMA ------------------- (指数) SMMA [RMA] --------(平滑) WMA ------------------(线性加权) DEMA ------------------ (双 EMA) TEMA ------------------ (三重 EMA) VWMA -----------------(体积加权) HMA ------------------ (船体) LSMA ------------------(最小二乘法) ALMA [高斯] ---- ( Arnaud Legoux ) 特征 能够激活具有不同设置的两个 MA。 能够自定义图形设置。 能够根据交叉 MA 或与 MA 的交叉价格更改蜡烛的颜色。 在出现交叉 MA 或交叉价格与 MA 的情况下发送警报。
FREE
Basic Candlestick Patterns
Mehran Sepah Mansoor
5 (2)
The Basic Candlestick Patterns is an excellent indicator for identifying candlestick patterns, which displays your chosen patterns on the chart and helps you make trade decisions. You can download  MT5 version The indicator has simple settings for coloring and alerts. You can also activate or deactivate the desired patterns using the panel on the chart.
FREE
该仪表盘显示所选符号的最新可用谐波形态,因此您可以节省时间并提高效率 /  MT5 版本 。 免费指标:  Basic Harmonic Pattern 指标列 Symbol: 显示所选符号 Trend:   看涨或看跌 Pattern:  形态类型(Gartley、蝴蝶、蝙蝠、螃蟹、鲨鱼、Cypher 或 ABCD) Entry:   入口价格 SL: 止损价 TP1: 第一止盈价 TP2: 第二次获利价格 TP3: 第三次获利价格 Current price:  当前价格 Age (in bars): 最后绘制的模式的年龄 主要输入 Symbols : 从 "28 种主要货币对 "或 "选定符号 "中选择。 Selected Symbols : 希望监控的符号,用逗号分隔("EURUSD,GBPUSD,XAUUSD")。如果您的经纪商为货币对设置了后缀或前缀,您必须在以下两个参数中添加(货币对前缀或货币对后缀)。 Max Iteration: 调整模式的最大迭代次数(如果该值越小,则模式越少,性能越快;如果该值越大,则模式越多,性能越慢)。事实上,它的工作原理如下:如
该仪表盘可根据您对所选符号的交易策略,以剥头皮和长期模式在图表上发现并显示供需区。此外,仪表盘的扫描模式可帮助您一目了然地检查所有需要的符号,不错过任何合适的仓位/ MT4 版本 免费指标: Basic Supply Demand 功能 允许您查看多个货币对的交易机会,为您提供所有货币对的清晰简明视图,并根据其与供需区的接近程度进行排序 可定制设置,从颜色到检测参数,满足您的特定需求 主要输入 Indicator mode : 选择指标模式或具有新功能的面板模式 Symbols : 从 "28 种主要货币对 "或 "选定符号 "中进行选择 Selected Symbols : 您希望监控的符号,用逗号分隔("EURUSD,GBPUSD,XAUUSD")。如果您的经纪商对货币对有后缀或前缀,您必须在以下两个参数中添加(货币对前缀或货币对后缀) Trading Style : 选择剥头皮或长期模式 Allowed Deviation : 该参数允许修改需求或供应区域的精确度(数值越小,精确度越高) Zone   thickness : 通过该参数可以修改需求和供应
Basic Theme Builder MT5
Mehran Sepah Mansoor
使用我们创新的 Metatrader 主题生成器,让您的交易图表栩栩如生! 我们的 "主题生成器 "允许您创建适合您个人风格和偏好的交易环境。界面简单易用,完全集成到 Metatrader 中,您现在可以完全控制图表的外观和感觉/ 免费 MT4 版本 。 功能特点 完全自定义:   轻松修改蜡烛图颜色和图表背景,以反映您独特的交易风格。从柔和、专业的色调到鲜艳、大胆的色彩,可能性是无限的。 无限创意:   尝试不同的颜色组合和风格,找到适合自己个性和交易偏好的完美外观--尽情发挥想象力,创建真正独一无二的图表! 易于使用:   我们的工具设计直观、易于使用,即使是初学者也能轻松上手。只需点击几下,您就可以完全自定义图表,让它们焕然一新。 增强交易体验:   具有视觉吸引力的交易环境不仅让人赏心悦目,还能提高您在金融市场交易时的注意力和专注度。 如何使用 超级简单,只需观看下面的视频。
FREE
Market Overview MT4
Mehran Sepah Mansoor
5 (1)
!Do Not Trade against the Trend anymore! With this tool, you can identify the trend very easily and ride the market trend along with other traders and make a profit. MT5 version is available. This is a great dashboard that gives you a very good view of the market and helps you identify and use good opportunities very easily. In one view, it shows all   28 main currency pairs   of the market in terms of   Popularity   with other traders, the   Strength   of the upward or downward trend, and th
Basic Theme Builder
Mehran Sepah Mansoor
使用我们创新的 Metatrader 主题生成器,让您的交易图表栩栩如生! 我们的 "主题生成器 "允许您创建适合您个人风格和偏好的交易环境。界面简单易用,完全集成到 Metatrader 中,您现在可以完全控制图表的外观和感觉/ 免费 MT5 版本 。 功能特点 完全自定义: 轻松修改蜡烛图颜色和图表背景,以反映您独特的交易风格。从柔和、专业的色调到鲜艳、大胆的色彩,可能性是无限的。 无限创意: 尝试不同的颜色组合和风格,找到适合自己个性和交易偏好的完美外观--尽情发挥想象力,创建真正独一无二的图表! 易于使用: 我们的工具设计直观、易于使用,即使是初学者也能轻松上手。只需点击几下,您就可以完全自定义图表,让它们焕然一新。 增强交易体验: 具有视觉吸引力的交易环境不仅让人赏心悦目,还能提高您在金融市场交易时的注意力和专注度。 如何使用 超级简单,只需观看下面的视频。
FREE
The  Basic Candlestick Patterns  is a Multi-Symbol and Multi-Timeframe scanner for identifying candlestick patterns. it displays your chosen patterns on the chart and helps you make trade decisions. The indicator has simple settings for coloring and alerts. You can also activate or deactivate the desired patterns, symbols and timeframes. Bullish Patterns Hammer Inverse hammer Bullish engulfing Morning star Three white soldiers Bearish Patterns Hanging man Shooting star Bearish engulfing Ev
该仪表盘可根据您对所选符号的交易策略,以剥头皮和长期模式在图表上发现并显示供需区。此外,仪表盘的扫描模式可帮助您一目了然地检查所有需要的符号,不错过任何合适的仓位/ MT5 版本 免费指标: Basic Supply Demand 功能 允许您查看多个货币对的交易机会,为您提供所有货币对的清晰简明视图,并根据其与供需区的接近程度进行排序 可定制设置,从颜色到检测参数,满足您的特定需求 主要输入 Indicator mode : 选择指标模式或具有新功能的面板模式 Symbols : 从 "28 种主要货币对 "或 "选定符号 "中进行选择 Selected Symbols : 您希望监控的符号,用逗号分隔("EURUSD,GBPUSD,XAUUSD")。如果您的经纪商对货币对有后缀或前缀,您必须在以下两个参数中添加(货币对前缀或货币对后缀) Trading Style : 选择剥头皮或长期模式 Allowed Deviation : 该参数允许修改需求或供应区域的精确度(数值越小,精确度越高) Zone   thickness : 通过该参数可以修改需求和供应
The  Basic Candlestick Patterns  is a Multi-Symbol and Multi-Timeframe scanner for identifying candlestick patterns. it displays your chosen patterns on the chart and helps you make trade decisions. The indicator has simple settings for coloring and alerts. You can also activate or deactivate the desired patterns, symbols and timeframes. Bullish Patterns Hammer Inverse hammer Bullish engulfing Morning star Three white soldiers Bearish Patterns Hanging man Shooting star Bearish engulfing Eve
Basic Volume Profile
Mehran Sepah Mansoor
使用我们的 Metatrader 交易量曲线指标,探索交易量分析的威力!  / MT5 版本 基本成交量曲线是专为希望优化交易的手动交易者设计的指标。对于任何希望更好地了解市场行为的严肃交易者而言,成交量曲线指标都是必不可少的工具。利用我们的创新解决方案,您可以清晰、简明地直观了解交易量在不同价格间的分布情况。这样,您就可以确定关键的关注区域,如支撑位和阻力位、累积区和分布区以及重要的控制点。与显示特定日期交易量的普通交易量指标不同,Basic Volume Profile 显示的是特定价格的交易量。 我们的指标具有直观和可定制的界面,让您可以根据自己的交易偏好进行调整。 特点 在价格图表上清晰显示成交量概况。 快速识别高低成交量活动区域。 完全自定义颜色和样式,以适应您的交易风格。 支持多时段综合分析。 专门的技术支持,确保体验顺畅。 配置参数 指标设置 Number of histograms: 要显示的成交量条数 Profile position:   是否希望在第一根蜡烛或侧面显示成交量曲线 Color mode:   是否希望将成交量曲线分为看涨/看跌两种模
Market Overview MT5
Mehran Sepah Mansoor
!Do Not Trade against the Trend anymore! With this tool, you can identify the trend very easily and ride the market trend along with other traders and make a profit. MT4 version   is available. This is a great dashboard that gives you a very good view of the market and helps you identify and use good opportunities very easily. In one view, it shows all 28 main currency pairs of the market in terms of Popularity with other traders, the Strength of the upward or downward trend, and the Buyers/Se
Basic Volume Profile MT5
Mehran Sepah Mansoor
使用我们的 Metatrader 交易量曲线指标,探索交易量分析的威力!  /   MT4 版本 基本成交量曲线是专为希望优化交易的手动交易者设计的指标。对于任何希望更好地了解市场行为的严肃交易者而言,成交量曲线指标都是必不可少的工具。利用我们的创新解决方案,您可以清晰、简明地直观了解交易量在不同价格间的分布情况。这样,您就可以确定关键的关注区域,如支撑位和阻力位、累积区和分布区以及重要的控制点。与显示特定日期交易量的普通交易量指标不同,Basic Volume Profile 显示的是特定价格的交易量。 我们的指标具有直观和可定制的界面,让您可以根据自己的交易偏好进行调整。 特点 在价格图表上清晰显示成交量概况。 快速识别高低成交量活动区域。 完全自定义颜色和样式,以适应您的交易风格。 支持多时段综合分析。 专门的技术支持,确保体验顺畅。 配置参数 指标设置 Number of histograms:   要显示的成交量条数 Profile position:     是否希望在第一根蜡烛或侧面显示成交量曲线 Color mode:     是否希望将成交量曲线分为
筛选:
Kenneth Wallace
183
Kenneth Wallace 2023.03.04 00:49 
 

GREAT product. was able to make profits same day as purchase. very verse indicator with lots of GOODIES. support system is also 10 out of 10.

回复评论
版本 2.0 2024.04.20
- New harmonic patterns like (shark, whale, etc.) were added
- New logo
- Fixed reported bugs
版本 1.70 2024.02.23
- Performance improvement
- Additional info on the dashboard
版本 1.62 2023.11.04
-Better Performance
-Fixed some bugs
版本 1.61 2023.04.15
- New input added. It helps to force download required bars.
版本 1.60 2023.04.14
- New input "Selected Symbols (Continued)" added for additional Symbols.
版本 1.50 2022.03.17
-Pairs Prefix/Suffix added
版本 1.40 2022.03.15
- Additional graphical settings added
版本 1.21 2022.02.25
- New Resource added.