
很遗憾,"Martingale Organizer Demo"不可用
您可以检查Mehran Sepah Mansoor的其他产品:

This indicator discovers and displays the Supply and Demand zones on the chart. MT4 Version Identifying supply and demand zones is very important in any kind of trading strategy. If you can use these zones well, you will definitely get good success in trading. Some features of this indicator Graphic display of the remaining distance to the nearest supply and demand zones Alerts of approaching or breaking supply and demand zones Dark and light themes Recommended Timeframes : M1 and M5
FREE

该指标可识别预测市场反转点的最常用谐波形态。这些谐波形态是外汇市场上不断重复出现的价格形态,暗示着未来可能的价格走势/ 免费 MT4 版本
此外,该指标还内置了市场进入信号以及各种止盈和止损。需要注意的是,虽然谐波形态指标本身可以提供买入/卖出信号,但建议您使用其他技术指标来确认这些信号。例如,在进行买入/卖出之前,您可以考虑使用 RSI 或 MACD 等震荡指标来确认趋势方向和动能强度。
该指标的仪表盘扫描器:( 基本谐波形态仪表盘 )
包括的谐波形态 加特里 蝶形 蝙蝠型 螃蟹 鲨鱼 赛弗 ABCD
主要输入 最大允许偏差 (%): 该参数是指谐波图形形成时的允许偏差。该参数决定了谐波图样的结构可以变化多少,而指标不会将其视为有效图样。因此,如果设置的百分比越高,则模式识别的灵活性就越大,而如果设置的值越低,则限制性就越大。例如:如果设定值为 30%,那么指标将把当前价格 ±30% 范围内符合形态比例的形态视为有效形态。 深度: 该参数决定了谐波形态的每个波浪中必须出现的最少条数,也就是说,向上或向下运动必须出现多少条,指标才会将其视为一个波浪。数值越大,
FREE
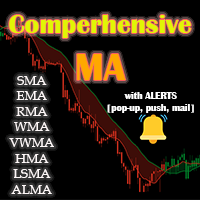
A Comprehensive Moving Average [ CMA ] indicator that includes all types of moving averages. MT4 Version Types
SMA ------------------- (Simple) EMA ------------------- (Exponential) SMMA [RMA] -------- (Smoothed) WMA ------------------ (Linear Weighted) DEMA ------------------ (Double EMA) TEMA ------------------ (Triple EMA) VWMA ----------------- (Volume Weighted) HMA ------------------ (Hull) LSMA ------------------ (Least Square) ALMA [Gaussian] ---- (Arnaud Legoux)
Feature
Ability
FREE

The Basic Candlestick Patterns is an excellent indicator for identifying candlestick patterns, which displays your chosen patterns on the chart and helps you make trade decisions. You can download MT4 version The indicator has simple settings for coloring and alerts. You can also activate or deactivate the desired patterns using the panel on the chart.
FREE

该指标可识别预测市场反转点的最常用谐波形态。这些谐波形态是外汇市场上不断重复出现的价格形态,暗示着未来可能的价格走势/ 免费 MT5 版本
此外,该指标还内置了市场进入信号以及各种止盈和止损。需要注意的是,虽然谐波形态指标本身可以提供买入/卖出信号,但建议您使用其他技术指标来确认这些信号。例如,在进行买入/卖出之前,您可以考虑使用 RSI 或 MACD 等震荡指标来确认趋势方向和动能强度。
该指标的仪表盘扫描器:( 基本谐波形态仪表盘 )
包括的谐波形态 加特里 蝶形 蝙蝠型 螃蟹 鲨鱼 赛弗 ABCD
主要输入 最大允许偏差 (%): 该参数是指谐波图形形成时的允许偏差。该参数决定了谐波图样的结构可以变化多少,而指标不会将其视为有效图样。因此,如果设置的百分比越高,则模式识别的灵活性就越大,而如果设置的值越低,则限制性就越大。例如:如果设定值为 30%,那么指标将把当前价格 ±30% 范围内符合形态比例的形态视为有效形态。 深度: 该参数决定了谐波形态的每个波浪中必须出现的最少条数,也就是说,向上或向下运动必须出现多少条,指标才会将其视为一个波浪。数值越大,
FREE
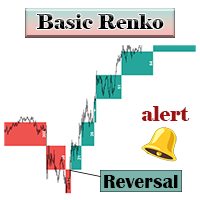
The Basic Renko indicator shows the Renko boxes on the main chart. MT4 Version Its advantage is that you have access to both the main chart and the Renko chart at the same time. In addition, you can find out how many bars it took to form each Renko box. When a reversal occurs, the indicator will notify you with pop-up, push and email alerts. This indicator does not have complicated settings, and beginners and professionals can easily use it in their strategies. Through the inputs, y ou can
FREE
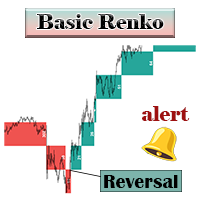
The Basic Renko indicator shows the Renko boxes on the main chart. MT5 Version Its advantage is that you have access to both the main chart and the Renko chart at the same time. In addition, you can find out how many bars it took to form each Renko box. When a reversal occurs, the indicator will notify you with pop-up, push and email alerts. This indicator does not have complicated settings, and beginners and professionals can easily use it in their strategies. Through the inputs, y ou can spec
FREE

This indicator discovers and displays the Supply and Demand zones on the chart. MT5 Version Identifying supply and demand zones is very important in any kind of trading strategy. If you can use these zones well, you will definitely get good success in trading. Some features of this indicator Graphic display of the remaining distance to the nearest supply and demand zones Alerts of approaching or breaking supply and demand zones Dark and light themes Recommended Tim
FREE

The Basic Candlestick Patterns is an excellent indicator for identifying candlestick patterns, which displays your chosen patterns on the chart and helps you make trade decisions. You can download MT5 version The indicator has simple settings for coloring and alerts. You can also activate or deactivate the desired patterns using the panel on the chart.
FREE
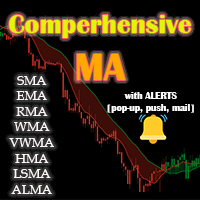
A Comprehensive Moving Average [ CMA ] indicator that includes all types of moving averages. MT5 Version Types
SMA ------------------- (Simple) EMA ------------------- (Exponential) SMMA [RMA] -------- (Smoothed) WMA ------------------ (Linear Weighted) DEMA ------------------ (Double EMA) TEMA ------------------ (Triple EMA) VWMA ----------------- (Volume Weighted) HMA ------------------ (Hull) LSMA ------------------ (Least Square) ALMA [Gaussian] ---- (Arnaud Legoux)
Feature
Abili
FREE

!Do Not Trade against the Trend anymore!
With this tool, you can identify the trend very easily and ride the market trend along with other traders and make a profit. MT5 version is available. This is a great dashboard that gives you a very good view of the market and helps you identify and use good opportunities very easily. In one view, it shows all 28 main currency pairs of the market in terms of Popularity with other traders, the Strength of the upward or downward trend, and th
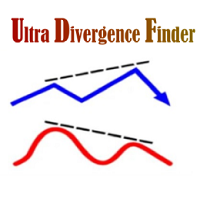
Divergence is when the price of is moving in the opposite direction of a technical indicator. Divergence warns that the current price trend may be weakening, and in some cases may lead to the price changing direction. This indicator shows all types of divergence for the selected indicator. You can also use your custom indicator to find divergence. Include
Regular Bullish Regula Bearish Hidden Bullish Hidden Bearish Indicators CCI DeMarker ForceIndex MACD Momentum OsMA RSI RVI Stochastic Custom
FREE

This dashboard shows the latest available Harmonic Patterns for selected symbols. Free Indicator : Basic Harmonic Pattern MT4 Version Columns Symbol Trend (Bullish/ Bearish) Pattern Type (Gartley/ Butterfly/ Bat/ Crab) Entry (Entry Price) SL (Stop Loss Price) TP1 (1st Take Profit Price) TP2 (2nd Take Profit Price) TP3 (3rd Take Profit Price) Current (Current Price) Age (Age of pattern in Bars) Alert Settings (Set an alert if a new pattern is found)
You can sort the dashboa

This dashboard shows the latest available Harmonic Patterns for selected symbols. Free Indicator : Basic Harmonic Pattern MT5 Version Columns Symbol Trend (Bullish/ Bearish) Pattern Type (Gartley/ Butterfly/ Bat/ Crab) Entry (Entry Price) SL (Stop Loss Price) TP1 (1st Take Profit Price) TP2 (2nd Take Profit Price) TP3 (3rd Take Profit Price) Current (Current Price) Age (Age of pattern in Bars) Alert Settings (Set an alert if a new pattern is found)
You can sort the dashboard by the column
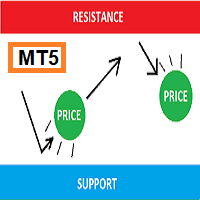
This indicator can find important market points and help you draw S tatic and D ynamic Support and R esistance . This is MT5 version if you need MT4 version click here . It's also draw some Fibonacci levels for more convenience. With the help of the levels that it introduces to you, you can guess the return points of the market, or if it break levels (B reakout ), you can take advantage of the strong movement of the market. All Timeframes and All Currency, CFD, Metal, etc. Main Inputs Mo
FREE

The Basic Candlestick Patterns is a Multi-Symbol and Multi-Timeframe scanner for identifying candlestick patterns. it displays your chosen patterns on the chart and helps you make trade decisions. The indicator has simple settings for coloring and alerts. You can also activate or deactivate the desired patterns, symbols and timeframes.
Bullish Patterns
Hammer Inverse hammer Bullish engulfing Morning star Three white soldiers
Bearish Patterns
Hanging man Shooting star Bearish engulfing Ev

This indicator discovers and displays the Supply and Demand zones on the chart. MT4 Version This indicator finds and displays supply and demand zones in both scalping and long-term modes based on your trading strategy. Also, the dashboard scanner mode helps you to check all the desired symbols at a glance and not to miss any suitable position. Some features of this indicator Two modes: Current and Dashboard [input: Indicator Mode] Trading Style: Scalping / Long-Term [input: Trading Style] A
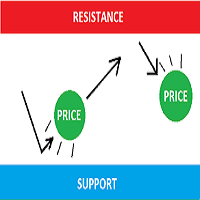
This indicator can find important market points and help you draw S tatic and D ynamic Support and R esistance . This is MT4 version if you need MT5 version click here . It's also draw some Fibonacci levels for more convenience. With the help of the levels that it introduces to you, you can guess the return points of the market, or if it break levels (B reakout ), you can take advantage of the strong movement of the market. All Timeframes and All Currency, CFD, Metal, etc. Main Inputs
FREE
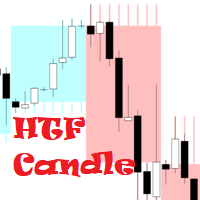
This indicator shows Higher Time Frame ( HTF ) Candles on the current chart. It will help you to identify Higher Time Frame ( HTF ) candles price ( Open price/ High price / Low price / Close price ). The colors of the Bull/Bear HTF candles are selectable. You can also change the Transparency of the HTF candles to make them more beautiful. Inputs
Higher Time Frame (HTF) Shift Bull Candle Color Bear Candle Color Transparency Max Bars
FREE

!Do Not Trade against the Trend anymore! With this tool, you can identify the trend very easily and ride the market trend along with other traders and make a profit. MT4 version is available.
This is a great dashboard that gives you a very good view of the market and helps you identify and use good opportunities very easily. In one view, it shows all 28 main currency pairs of the market in terms of Popularity with other traders, the Strength of the upward or downward trend, and the Buyers/Se

This indicator discovers and displays the Supply and Demand zones on the chart. MT5 Version This indicator finds and displays supply and demand zones in both scalping and long-term modes based on your trading strategy. Also, the dashboard scanner mode helps you to check all the desired symbols at a glance and not to miss any suitable position. Some features of this indicator Two modes: Current and Dashboard [input: Indicator Mode] Trading Style: Scalping / Long-Term [i

This is an auxiliary tool for managing open trades (manually or by other experts) and adding Martingale Grid trades if the conditions are right. In other words, with the help of this tool, you can add a Martingale System to any other expert with any strategy. We all know that Martingale method, despite its good advantage, has a disadvantage and that is huge Draw Down (DD). To control this, a DD Reduction Algorithm has been developed in the system to help you.
Inputs
General Settings Show Pan

The Basic Candlestick Patterns is a Multi-Symbol and Multi-Timeframe scanner for identifying candlestick patterns. it displays your chosen patterns on the chart and helps you make trade decisions. The indicator has simple settings for coloring and alerts. You can also activate or deactivate the desired patterns, symbols and timeframes.
Bullish Patterns
Hammer Inverse hammer Bullish engulfing Morning star Three white soldiers
Bearish Patterns Hanging man Shooting star Bearish engulfing Eve

使用我们的 Metatrader 交易量曲线指标,探索交易量分析的威力! / MT5 版本
基本成交量曲线是专为希望优化交易的手动交易者设计的指标。对于任何希望更好地了解市场行为的严肃交易者而言,成交量曲线指标都是必不可少的工具。利用我们的创新解决方案,您可以清晰、简明地直观了解交易量在不同价格间的分布情况。这样,您就可以确定关键的关注区域,如支撑位和阻力位、累积区和分布区以及重要的控制点。与显示特定日期交易量的普通交易量指标不同,Basic Volume Profile 显示的是特定价格的交易量。
我们的指标具有直观和可定制的界面,让您可以根据自己的交易偏好进行调整。
特点 在价格图表上清晰显示成交量概况。 快速识别高低成交量活动区域。 完全自定义颜色和样式,以适应您的交易风格。 支持多时段综合分析。 专门的技术支持,确保体验顺畅。
配置参数 ===== 指标设置 =====
柱状图数量: 要显示的成交量条数
剖面位置: 是否希望在第一根蜡烛或侧面显示成交量曲线
颜色模式: 是否希望将成交量曲线分为看涨/看跌两种模式
===== 指标颜色设置 ==

使用我们的 Metatrader 交易量曲线指标,探索交易量分析的威力! / MT4 版本
基本成交量曲线是专为希望优化交易的手动交易者设计的指标。对于任何希望更好地了解市场行为的严肃交易者而言,成交量曲线指标都是必不可少的工具。利用我们的创新解决方案,您可以清晰、简明地直观了解交易量在不同价格间的分布情况。这样,您就可以确定关键的关注区域,如支撑位和阻力位、累积区和分布区以及重要的控制点。与显示特定日期交易量的普通交易量指标不同,Basic Volume Profile 显示的是特定价格的交易量。
我们的指标具有直观和可定制的界面,让您可以根据自己的交易偏好进行调整。
特点 在价格图表上清晰显示成交量概况。 快速识别高低成交量活动区域。 完全自定义颜色和样式,以适应您的交易风格。 支持多时段综合分析。 专门的技术支持,确保体验顺畅。
配置参数 ===== 指标设置 =====
柱状图数量: 要显示的成交量条数
剖面位置: 是否希望在第一根蜡烛或侧面显示成交量曲线
颜色模式: 是否希望将成交量曲线分为看涨/看跌两种模式
===== 指标颜色设置