Range Exhaustion MT5
- 指标
- Robert Gerald Wood
- 版本: 1.0
- 激活: 10
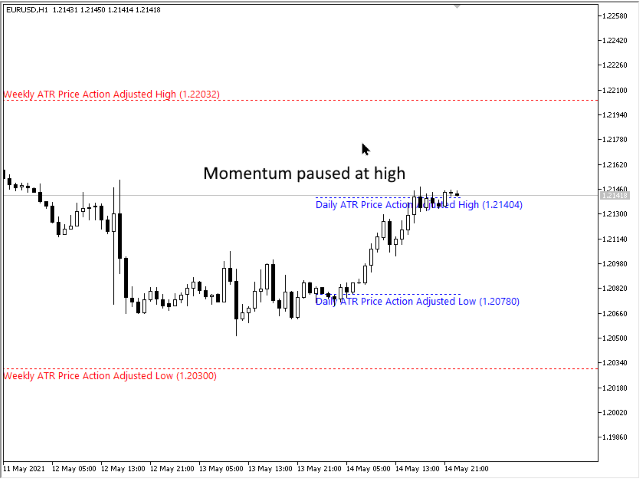
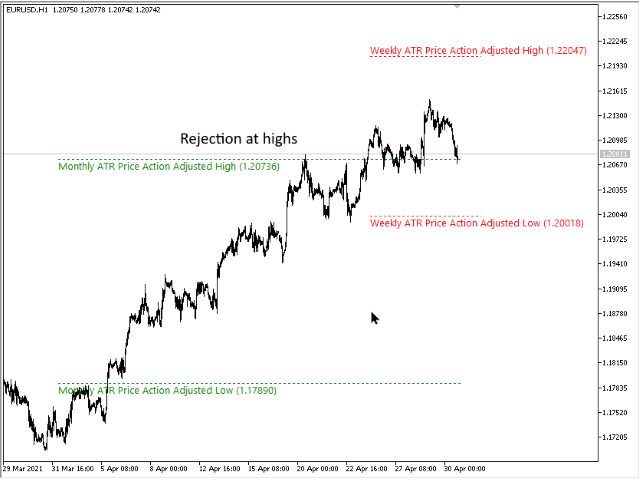
当价格达到或超过当前期间的预期范围时,范围耗尽就会发生。在这些水平上,价格开始失去相对于该时期早些时候的动力,因此最好确保您没有建立新头寸。
该指标将向您显示图表上可能发生这种情况的位置,显示每日、每周和每月的水平。
当您看到价格超过这些耗尽水平时,它告诉您移动背后的势头非常强劲,并且可能会走向更高的时间框架水平。
该指标可以使用平均真实范围 (ATR) 或平均范围 (ADR) 计算,具体取决于您的偏好。默认情况下,我们使用 ATR,因为我们发现它在外汇图表上效果更好,但 ADR 在基于股票的指数和符号上确实具有优势。
该指标有多种绘图模式,如下所述,您可以根据自己的需要对其进行定制。
设置
计算模式
选择 AverageTrueRange (ATR) 或 AverageDailyRange (ADR) 来计算水平。
绘图模式
该指标可以以不同的方式显示。
- 绘制价格调整线 - 水平根据达到的高点和低点在整个时期内进行调整。这是默认且最常用的方法。
- 绘制预期最大值 - 水平是一个固定值,是最后一个收盘价加上或减去 ATR 或 ADR 值。
- 绘制两条线 - 显示以上两行。
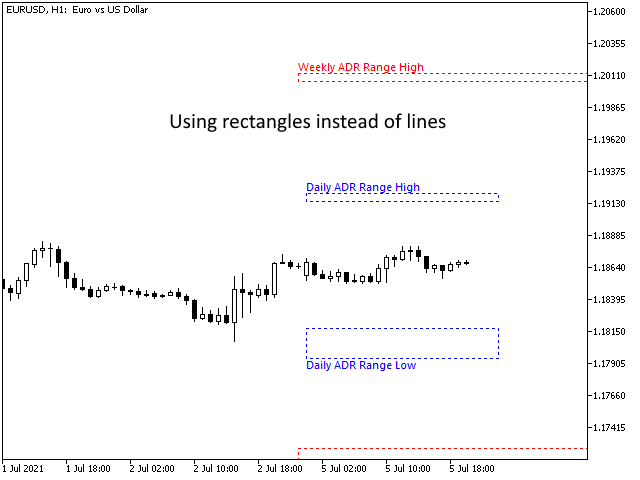
- 绘制矩形 - 显示单个矩形,其中顶线和底线是价格调整和预期最大/最小值
审核期
计算 ATR/ADR 值时使用的周期。
显示每日限额
当为真时,绘制每日耗尽水平。
显示每周限额
当为真时,绘制每周耗尽水平。
显示每月限额
当为真时,绘制每月耗尽水平。
显示说明
为真时,为级别绘制描述性标签。如果为 false,则只绘制线条,但如果您需要知道线条代表什么,线条会有工具提示。
在描述中显示价格
为真时,级别值将添加到描述和工具提示中。
说明字体大小
绘制说明时使用的字体大小
延长线
如果为 true,则不会将线绘制到周期的末尾,而是无限期地延伸到图表的右侧。
每个时间段出现以下设置,D1、W1 和 MN1
XX_颜色
绘制线条和描述时使用的颜色
XX_线宽
要绘制的线的宽度。如果 LineStyle 不是 Solid,则忽略此值。在 MetaTrader 上只有实线可以有宽度。
XX_LineStyle
从标准选择中绘制的线条类型。