Round Price Levels MT5
- 指标
- Robert Gerald Wood
- 版本: 1.0
- 激活: 5
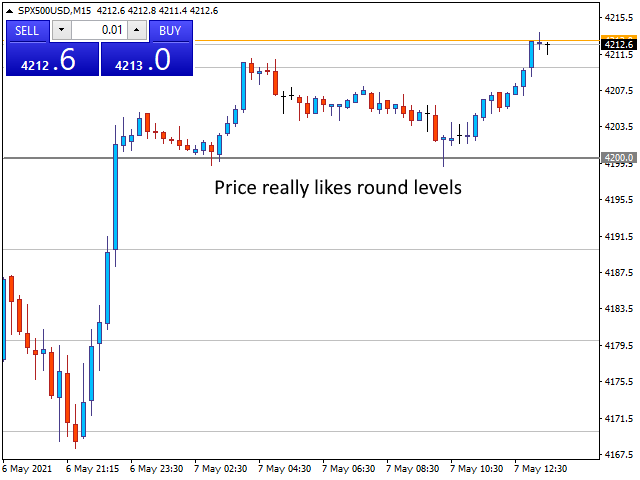
市场真的很喜欢整数,它们通常在下跌的市场中充当支撑,或在价格上涨时充当阻力。
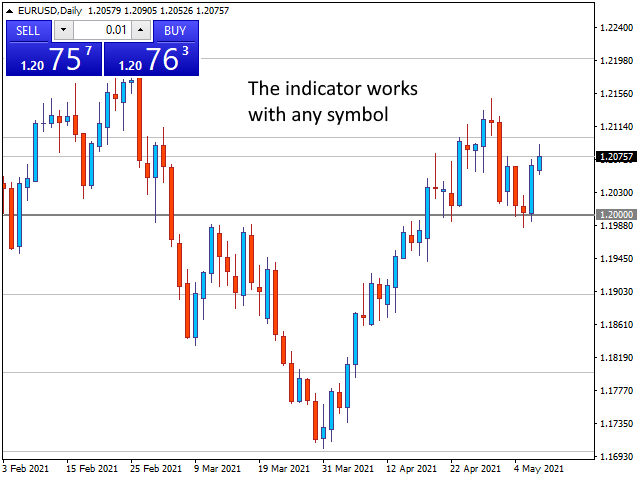
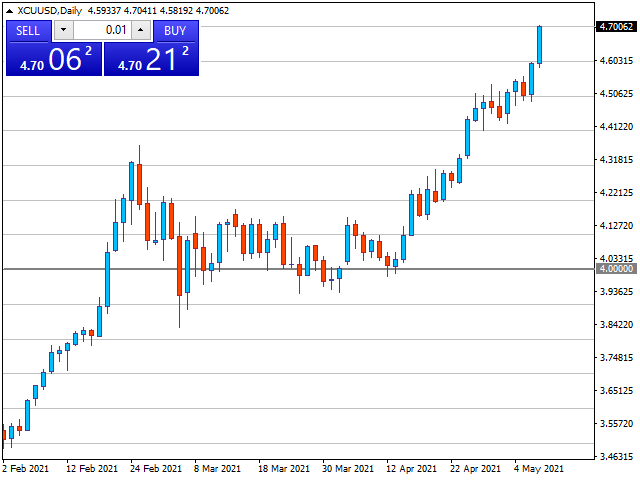
该指标旨在以整数值绘制价格水平。它会自动执行此操作,但您也可以选择覆盖它并确定您希望看到的级别。
一轮水平可以像 10 步一样简单,例如 10、20、30 等,或者如果您从事外汇交易,您可能希望看到 0.1 或 0.01 的变化。
该指标绘制两类线,Major 和 Minor,每类都有不同的格式。这使您可以同时查看两个不同电平变化之间的变化。
警报
该指标包括当价格在可配置距离内时在主要、次要或两个价格水平发出警报的能力。
自动设置
默认情况下,该指标将为主要价格和次要价格确定适当的水平。它使用可配置的 DensityIndex 设置来做到这一点,该设置控制您希望随时在屏幕上看到多少行。
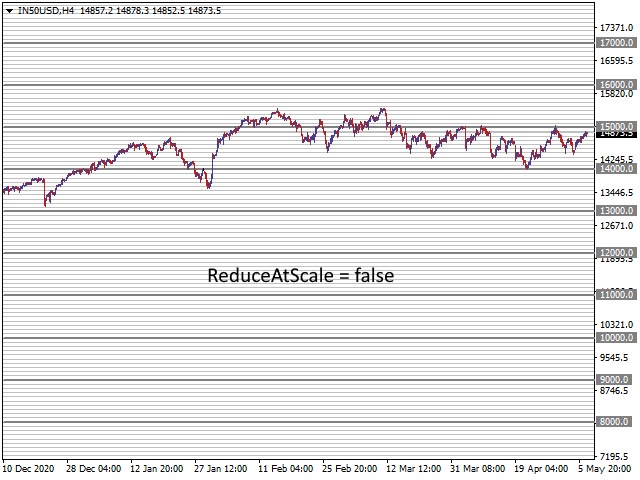
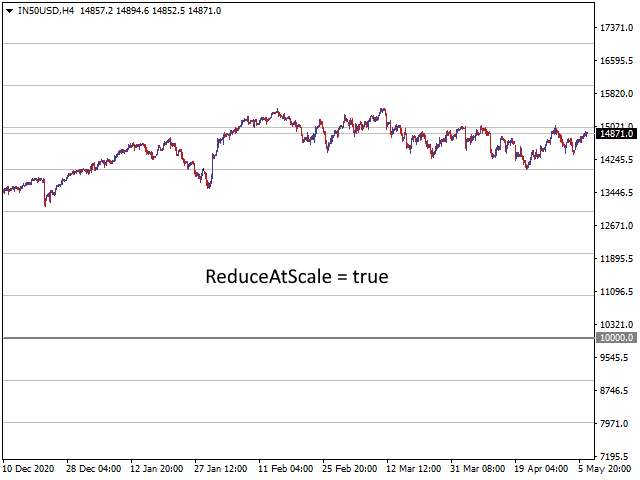
如果您设置自己的缩放比例,使用 MajorGap 和 MinorGap 设置,您仍然可以通过使用 ReduceAtScale 设置来获得限制在屏幕上绘制的线数的指标。
请查看屏幕截图以更清楚地了解此功能。
设置
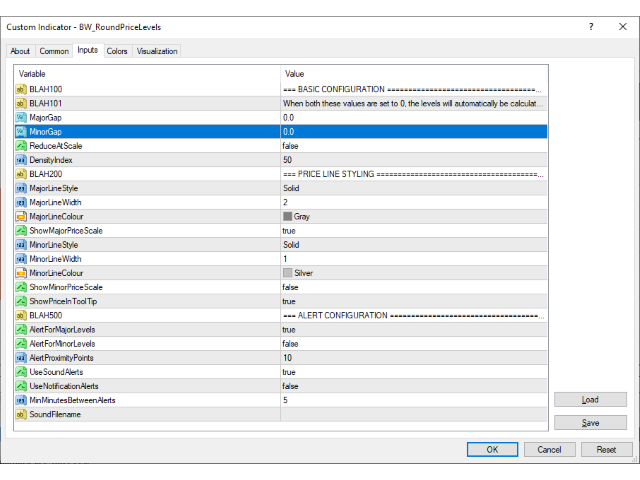
基本配置
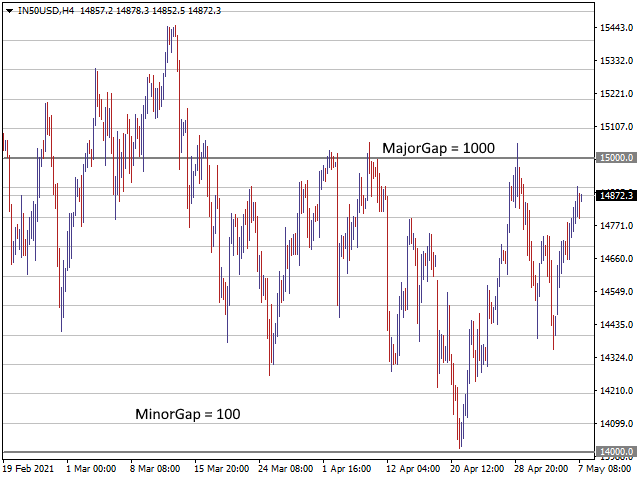
重大差距
当设置为 0.0 时,指标会自动计算出合适的刻度
小间隙
当设置为 0.0 时,指标会自动计算出合适的刻度
按比例减少
为真时,指标将考虑图表的比例并在需要时减少绘制的级别数。
密度指数
自动缩小之前次要值的最大数量。
价格线造型
主要线型
要绘制的线条样式,实线、点线、虚线。从系统支持的值列表中选择。
主线宽
要绘制的线的宽度。如果您希望使用 SOLID 以外的样式,则此值必须等于 1。
主线颜色
绘制线条的颜色。
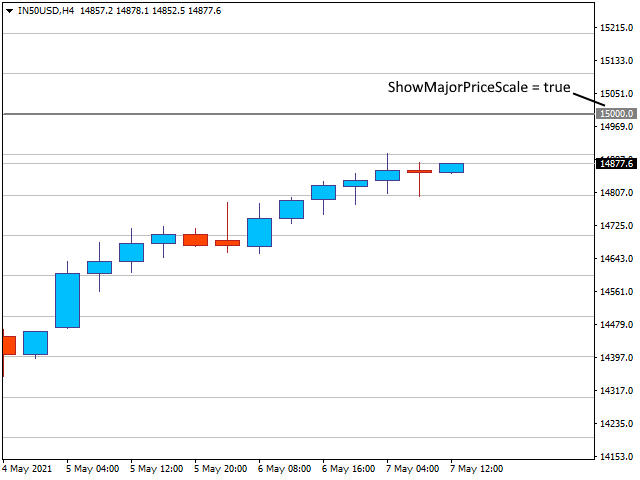
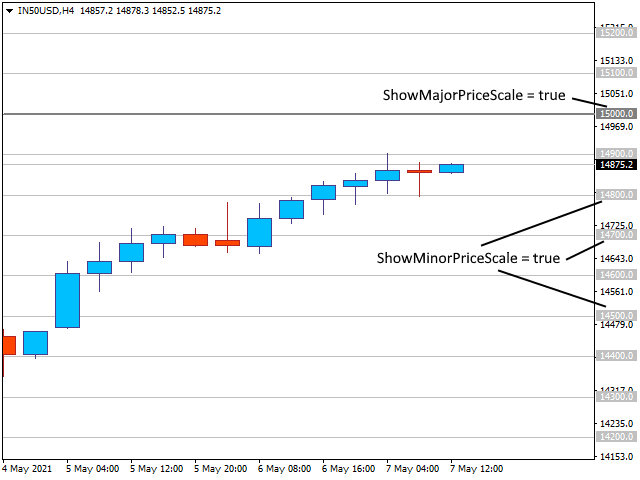
显示主要价位
如果为真,主要价格水平将在图表右侧的价格刻度中突出显示。
小线型
要绘制的线条样式,实线、点线、虚线。从系统支持的值列表中选择。
小线宽
要绘制的线的宽度。如果您希望使用 SOLID 以外的样式,则此值必须等于 1。
次要线色
绘制线条的颜色。
显示次要价位
如果为真,次要价格水平将在图表右侧的价格刻度中突出显示。
在工具提示中显示价格
当为真时,当鼠标光标悬停在它上面时,该线的价格值将显示为工具提示。如果您关闭了价格刻度,则很有用。
警报配置
主要级别警报
为真时,会发出价格接近主要价格水平的警报
次要级别警报
如果为真,则针对价格接近次要价格水平发出警报
警报接近点
当前价格必须接近多少水平才能触发警报。如果当前价格在一个级别的 AlertProximityPoints 点内,则会发出警报。
使用声音提示
触发警报时发出声音。
使用通知提醒
触发警报时,使用 MT4 通知系统发送通知。查看主菜单工具 > 选项,然后选择通知选项卡并在其中进行设置。您还需要 Apple 或 Android 应用程序。
MinMinutesBetween 警报
触发警报后,系统将等待几分钟,然后再触发另一个警报。
声音文件名
内置了提示音,但如果您想使用不同的提示音,您可以在此处指定文件名。文件必须位于终端 MQL/Files 文件夹中。