Volume Levels MT5
- 指标
- Alexander Nikolaev
- 版本: 1.3
- 更新: 10 五月 2021
- 激活: 10
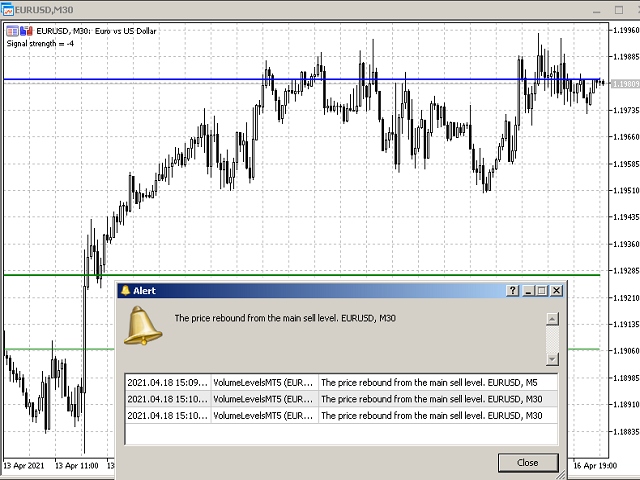
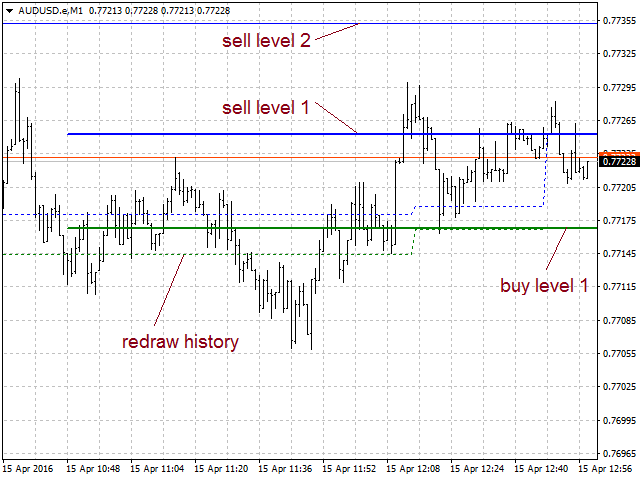
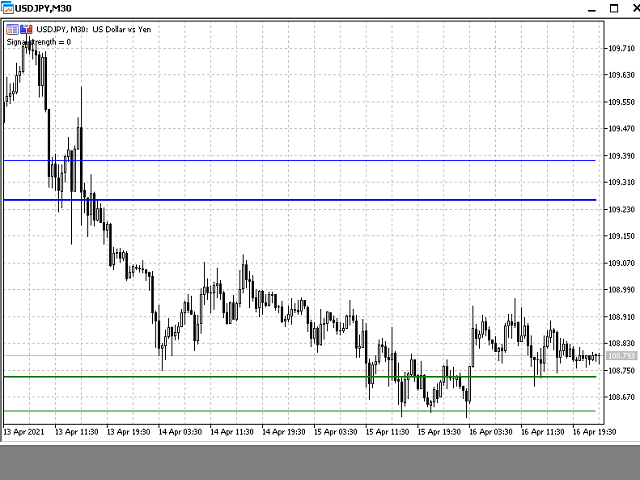
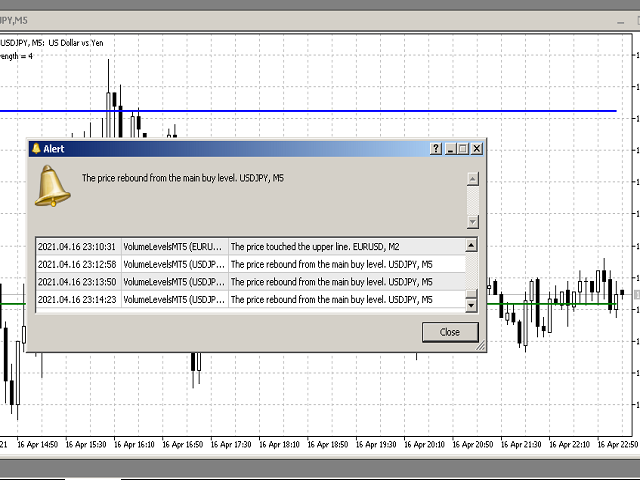
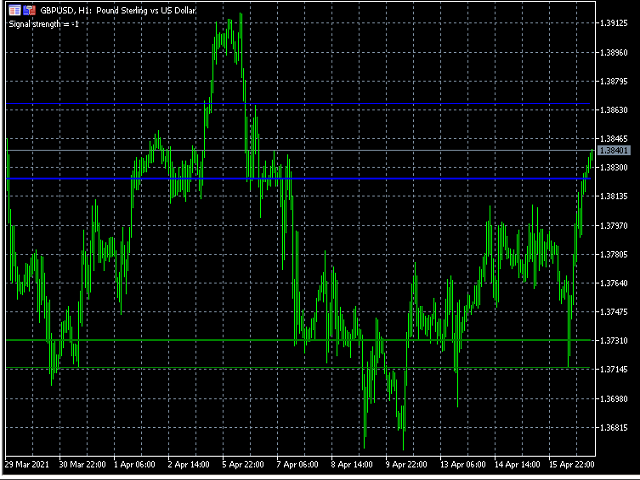
Volume Levels is a very important indicator for exchange trading. At such levels, the majority of transactions were made. In the future, the price often bounces off such levels, and this can be successfully applied in trading. This indicator is able to determine the levels at which there was the most volume over the specified period of history. These levels are shown as lines, and the parameters for determining the levels are configurable. In addition to displaying, this indicator can inform the user when the price touches the level, or repels from it. It can work on any currency pairs and timeframes. Parameters
Parameters
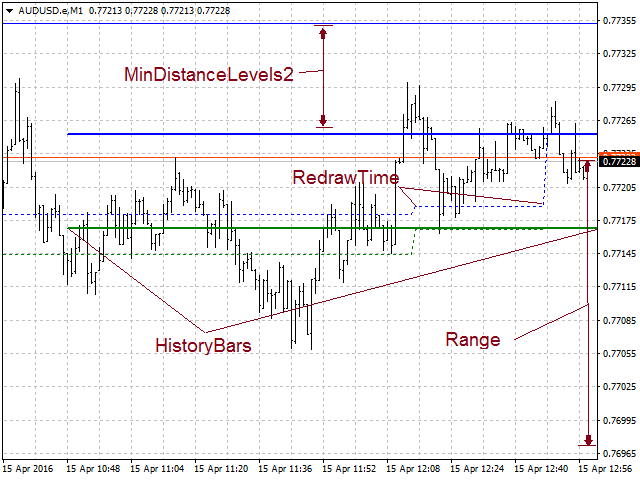
- HistoryBars - the number of bars to determine the near volume levels;
- Range - the maximum distance above and below the current price for determining levels;
- HistoryBarsLevels2 - the number of bars for determining the far volume levels;
- MinDistanceLevels2 - minimum distance from the near level to the far one;
- RedrawTime - level redrawing time;
- Step - the step of determining the levels (the smaller the step, the higher the accuracy, but the calculation of the levels may take longer);
- ClosedBarSignalOnly - receive a signal for alerts only when the bar is closed (otherwise, the signals will be before the close, and they may not be accurate);
- EnableReboundAlert - activate receiving alerts when the price rebounds from the level (when the price first passed the level, but then returned);
- EnableTouchAlert - activate receiving alerts when the price touches the level, or passed near it;
- TimeframeFindLevels - indicates the timeframe from which the levels will be read; to draw only the levels of the current timeframe, select the current timeframe;
- ColorLow - the color of the lower levels;
- ColorHigh - the color of the upper levels.
Recommendations
The smaller the timeframe, and the larger the HistoryBars parameter, the stronger the levels will be. When used on 4-digit accounts, it is better to decrease the Range and MinDistanceLevels2 parameters. The indicator is best used on small timeframes (M1, M5, M15, M30), but it can also be used on larger ones.