• 概述
  • 评论 (4)
  • 评论 (5)
  • 新特性

Chart Drawing Cloner

5

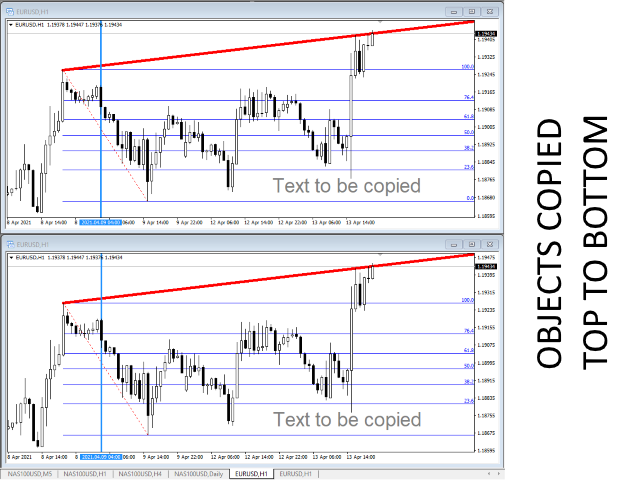
此脚本允许您将任何类型的绘图对象(如趋势线、斐波那契回撤等)复制到一个或多个其他图表。


默认情况下,脚本会将当前图表(即应用脚本的图表)上的所有对象复制到当前加载的相同交易品种的任何其他图表。


设置

目的地时间表

当设置为除 PERIOD_CURRENT 以外的任何值时,它会将对象复制到与应用脚本的图表具有相同交易品种的任何打开图表。

如果您将值设置为特定的时间范围,例如 PERIOD_D1,则只会更新具有相同交易品种和周期的图表。

复制对象类型

您可以将其设置为您希望复制的特定类型的对象,然后只有该类型的对象将被复制到其他图表。

复制指标窗口对象

当设置为 True 时,指示器窗口上的对象也将被复制。这依赖于第二张图表具有与源图表相同的指标,并且顺序相同。


在图表之间复制对象让您满意!


评论 4
Christian Astillero
1203
Christian Astillero 2022.03.08 14:52 
 

Perfect

CasiousD
784
CasiousD 2021.10.30 19:39 
 

2nd indicator I have from this author. Took some getting used to understanding how it interacts with other indicators already on the chart, but once I figured it out (I can be slow sometimes), works perfectly. As with the other indicator I have from this author (Multi Chart Crosshairs), this is going to make my market analysis so much easier! Thank you again!

Payman
662
Payman 2021.04.16 15:05 
 

its really cool because its the only copier that also copies the objects description i found. i wish i could exclude certain objects like buttons and labels. but anyways its already awesome. thanks

推荐产品
其中一个数字序列称为“森林火灾序列”。它被公认为最美丽的新序列之一。它的主要特点是该序列避免了线性趋势,即使是最短的趋势。正是这一属性构成了该指标的基础。 在分析金融时间序列时,该指标试图拒绝所有可能的趋势选项。只有当他失败时,他才会认识到趋势的存在并给出适当的信号。这种方法可以让人们正确地确定新趋势开始的时刻。然而,误报也是可能的。为了减少它们的数量,该指标添加了一个额外的过滤器。当新柱打开时会生成信号。在任何情况下都不会发生重绘。 指标参数: Applied Price - 应用价格常数; Period Main - 指标的主要周期,其有效值在 5 - 60 之间; Period Additional - 附加周期,此参数的有效值为 5 - 40; Signal Filter - 附加信号滤波器,有效值 0 - 99; Alerts - 启用后,指示器会在出现新信号时提醒您; Send Mail - 允许指标向电子邮件发送消息; Push - 允许您发送 Push 消息。
VR Cub
Vladimir Pastushak
VR Cub 这是获得高质量切入点的指标。该指标的开发是为了促进数学计算并简化对仓位入场点的搜索。多年来,该指标所针对的交易策略已被证明其有效性。交易策略的简单性是其巨大的优势,即使是新手交易者也能成功进行交易。 VR Cub 计算开仓点以及获利和止损目标水平,这显着提高了效率和易用性。查看使用以下策略进行交易的屏幕截图,了解简单的交易规则。 设置、设置文件、演示版本、说明、问题解决,可以从以下位置获取 [博客] 您可以在以下位置阅读或撰写评论 [关联] 版本为 [MetaTrader 5] 计算入场点的规则 开仓 要计算入场点,您需要将 VR Cub 工具从最后一个高点拉伸到最后一个低点。 如果第一个点在时间上早于第二个点,交易者等待柱线收于中线上方。 如果第一个点在时间上晚于第二个点,交易者等待柱线收于中线下方。 根据上述条件,严格在 柱线收盘 后建仓。 换句话说,如果我们在小时图上进行交易,那么从最高点到最低点的时间距离必须超过24小时,最高点和最低点之间的点数必须大于或等于平均价格变动每天。 维持和改变市场地位 可以有多个未平仓头寸;每个头寸都可以单独修改。 VR Cu
Trendiness Index
Libertas LLC
5 (3)
"The trend is your friend" is one of the best known sayings in investing, because capturing large trendy price movements can be extremely profitable. However, trading with the trend is often easier said than done, because many indicators are based on price reversals not trends. These aren't very effective at identifying trendy periods, or predicting whether trends will continue. We developed the Trendiness Index to help address this problem by indicating the strength and direction of price trend
Trend Ray
Andriy Sydoruk
The indicator shows the potential trend direction by cyclical-wave dependence. Thus, all the rays of the intersection will be optimal rays, in the direction of which the price is expected to move, taking into account the indicator period. Rays can be used as a direction for potential market movement. But we must not forget that the approach must be comprehensive, the indicator signals require additional information to enter the market.
Bigger chart labels would allow the user to be entirely aware of which chart he/she is on.  Each chart window is unique, containing different patterns and economic motives so acknowledging the chart window would be absolutely essential!  There are well known Economic Time Zones included in clear view, by choice!    Simple does it! Use your computing mouse scroller, clicking with the right finger on the label, in order to customize the label properties. From there, choose your preferred color,
FREE
Awesome Oscillator by Bill Williams with the ability to fine-tune and replace the averaging algorithms of the indicator, which significantly expands the possibilities of using this oscillator in algorithmic trading and brings it closer in its properties to such an indicator as the MACD. To reduce price noise, the final indicator is processed with an additional Smooth averaging. The indicator has the ability to give alerts, send mail messages and push signals when the direction of movement of th
Big Trend Signal   indicator is designed for trend and signal trading. This indicator generates trend signals.  It uses many algorithms and indicators to generate this signal. It tries to generate a signal from the points with the highest trend potential. This indicator is a complete trading product. This indicator does not need any additional indicators.  You can only trade with this indicator. The generated signals are displayed on the graphical screen.  Thanks to the alert features you can ge
Close by percentage MT4
Konstantin Kulikov
4.86 (7)
Hello friends. I wrote this utility specifically for use in my profile with a large number of Expert Advisors and sets ("Joint_profiles_from_grid_sets" https://www.mql5.com/en/blogs/post/747929 ). Now, in order to limit losses on the account, there is no need to change the "Close_positions_at_percentage_of_loss" parameter on each chart. Just open one additional chart, attach this utility and set the desired percentage for closing all trades on the account. The utility has the following function
FREE
Gvs Undefeated Trend   indicator is designed for trend and signal trading. This indicator generates trend signals.  It uses many algorithms and indicators to generate this signal. It tries to generate a signal from the points with the highest trend potential. This indicator is a complete trading product. This indicator does not need any additional indicators.  You can only trade with this indicator. The generated signals are displayed on the graphical screen.  Thanks to the alert features you ca
The professional utilities "Ichimoku Waves Meter" to analyse graphs using the correct interpretation of Ichimoku kinkōhyō! Is a graphic program that allows traders to quickly and easily measure the proportions between the indicated points on the price graph. This time and price indicator is a basic tool for analysing the chart according to the Ichimoku strategy on the MT4 platform. Using this tool allows an insightful and complete analysis of time waves as well as price waves in a very short t
Diamond PRO
Fanur Galamov
5 (9)
Diamond PRO is enhanced powerful version of Diamond for advanced traders. Pro version includes optimized cores, new impoved entry points filters, new multistage profit closure algorithm and сontains number of external control parameter that allows build and fine tune own tradind decisions and algorithms. The system provides more accurate market entries, analyzes and filters upcoming economic news, contains spread protection and an advanced position management algorithm. Main goal of Diamond PRO
This    Perfective Signal System   indicator is designed for signal trading. This indicator generates trend signals. It uses many algorithms and indicators to generate this signal. It tries to generate a signal from the points with the highest trend potential. This indicator is a complete trading product. This indicator does not need any additional indicators. The indicator certainly does not repaint. The point at which the signal is given does not change.     Features and Suggestions
The Arrow Scalper
Fawwaz Abdulmantaser Salim Albaker
1 (2)
Dear Friend..  I share with you this simple Expert Adviser .. it is full automatic  this Expert Adviser following the trend of the pair you install on or any stocks or indices , it is works like that: - when the trend on H4 chart show a start of up trend the expert will wait till the 15M & 1H charts show an up trend the EA will open a buy order directly , and do the same for down trend and open a sell order the buy or sell  order lot size and take profit and stop loss will measured manually  by
FREE
Quantum Heiken Ashi PRO MT4
Bogdan Ion Puscasu
4.43 (7)
介绍     Quantum Heiken Ashi PRO 图表 Heiken Ashi 蜡烛旨在提供对市场趋势的清晰洞察,以其过滤噪音和消除虚假信号的能力而闻名。告别令人困惑的价格波动,迎接更流畅、更可靠的图表表示。 Quantum Heiken Ashi PRO 的真正独特之处在于其创新公式,它将传统烛台数据转换为易于阅读的彩色条。红色和绿色条分别优雅地突出了看跌和看涨趋势,让您能够以非凡的精度发现潜在的进入和退出点。 量子 EA 通道:       点击这里 MT5版本:       点击这里 这一卓越的指标具有以下几个关键优势: 增强清晰度:通过平滑价格波动,Heiken Ashi 金条可以更清晰地反映市场趋势,使您更容易识别有利的交易机会。 减少噪音:告别经常导致错误信号的不稳定价格变动。 Quantum Heiken Ashi 指标可过滤噪音,使您能够做出更明智的交易决策 无缝集成:Heiken Ashi 指标专为 MetaTrader 开发,可无缝集成到您的交易平台中。它用户友好、高度可定制,并且与您的其他交易指标和过滤器兼容 无论您是寻求新优势的经验
REX complete 3in1
Christophe Godart
This is the complete REX package. It consists of the lite, pro and ULTRA version.  Perfect for beginners and intermediates. REX complete is 100% non repaint. The strategy is based on a mix of different strategies, statistics, including pivot points, oscillators and patterns.  As the trading idea consists of a variety of some classic indicators like Momentum, Williams Percent Range, CCI, Force Index, WPR, DeMarker, CCI, RSI and Stochastic, it is clear that the fundamental indicators have being
Introduction It is common practice for professional trades to hide their stop loss / take profit from their brokers. Either from keeping their strategy to the themselves or from the fear that their broker works against them. Using this indicator, the stop loss / take profit points will be drawn on the product chart using the bid price. So, you can see exactly when the price is hit and close it manually.  Usage Once attached to the chart, the indicator scans the open orders to attach lines fo
RSI heatmap
Mr Pimook Chokdamrongsuk
Welcome to the world of trading and technical analysis. In today's fast-paced markets, understanding market sentiment and identifying potential entry and exit points is crucial for successful trading. One essential tool in a trader's arsenal is the Relative Strength Index, or RSI. And now, we introduce the Free RSI Heat Map, a powerful visualization tool that brings RSI data to life. RSI Heat Map offers a comprehensive overview of the RSI values across multiple instruments, allowing trade
FREE
LineBreakMT4
Nattadecha Tangpakinwat
Key Features: Type of Indicator: Line Break Chart Indicator Usage: Identifying trend reversals and potential market turning points. Input Parameters: The primary input parameter is 'Lines_Break,' which represents the number of lines the price needs to move to create a new line in the opposite direction. How it works: The indicator draws green and red histogram bars to represent the line break chart. Green bars indicate an upward trend, and red bars indicate a downward trend. The indicator calcul
FREE
FreqoMeterForecast
Stanislav Korotky
The main idea of this indicator is rates analysis and prediction by Fourier transform. Indicator decomposes exchange rates into main harmonics and calculates their product in future. You may use the indicator as a standalone product, but for better prediction accuracy there is another related indicator - FreqoMaster - which uses FreqoMeterForecast as a backend engine and combines several instances of FreqoMeterForecast for different frequency bands. Parameters: iPeriod - number of bars in the ma
Strong Oscillator is an indicator designed to find indicator trends. It finds trends using a set of algorithms and a set of indicators. This indicator is a trend indicator. Helps to find trends easily. You can use this indicator alone, or you can use it as an auxiliary indicator for other strategically appropriate indicators. You can use it as a trend validation indicator. Suggestions and Features There are 4 level lines on the indicator. These level lines 5, 20 and 80 are 95 lines. 5, 20 le
Free automatic fibonacci
Tonny Obare
4.63 (59)
Free automatic Fibonacci is an indicator that automatically plots a Fibonacci retracement based on the number of bars you select on the BarsToScan setting in the indicator. The Fibonacci is automatically updated in real time as new highest and lowest values appears amongst the selected bars. You can select which level values to be displayed in the indicator settings. You can also select the color of the levels thus enabling the trader to be able to attach the indicator several times with differe
FREE
Noize Absorption Index MT4
Ekaterina Saltykova
5 (1)
Noize Absorption Index - is the manual trading system that measures the difference of pressure between bears forces and bulls forces. Green line - is a noize free index that showing curent situation. Zero value of index shows totally choppy/flat market.Values above zero level shows how powerfull bullish wave is and values below zero measures bearish forces.Up arrow appears on bearish market when it's ready to reverse, dn arrow appears on weak bullish market, as a result of reverse expectation. S
Indicador Taurus All4
Fabio Oliveira Magalhaes
Taurus All4 Taurus All4 is a high-performance indicator, it will tell you the strength of the trend, and you will be able to observe the strength of the candle. Our indicator has more than 4 trend confirmations. It is very simple and easy to use. Confirmation Modes Candle Trend Confirmations: When the candle switches to light green the trend is high. When the candle switches to light red the trend is reverting down. When the candle changes to dark red the trend is low. Trendline Trend Conf
Alpha Trend
Evgeny Belyaev
3.33 (3)
Alpha Trend is a trend indicator for the MetaTrader 4 platform; it has been developed by a group of professional traders. The Alpha Trend indicator finds the most probable tendency reversal points, which allows making trades at the very beginning of a trend. This indicator features notifications, which are generated whenever a new signal appears (alert, email, push-notification). This allows you to open a position in a timely manner. Alpha Trend does not redraw, which makes it possible to evalua
FreqoMaster
Stanislav Korotky
The main idea of this indicator is rates analysis and prediction by Fourier transform. The indicator decomposes exchange rates into main harmonics and calculates their product in future. The indicator shows 2 price marks in history, depicting price range in the past, and 2 price marks in future with price movement forecast. Buy or sell decision and take profit size are displayed in a text label in the indicator window. The indicator uses another indicator as an engine for calculations - FreqoMet
COG LR Osc AM
Andriy Matviyevs'kyy
The presented indicator allows you to determine potential entry points into the market and set protective orders at reasonable levels. This product can be useful for both beginners and experienced traders. The indicator is based on calculation methods proven by time and practicing traders. The indicator is calculated in two stages: At the first stage, linear regression (LR) of the selected price type is determined for a given number of chart periods. At the second stage, the obtained data is p
首先,值得强调的是,这个交易工具是非重绘、非重画和非滞后的指标,非常适合专业交易。 智能价格行动概念指标是一个非常强大的工具,既适用于新手,也适用于经验丰富的交易者。它将超过20个有用的指标合并到一个指标中,结合了高级交易思想,如内圈交易员分析和智能资金概念交易策略。该指标侧重于智能资金概念,提供有关大型机构交易方式的见解,帮助预测它们的动向。 它在流动性分析方面尤其擅长,有助于理解机构的交易方式。它擅长预测市场趋势,并仔细分析价格波动。通过将您的交易与机构策略对齐,您可以更准确地预测市场走向。该指标多才多艺,擅长分析市场结构,识别重要的订单区块,并识别各种模式。 它擅长识别BOS和CHoCH等模式,理解动量的转变,并突出显示供需强劲的关键区域。它还擅长发现强大的不平衡,并分析价格创造更高高点或更低低点的模式。如果您使用斐波那契回撤工具,该指标可以满足您的需求。它还可以识别相等的高点和低点,分析不同的时间框架,并通过仪表板显示数据。 对于使用更高级策略的交易者,该指标提供了工具,如公平价值差指标和优惠和折扣区域的识别。它特别关注高时间框架订单区块,并在较长时间框架内彻
MA Crosses PRO MT4
Vladimir Gribachev
5 (1)
MA CROSSES PRO MT4 是一個移動平均線交叉箭頭指標。指標參數有直觀的名稱,每行單獨配置。指示器可以通過顯示箭頭、發出聲音信號、向移動終端和電子郵件發送通知來發出信號。 指標不會重繪 僅在蠟燭收盤時發出信號 非常適合剝頭皮 適用於任何貨幣對和任何時間範圍 時間越長,信號越好 作為任何交易策略的附加組件兼容。 選項: FASTER_MA - 快速移動週期; FASTER_MA_METHOD - 快速移動平均法; FASTER_MA_PRICE - 使用價格; FASTER_MA_SHIFT - 移位; SLOWER_MA - 緩慢移動週期; SLOWER_MA_METHOD - 緩慢移動平均法; SLOWER_MA_PRICE - 使用價格; SLOWER_MA_SHIFT - 移位; ALERT - 顯示一個對話框; PUSH_NOTIFICATIONS - 向移動終端發送通知; SEND_MAIL - 發送電子郵件;
For this set of indicators 1. General information     - Calculates with high performance mathematical algorithms.     - Calculated from the price of candles     - The entry point of this order is filtered by the train EMA and the oscillator.     - Calculate the integrity of the candle 2. How does it work?     - You can see two types of order entry points: the notification on the monitor and the arrow.     - You can trust 75-95 percent of this entry point. 3. Settings     - Retracement is re
Infinity Trend Pro
Yaroslav Varankin
1 (1)
This is a trend indicator without redrawing Developed instead of the binary options strategy (by the color of the Martingale candlestick) Also works well in forex trading When to open trades (binary options) A signal will appear in the place with a candle signaling the current candle It is recommended to open a deal for one candle of the current timeframe M1 and M5 When a blue dot appears, open a deal up When a red dot appears, open a trade down. How to open trades on Forex. When a signal is rec
该产品的买家也购买
Trade Assistant MT4
Evgeniy Kravchenko
4.46 (181)
它有助于计算每笔交易的风险,容易安装新的订单,具有部分关闭功能的订单管理, 7 种类型的追踪止损和其他有用的功能。 注意,该应用程序在策略测试器中不起作用。 Manual, Description, Download demo 线条功能  - 在图表上显示开仓线、止损线、止盈线。 有了这个功能,就可以很容易地设置一个新的订单,并在开仓前看到它的附加特性。   风险管理  - 风险计算功能在考虑到设定的风险和止损单的大小的情况下,计算新订单的成交量。它允许你设置任何大小的止损,同时观察设定的风险。 批量计算按钮 - 启用 / 禁用风险计算。 在 " 风险 " 一栏中设置必要的风险值,从 0 到 100 的百分比或存款的货币。 在 " 设置 " 选项卡上选择风险计算的变量: $ 货币, % 余额, % 资产, % 自由保证金, % 自定义, %AB 前一天, %AB 前一周, %AB 前一个月。   R/TP 和 R/SL - 设置止盈和止损的关系。 这允许你设置相对于损失的利润大小。 例如, 1 : 1 - 这决定了 TP = SL 的大小。 2 : 1 - 这意味着 TP 是
您认为在价格可以瞬间变化的市场中,下单应该尽可能简单吗? 在 Metatrader 中,每次您要开单时,您都必须打开一个窗口,您可以在其中输入开盘价、止损和止盈以及交易规模。 在金融市场交易中,资本管理对于维持您的初始存款并使其倍增至关重要。 因此,当您想下订单时,您可能想知道应该开多大的交易? 在这单笔交易中,您应该承担多少百分比的存款? 您可以从这笔交易中获利多少,利润风险比是多少? 在您设置交易规模之前,您需要进行必要的计算,以获得交易规模应该是多少的问题的答案。 想象一下,您有一个工具可以自动完成所有这些工作。 您打开图表,进行市场分析并用水平线标记入场点、防御点(止损)和目标(止盈),最后您定义风险水平,例如 作为可用资本的百分比,您可以在此交易中承担,此时程序提供: 定义风险和止损规模的可接受交易规模 以点数、点数和账户货币计的止损和获利值 风险回报率 现在剩下的就是点击面板上的相应按钮来打开交易。 如果您是黄牛,需要在不设置防御或目标的情况下快速打开和关闭交易,那么您可以在交易管理器面板中轻松掌握一切,您可以在其中定义固定订单参数并通过单击“购买”或 “卖出”按钮。 关闭
Local Trade Copier EA MT4
Juvenille Emperor Limited
5 (77)
通过 Local Trade Copier EA MT4 获得非常快速的交易复制体验。它的简单1分钟设置,使您可以在同一台Windows计算机或Windows VPS上在多个MetaTrader终端之间复制交易,具有闪电般快速的复制速度,低于0.5秒。 无论您是初学者还是专业交易者, Local Trade Copier EA MT4 都提供了广泛的选项,可根据您的特定需求进行自定义。对于任何希望增加利润潜力的人来说,这都是终极解决方案。 今天就尝试一下,看看为什么它是市场上最快、最简单的贸易复印机! 提示: 您可以在您的模拟账户中下载并试用 Local Trade Copier EA MT4 模拟版: 这里 将下载的免费演示文件粘贴到您的 MT4 >> 文件 >> 打开数据文件夹 >> MQL4 >> 专家文件夹并重新启动您的终端。  免费演示版本每次可在 4 小时内发挥全部功能,仅限演示帐户。 要重置试用期,请转至 MT4 >> 工具 >> 全局变量 >> Control + A >> 删除。 请仅在非关键模拟账户上执行此操作,不要在挑战道具公司账户中执行此操作。 Local
TradePanel MT4
Alfiya Fazylova
4.91 (85)
交易面板是一个多功能的交易助手。 该应用程序包含 50 多个专为手动交易而设计的功能。 允许您自动执行大多数交易操作。 应用程序的主要功能: 适用于任何交易工具(外汇、差价合约、期货及其他)。 通过一个终端窗口即可使用所有交易工具。 允许您创建最多四个交易工具工作列表。 允许您选择您最喜欢的交易工具。 允许您在所有(或选定的)终端图表上快速切换交易品种。 允许您使用多种方法来计算交易量。 自动计算每笔交易的风险。 根据止损的大小计算风险。 风险经理。 让您可以在图表上直观地看到新订单的交易水平。 允许您设置虚拟止损和获利。 允许您设置指定的止损和获利比率。 允许您在共同价格水平上为所有头寸设置止损或止盈。 允许您下 OCO 订单(一个订单取消另一个订单)。 允许您根据指定参数关闭订单和平仓。 允许您在达到指定的总利润或损失时平仓。 允许您在图表上设置任务线。 允许您反转“卖出转买入”和“买入转卖出”仓位。 允许您锁定仓位。 允许您设置追踪止损功能。 允许您设置盈亏平衡函数。 允许您设置部分平仓功能。 允许您在达到指定价格水平时设置提醒。 允许您自动和手动截图。 有 5 种界面配色方案
MT4 至 Telegram 信号提供者 是一款易用、可完全自定义的工具,它使发送信号到 Telegram 成为可能,将您的账户变成信号提供者。 消息的格式 可以完全自定义! 但是,为了简便使用,您也可以选择一个预设模板,并能够启用或禁用消息的特定部分。 [ 演示 ]  [ 手册 ] [ MT5 版本 ] [ Discord 版本 ] [ Telegram 频道 ] 设置 可通过 用户指南 获取逐步说明。 无需了解 Telegram API;开发者提供所需的一切。 主要特性 自定义发送给订阅者的订单详情的能力 您可以创建分层订阅模型,例如铜牌、银牌、金牌。金牌订阅可获得所有信号等。 按订单号、符号或备注过滤订单 包括执行订单的图表的屏幕截图 在发送的屏幕截图上绘制已关闭的订单,以便额外验证 推迟发送新订单消息的可能性,以便在发送前对位置进行调整 订单详情的全透明度: 新的市场订单 *附带屏幕截图 订单修改(止损、获利点) 已关闭订单 *附带屏幕截图 部分关闭订单 ** 新的挂起订单 修改的挂起订单(进场价格) 挂起订单激活(作为新的市场订单) 已删除的挂起订单
交易管理器可帮助您快速进入和退出交易,同时自动计算风险。 包括帮助您防止过度交易、报复性交易和情绪化交易的功能。 交易可以自动管理,账户绩效指标可以在图表中可视化。 这些功能使该面板成为所有手动交易者的理想选择,并有助于增强 MetaTrader 4 平台。多语言支持。 MT5版本  |  用户指南+演示 交易经理在策略测试器中不起作用。 如需演示,请参阅用户指南 风险管理 根据%或$自动调整风险 可选择使用固定手数或根据交易量和点自动计算手数 使用 RR、点数或价格设置盈亏平衡止损 追踪止损设置 最大每日损失百分比,在达到目标时自动平仓所有交易。 保护账户免遭过多提款并阻止您过度交易 最大每日损失(以美元为单位)在达到目标时自动关闭所有交易。 保护账户免遭过多提款并阻止您过度交易 一键实现所有交易的盈亏平衡 自动计算从手机/电话发送的交易的风险 OCO 在设置中可用 交易和头寸管理 通过设置每月、每周、每天、每小时或每分钟的最大交易次数,停止过度交易和报复性交易。 高级挂单管理。 调整何时关闭挂单的规则 追踪挂单 支持市价订单和挂单 每日最大利润目标(以美元为单位)以确保头寸并停
Exp COPYLOT CLIENT for MT4
Vladislav Andruschenko
4.66 (67)
MetaTrader 4 的交易复制器。     它从任何账户复制外汇交易、头寸、订单。 它是最好的贸易复印机之一     MT4 - MT4,MT5 - MT4     为了   复制 MT4     版本(或     MT4 - MT5 MT5 - MT5     为了   复制MT5     版本)。 MT5版本 详细描述   +DEMO +PDF 如何购买 如何安装     如何获取日志文件     如何测试和优化     Expforex 的所有产品 复印机 版本       MetaTrader 5 终端 (   МТ5 - МТ5, МТ4 - МТ5   )-   Copylot 客户端 MT5 独特的复制算法将所有交易从主账户准确复制到您的客户账户。 该产品还以其高运行速度而著称,并且具有强大的错误处理能力。 一组强大的功能。 该程序可以在多个终端绑定上运行。 使用它作为您在一个账户上交易的多个账户的交易 的同步器 , - COPYLOT 会将您的交易复制到其他终端。 从已关闭的账户中复制 Invest 密码; 部分关闭仅从 mt4 到 mt4
The product will copy all telegram signal to MT4   ( which you are member  ) , also it can work as remote copier.  Easy to set up, copy order instant, can work with almost signal formats, image signal, s upport to translate other language to English Work with all type of channel or group, even channel have "Restrict Saving Content", work with  multi channel, multi MT5 Work as remote copier: with signal have ticket number, it will copy exactly via ticket number. Support to backtest signal. How to
Trade copier MT4
Alfiya Fazylova
4.67 (30)
Trade Copier 是一种专业实用程序,旨在复制和同步交易账户之间的交易。 复制发生从供应商的帐户/终端到收件人的帐户/终端,安装在同一台计算机或 vps 上。 在购买之前,您可以在演示帐户上测试演示版本。 演示 这里 。 完整说明 这里 。 主要功能和优点: 支持复制MT4>MT4、MT4>MT5、MT5>MT4,包括МТ5 netting账户。 供应商和收件人模式在同一产品中实现。 简单直观的界面,允许您直接从图表中实时控制复制。 连接中断或终端重新启动时不会丢失设置和位置。 允许您选择要复制的符号,也可以替换接收者的符号,例如 EURUSD> USDJPY。 支持回拷贝。 能够仅复制某些订单。 允许您设置开仓交易价格的最大差异和最大时间延迟。 正确复制部分订单关闭的执行。 计算复制手数的几种方法。 同步止盈和止损。有几种方法可以计算它们的位置。 支持通过执行在“Market account”上工作,其中 SL / TP 仅在开仓后设置。 如何使用简单的设置复制交易 将供应商终端和接收终端安装在同一台计算机或 VPS 上。 在供应商终端上以“Master”模式安装复印机,然后
Grid Manual MT4
Alfiya Fazylova
4.71 (17)
Grid Manual是一个交易面板,用于处理订单网格。 该实用程序是通用的,具有灵活的设置和直观的界面。 它不仅可以在亏损方向上设置订单网格,还可以在盈利方向上设置订单网格。 交易者不需要创建和维护订单网格,实用程序会这样做。 打开一个订单就足够了,Grid manual会自动为它创建一个订单网格,并伴随它直到非常关闭。 该实用程序的主要特性和功能: 伴隨以任何方式打開的訂單,包括從移動終端打開的訂單。 適用於兩種類型的網格:“限制”和“停止”。 使用兩種方法計算網格間距:固定和動態(基於 ATR 指標)。 允許您更改未結訂單網格的設置。 顯示圖表上每個網格的盈虧平衡水平。 顯示每個網格的利潤率。 允許您一鍵關閉網格中的盈利訂單。 讓您一鍵關閉每個訂單網格。 允許您對訂單網格應用追踪止損功能。 允許您在訂單網格上應用將訂單網格的止損轉移到盈虧平衡水平的功能。 相對於訂單網格的盈虧平衡水平自動重新排列止盈(僅在限價網格模式下,距離取決於所選的計算類型:“保守”或“激進”)。 最多可管理 20 個訂單網格,每個網格最多可包含 100 個訂單。 計算初始手數時,要考慮入金的大小,不要讓大手
-25% discount ($199 -> $149) Advanced trading tool: One click smart orders that execute under your conditions Developed by trader for trading community:  position size calculator (lot size), open position after price action, strategy builder, set and forget trading, mobile notifications... Risk Management -  Risk percentage position size calculator, gain percentage, target risk reward ratio, spread and commissions are included in calculations 7 Advanced order types   - Set and forget trading
控制您的外匯投資組合。立即查看您的站立位置、工作原理以及導致您疼痛的原因! 此處提供 MT5 版本: https://www.mql5.com/en/market/product/58658 交易經理儀表板旨在讓您一目了然地顯示您當前在外匯市場中的每個頭寸,並使風險管理和貨幣敞口更易於理解。 對於通過多個頭寸或交易網格和籃子策略逐漸進入市場的交易者,這是需要查看的關鍵信息。監控終端中的多個位置通常很難管理。 過度槓桿化和使用低風險:回報是新交易者和一些經驗豐富的交易者面臨的主要問題,交易經理向您展示您對每種貨幣的風險敞口,確保您不會同時進行雙向交易。 特徵: 未平倉交易 - 查看您當前按貨幣對排序的所有未平倉交易。您不僅可以在該貨幣對上看到您的方向偏差,還可以在該貨幣對上運行的每筆交易或頭寸上看到您的方向偏差。 回撤和利潤信息 - 立即查看您交易活躍的貨幣對的回撤或盈利情況。輕鬆識別需要管理的交易。 手數大小 - 查看您在每個貨幣對上的手數以及您進行的交易數量。 風險敞口 - 查看您對每種貨幣的方向偏差,以確保您不會在另一個入場時以相反的方向交易。另請查看您在該貨幣中使用
VirtualTradePad mt4 Extra
Vladislav Andruschenko
4.88 (59)
一键交易的交易面板。处理头寸和订单!通过图表或键盘进行交易 交易小组进行人工交易。您可以从图表(图表窗口)或键盘进行交易。打开和关闭,反向和锁定。处理职位和订单! МetaТrader4中主要订单的交易控制面板:买入,卖出,买入,买入,卖出,卖出限制,收盘,删除,修改,追踪止损,止损,止损。 MT5版本 详细描述   +DEMO +PDF 如何购买 如何安装     如何获取日志文件     如何测试和优化     Expforex 的所有产品 从符号窗口交易并从键盘交易! 您正在为MetaTrader 4终端提供一个独特的插件 - 虚拟控制面板VirtualTradePad。 Description on English 注意!如果您想学习如何交易 策略测试器  ,请查看我们的免费 TesterPad 实用程序 VirtualTradePad在“  MQL5语言最佳图形面板  ”竞赛中 获得二等奖 。 工作标签 职位标签   -使用职位: 开/关买入和卖出, 冲销所有头寸, 锁定一个共同的立场, 更改止损/获利, 设定一般的止损/获利的位置, 启用追踪止损, 实现盈亏
Unlimited Trade Copier Pro is a tool to copy trade remotely between multiple MT4/MT5 accounts at different computers/locations over internet. This is an ideal solution for signal provider, who want to share his trade with the others globally on his own rules. One provider can copy trades to multiple receivers and one receiver can get trade from multiple providers as well. The provider can even set the subscription expiry for each receiver, so that receiver will not be able to receive the signal
MT4 Alert Signal Trader  is an EA that helps you trade MT4 Alert popup. Some indicators can provide signals by showing an alert popup containing signal texts. This EA will read and trade these signal texts. The alert texts should contain at least 2 elements:  (1) a symbol text   (ex: "EURUSD") and  (2) a command type   (ex: "Buy", "Sell", "Close") that trigger EA's trading activities. Some other contents that may have or not are open price, stop loss, take profit values... The EA needs an aweso
OrderManager MT4
Lukas Roth
4.63 (19)
介绍 OrderManager :MT4的革命性工具 使用全新的Order Manager实用程序,像专业人士一样管理您在MetaTrader 4上的交易。Order Manager设计简单,易于使用,可让您轻松定义和可视化每笔交易的风险,从而做出明智的决策并优化您的交易策略。有关OrderManager的更多信息,请参阅手册。 [ 手册 ] [ MT5版本 ] [ Telegram 频道 ] 主要功能: 风险管理:快速轻松地定义您交易的风险,让您做出更好的决策并提高交易性能。 视觉表示:图形化地查看您的交易和相关风险,以清晰简洁地了解您的开放头寸。 订单修改:只需几次点击即可轻松修改或关闭您的订单,简化您的交易过程,为您节省宝贵的时间。 掌握新闻:一键获取最新市场新闻。 不要错过这个MT4交易员的必备工具。用Order Manager提升您的交易体验,将您的交易游戏提升到新的水平。 OrderManager在startegyTester中 不 工作! OrderManager 仅与 Windows 兼容。 请考虑给这个产品一个5星级评价。您的优秀反馈将激励作者加快更新
FTMO Sniper 4
Vyacheslav Izvarin
Dedicated for FTMO and other Prop Firms Challenges 2020-2023 Trade only GOOD and checked PROP FIRMS  Default parameters for Challenge $100,000 Best results on GOLD and US100  Use any Time Frame Close all deals and Auto-trading  before  US HIGH NEWS, reopen 2 minutes after Close all deals and Auto-trading  before Weekend at 12:00 GMT+3  Friday Recommended time to trade 09:00-21:00 GMT+3 For Prop Firms MUST use special Protector  https://www.mql5.com/en/market/product/94887 -------------------
Trade Dashboard MT4
Fatemeh Ameri
5 (20)
Tired of complex order placement and manual calculations? Trade Dashboard is your solution. With its user-friendly interface, placing orders becomes effortless, by a single click, you can open trades, set stop loss and take profit levels, manage trade lot size, and calculate risk to reward ratios, allowing you to only focus on your strategy. Say goodbye to manual calculations and streamline your trading experience with Trade Dashboard. Download   demo version  right now. You can find details
KT Equity Protector MT4
KEENBASE SOFTWARE SOLUTIONS
3 (2)
KT Equity Protector EA consistently monitors the account equity and closes all the market and pending orders once the account equity reached a fixed equity stop loss or profit target.  After closing all trading positions, the EA can close all open charts to stop other expert advisors from opening more trading positions. Equity Stop-Loss If your current account balance is $5000 and you set an equity stop loss at $500. In this case, the KT Equity Protector will close all the active and pending
The News Filter
Leolouiski Gan
5 (17)
这个产品在新闻时间过滤所有的专家顾问和手动图表,因此您不必担心突然的价格波动会破坏您的手动交易设置或其他专家顾问输入的交易。此产品还带有完整的订单管理系统,可在任何新闻发布前处理您的持仓和挂单。一旦您购买了 The News Filter ,您将不再需要依赖以后的专家顾问内置的新闻过滤器,因为这个产品可以从此过滤它们所有。 新闻选择 新闻来源于Forex Factory的经济日历。 选择可以基于任何一种货币,如USD,EUR,GBP,JPY,AUD,CAD,CHF,NZD和CNY等。 选择也可以基于关键识别,例如Non-Farm (NFP),FOMC,CPI等。 能够选择新闻影响级别的筛选,从低、中、到高影响。 自动模式只选择与图表相关的新闻。 新闻来源每小时自动刷新,以确保最新的新闻数据。 为每个新闻影响级别提供单独的输入,以确定您要过滤掉的新闻发布前后的分钟数。 订单管理选项 在新闻发布前关闭未平仓头寸的选项,并在新闻发布后恢复它们。 在新闻发布前删除挂单的选项,并在新闻发布后恢复它们。 在新闻发布前移除止损和止盈水平的选项,并在新闻发布后恢复它们。 在新闻发布前移动止损
Ultimate Trailing Stop EA
BLAKE STEVEN RODGER
4.33 (15)
This EA Utility allows you to manage (with advanced filtering) unlimited open orders (manual or EA) with 16 trailing stop methods: fixed, percent, ATR Exit, Chandelier Exit, Moving Average, Candle High Low Exit, Bollinger Bands, Parabolic, Envelope, Fractal, Ichimoku Kijun-Sen, Alligator, Exit After X Minutes or Bars, RSI and Stochastic. The trailing stop can be either real or virtual, and you can exit fully or with a partial close percent on touch or bar close.  Moreover, you can add (overr
Trade Copier Agent 旨在复制多个 MetaTrader(4/5) 账户/终端之间的交易。 使用此工具,您可以充当提供者(源)或接收者(目的地)。所有交易行为都将立即从提供者复制到接收者。 该工具允许您在同一台计算机上的多个 MetaTrader 终端之间复制交易,复制速度快如闪电,不到 0.5 秒。 贸易复印机代理安装和输入指南 请在开始复制之前或没有订单时在提供商帐户上应用设置! 有订单时的任何更改都会影响收款人帐户。 例如:如果提供者账户应用买单然后禁用接收者账户上的所有买单将被关闭。 如果您想获得有关 EA 添加 URL (   http://autofxhub.com   ) MT4 终端的通知(请参阅屏幕截图)。 MT5版本 https://www.mql5.com/en/market/product/77134 以下是亮点功能: 在 MT4 和 MT5 账户之间复制。 在一个工具内切换提供者或接收者。 每个账户既可以作为Provider又可以作为Receiver,因此账户之间可以通过2种传输方式相互复制。这就像一个贸易共享网络。 一个提供者可以将
DrawDown Limiter MT4
Haidar, Lionel Haj Ali
5 (9)
Drawdown Limiter EA You are in the right place if you were searching for Drawdown control, Drawdown limiter, Balance protection, Equity Protection or Daily Drawdown Limit related to Prop Firm, FTMO, or Funded account trading, or if you want to protect your trading account. Have you suffered from controlling your drawdown when trading funded accounts? This EA is meant for you. Prop firms usually set a rule called “Trader Daily Drawdown”, and if it is not respected, you are disqualified.  I am an
The top-selling EAs on the market cost a lot and one day they are suddenly gone. This is because one strategy will not work in the forex market all the time. Our product is unique from all others in the MQL Marketplace because our EA comes with 34+ built-in indicators that allow adding more strategies every time.  You build your strategy and keep updating it. If one strategy does not work, simply build another all using only one EA. This is All-In-One EA in this market place. You can use as trad
Mentfx Mmanage
Anton Jere Calmes
5 (16)
The added video will show you the full functionality, effectiveness, and simplicity of this trade manager. Drag and Drop Trade Manager. Draw your entry and have the tool calculate the rest. Advanced targeting and close portions of a trade directly available in tool (manage trades while you sleep). Market order or limit order on either side with factored spread. Just draw the entry, the tool does the rest. Hotkey setup to make it simple. Draw where you want to enter, and the stop loss, the tool c
Take a Break
Eric Emmrich
5 (27)
The most advanced news filter and drawdown limiter on MQL market NEW: Take a Break can be backtested against your account history! Check the " What's new " tab for details. Take a Break has evolved from a once simple news filter to a full-fledged account protection tool. It pauses any other EA during potentially unfavorable market conditions and will continue trading when the noise is over. Typical use cases: Stop trading during news/high volatility (+ close my trades before). Stop trading when
The Expert Advisor will help you forward all pop-up alert with screenshot from  MetaTrader 4 to Telegram channel/ group, also forward all notifications to Telegram. Parameters  -  Telegram Bot Token - create bot on Telegram and get token.  -  Telegram Chat ID  - input your Telegram user ID,  group / channel ID  -  Forward Alert - default true, to forward alert.  -  Send message as caption of Screenshot - default false, set true to send message below Screenshot  How to setup and guide  - Telegram
Trade Assistant GS
Vasiliy Strukov
5 (33)
交易面板僅限於管理訂單 - 使用按鈕打開和由用戶打開。 收藏中簡單方便。 將補充任何買家。 我建議將它與 Gold Stuff 指標一起使用。 將交易設置為單個訂單並構建有距離的網格。 要創建標準網格,只需設置一個較大的距離,例如 10000。 可以在此處查看實時結果。 購買後立即聯繫我以獲得設置和個人獎勵!   設置 打開新系列 - 打開/關閉新系列訂單的開始。 Lot miltiplier - 以下訂單的手數乘數。 TP - 獲利,以點為單位。 SL - 止損,以第一個訂單的點數為單位。 Trail Start - 激活追踪止損。 Trail Step - 激活追踪止損時與價格的距離。 DD Reduction Algoritm - 回撤減少算法,當最後一個有利潤的訂單將與第一個有虧損的訂單系列關閉時。 Number order for DD Reduction Algoritm - 減少回撤算法被激活的順序。 DD 減少算法的利潤百分比 - 在回撤減少模式下關閉訂單時的利潤百分比。 Magic - 是 EA 分配給其訂單的特殊編號。 Fix distance -
将信号从您所属的任何渠道(包括私人和受限渠道)直接复制到您的 MT4。 该工具在设计时充分考虑了用户的需求,同时提供了管理和监控交易所需的许多功能。 该产品采用易于使用且具有视觉吸引力的图形界面。 自定义您的设置并在几分钟内开始使用该产品! 用户指南 + 演示  |     MT5版本  |     不和谐版本 如果您想尝试演示,请参阅用户指南。 Telegram To MT4 接收器在策略测试器中不起作用! Telegram 至 MT4 功能 一次复制多个通道的信号 从私人和受限频道复制信号 不需要机器人令牌或聊天 ID(如果出于某种原因需要,您仍然可以使用这些) 使用风险百分比或固定手数进行交易 排除特定符号 选择复制所有信号或自定义要复制的信号 配置单词和短语以识别所有信号(默认值应适用于 99% 的信号提供商) 配置时间和日期设置以仅在需要时复制信号 设置一次打开的最大交易量 交易和头寸管理 使用信号或自动设置的管理 通过设置每月、每周、每天、每小时或每分钟的最大交易次数,停止过度交易和报复性交易。 支持市价订单和挂单 每日最大利润目标(以美元为单位)以确保头寸并停止
Custom Ultimate Sniper Dashboard
Hispraise Chinedum Abraham
5 (2)
这个自定义终极狙击手仪表盘是原始终极狙击手仪表盘指标的一个EA升级。它与多达98种不同的算法一起工作,以确保它能捕捉到你工作的资产类别上的趋势的真实性质。 它是对我们几个月来从大多数客户那里得到的很多建议和意见的直接回应。   这个自定义版本是完全可定制的。 由98个独立的自定义算法提供。 非常漂亮的视觉界面,因此你可以轻松和自信地跟踪任何货币对或时间框架的整体市场趋势 可以向telegram发送实时警报 允许你根据你所交易的货币对创建自己的指数 可以向你的手机实时发送警报,所以你不必在电脑前就知道有一个动作正在酝酿。 让你从输入设置中设置8个指数 让你设置你想获得警报的指数和时间框架 当检测到没有互联网连接时,会显示警报   自定义终极狙击手仪表盘已经进行了大量的优化,在动作开始后立即显示。这样,你就不会错过你感兴趣的货币对的任何变动。它的速度非常快,可以在移动发生时迅速捕捉到,并实时向你发送警报,这样你就可以利用移动的优势,而不必整天坐在办公桌前。 它是任何交易策略的一个超级补充,你可以将这个工具与任何其他交易策略和指标一起使用。它主要是为了与我们的其他
作者的更多信息
Multi Chart Crosshairs MT5
Robert Gerald Wood
5 (7)
该指标旨在使对不同时间尺度上的许多图表的审查更快、更容易。 跨多个图表跟踪时间和价格 在一个图表上更改代码,同一代码的所有其他图表也将更改。 易于使用,快速掌握 该指标允许您识别鼠标指针在当前图表上的价格和时间,以及在同一交易品种上打开的所有其他图表。这使您可以快速查看多个图表上的信息,而通常您必须花一些时间来识别同一位置。 您还可以选择在所有打开的图表中只跟踪时间。这使您可以在寻找分歧时轻松导航。 如果您更改一个图表中的符号,则同一符号的所有其他图表将切换到新符号,并保持其时间范围设置。 如何使用 在查看图表时,我喜欢查看多个时间范围以确定趋势和交易水平。我创建了这个工具来帮助解决这个问题,也用于视觉回溯测试,我在其中查看了很长一段时间内的多个图表。 该工具会在屏幕上添加一个跟随鼠标指针的十字准线。当按下 CTRL 或 SHIFT 键时,它会被激活,因此它并不总是存在,而是在您需要时存在。 激活后,您可以在任何图表上指向您要跟踪的位置,在具有相同符号的任何其他图表上,十字准线也会在该图表上显示相同的时间和价格。其他窗口中的图表将自动滚动显示,以便时间/价格组合成为显示的中心。 您可
TheStrat Levels MT5
Robert Gerald Wood
5 (1)
This indicator draws the prior Highs and Lows for multiple timeframes, and can display potential Take Profit and Stop Loss levels. In Rob Smith's # The Strat  terms, these are potential entry points, or alternatively potential targets for open positions. I like to use them in both ways. On a lower timeframe, say 5 minutes to get a good entry on a daily or weekly level, and then as a potential target. Very small stops required giving an excellent risk/reward ratio. Key Features  - Levels from Ho
TheStrat TFC Monitor MT5
Robert Gerald Wood
5 (1)
使用 The Strat 进行交易时,关注多个时间范围很重要。 该指标将显示每个时间范围内当前蜡烛的每日、每周、每月和每季度状态。 圆圈图标表示该时间范围内的蜡烛目前是内部蜡烛,或 TheStrat 术语中的类型 1。 Inside Day 蜡烛正在巩固价格走势,我们正在寻找该范围的突破。 指向上或下的三角形图标是趋势蜡烛,或 TheStrat 术语中的类型 2。趋势蜡烛可以是看涨或看跌,表明它已经突破了之前的蜡烛范围,现在正朝着一个方向发展。 方形图标是外部蜡烛,或 Strat 术语中的类型 3。这表明两件事,一是价格在该时间范围内的方向未定,可能相当波动,二是在较短的时间范围内,可能有很好的交易空头反转机会。该正方形将是看涨或看跌的颜色,以显示当前获胜的一方。 每个图标使用的颜色都可以根据您的喜好进行配置,文本和图标的大小也是可配置的。 设置 时间范围选择 每小时显示 当为 True 时,显示每小时蜡烛状态。 每日秀 当为 True 时,显示每日蜡烛状态。 每周秀 当为 True 时,显示每周蜡烛状态。 每月显示 当为 True 时,显示每月蜡烛状态。 季刊 当为 True 时
TheStrat Candles MT5
Robert Gerald Wood
This indicator will draw a label above or below each candle based on   Rob Smith's   The Strat   as they develop over time on your chart. As price evolves, a candle can switch between three states. When the candle first opens, if it sits completely within the previous candles high and low, then it will start as a Type 1. As time moves on, if it breaks either the high or low of the previous candle, it will be come a type 2, and should the price action be volatile and directionless, it may then
TheStrat Monitor
Robert Gerald Wood
3 (2)
If you've not already learnt about The Strat trading strategy , go google it now. I promise it won't be a waste of your time, and you will likely learn some new tricks whether you use it or not. OK, so now you know what TheStrat is, you will be able to understand what this indicator can do for you. Key Features In short, the Indicator will: Show Timeframe Continuity for all supported timeframes Supports two timeset views, Day trader and Swing trader Show when Full Timeframe Continuity is in pl
Multi Chart Crosshairs
Robert Gerald Wood
5 (2)
This indicator is designed to make reviews of many charts on different timescales quicker, and easier to do. Track Time and Price across multiple charts Change Symbol on one chart and all other charts of the same symbol will be changed too. Easy to use, quick to master The indicator allows you to identify the price and time where the mouse pointer is on the current chart, across all other charts open on the same Symbol. This allows you to quickly see information on multiple charts whereas normal
TheStrat Levels
Robert Gerald Wood
This indicator draws the prior Highs and Lows for multiple timeframes, and can display potential Take Profit and Stop Loss levels. In Rob Smith's # The Strat   terms,   these are potential entry points, or alternatively potential targets for open positions. I like to use them in both ways. On a lower timeframe, say 5 minutes to get a good entry on a daily or weekly level, and then as a potential target. Very small stops required giving an excellent risk/reward ratio. Please watch the DEMO video
TheStrat Candles
Robert Gerald Wood
4.5 (2)
该指标将根据每个蜡烛的上方或下方绘制一个标签   罗伯·史密斯     斯特拉特   随着它们在您的图表上随着时间的推移而发展。 随着价格的变化,蜡烛可以在三种状态之间切换。当蜡烛第一次打开时,如果它完全位于前一根蜡烛的高点和低点内,那么它将以类型 1 开始。随着时间的推移,如果它突破了前一根蜡烛的高点或低点,它将成为类型 1类型 2,如果价格走势波动且无方向,则它可能会突破前一根蜡烛的相反侧,成为类型 3。 蜡烛 每根蜡烛都由其与前一根蜡烛的关系定义。 类型 1 - 内部蜡烛 - 蜡烛完全位于前一根蜡烛的高点和低点之内。内部蜡烛表明市场处于犹豫不决的时刻。 类型 2 - 趋势蜡烛 - 蜡烛在前一根蜡烛的高点或低点上方或下方延伸,但不会同时延伸到两者之上或下方。 类型 3 - 外部蜡烛 - 蜡烛已突破前一根蜡烛的高点和低点。外部蜡烛显示价格正在扩大,在较短的时间范围内产生更高的高点和更低的低点。 设置 显示内部 如果为真,则显示内部蜡烛的蜡烛编号。 显示趋势 如果为真,则显示趋势蜡烛的蜡烛编号。我经常将此设置保留为 false(默认值),因为我发现它会
TheStrat Patterns
Robert Gerald Wood
This indicator will draw patterns based on Rob Smith's The Strat as they emerge in real time on your chart. As price evolves, TheStrat offers 18 distinct price action patterns that can help you get good entries in the market. Each pattern involves two or three candles, and this indicator will draw a bounding box around the candles and name the pattern. The indicator also shows when a potential setup is forming, known by stratters as an Actionable signal. Candles Each candle is defined by i
A simple script that can delete all the drawing objects on a chart, or just the objects of a specific type. Settings: DeleteObjectsOfType By default the value will be blank which means ALL drawing objects on the chart will be deleted. If you only wish to delete specific types of drawing object, change this setting to the type of object to delete. For example, Fibonacci Retracement, Text, Label or Trend Line. Please see the demonstration video for more information.
FREE
我在学习 Rob Smith 的 TheStrat 时创建了这个简单的指标,发现它非常有用,我想与您分享。如果您觉得它有用,请查看我在 MQL5 上发布的其他指标。 该指标只是在图表上绘制一条线,显示您从较高时间范围内选择的价格水平。 使用设置,您可以完全控制它显示的时间范围,但默认 情况下,它会自己计算更高的时间范围,只是将刻度向上移动一级。例如,如果您打开 H1 图表,它将显示 H4 图表中的数据。 设置 跟踪时间表 选择绘制价格水平的时间范围。如果您将其保留为当前的默认设置,它将为您选择合适的时间范围。如果您正在查看图表并在时间范围之间进行更改,这将非常有用,因为该线将始终向上调整。 跟踪值 您可以从以下标准价格值中选择一个。默认为开盘价。 PRICE_CLOSE 收盘价 PRICE_OPEN 开盘价 PRICE_HIGH 期间最高价 价格_低 期间最低价 PRICE_MEDIAN 中位数价格,(高 + 低)/2 PRICE_TYPICAL 典型价格,(最高价+最低价+收盘价)/3 PRICE_WEIGHTED 加权收盘价,(最高价+最低价+收盘价+收盘价)/4
FREE
This script allows you to toggle the "Show Trade Levels" option, but for the current chart only. Normally, you can only change the setting using the Options -> Chart menu for ALL charts, but this script allows you to do it for a SINGLE chart. I'm using it when I take screenshots, because most of the time I'm not trying to show the trades, just some functionality of one of my other tools. Iif you need that functionality, then this script is very helpful! If the script helps you, please let me
FREE
TheStrat FTFC
Robert Gerald Wood
FTFC 指的是 Rob Smith 的 The Strat 定义的全时间框架连续性。 该指标在图表上绘制两条线,一条是季度、每月、每周、每日或每小时开盘水平的最高水平,第二条是这些值中最低的水平。这为您提供了一个高于或低于该通道的交易更有可能在一个方向上非常强劲。言外之意,价格走势将更加波动,您可以使用更宽的止损。 还绘制了第三条虚线以显示高点和低点之间的中点。当市场试图将价格推向某个方向时,这通常是寻找支撑或阻力的好地方。如果您通过将颜色设置为无来选择,则可以关闭此行。 设置 包括季度级别 允许您选择在计算中包括季度开盘价,因为有些人喜欢忽略它。 IncludeCurrentTimeframe打开 为真时,如果当前显示的时间范围是 H1、D1、W1 或 MN1,指标将在其计算中包括开放的时段。这是最新版本指标中的新设置。以前,计算不包括当前打开的时间段,这与 TheStrat 不一致。 该设置默认为 false,因此现有用户不受影响,除非他们选择打开它。 MaxMilliSecondsToCalculate 对于加载了大量历史记录(超过 10,000 条柱)的图表,这将限制指标
Round Price Levels
Robert Gerald Wood
市场真的很喜欢整数,它们通常在下跌的市场中充当支撑,或在价格上涨时充当阻力。 该指标旨在以整数值绘制价格水平。它会自动执行此操作,但您也可以选择覆盖它并确定您希望看到的级别。 一轮水平可以像 10 步一样简单,例如 10、20、30 等,或者如果您从事外汇交易,您可能希望看到 0.1 或 0.01 的变化。 该指标绘制两类线,Major 和 Minor,每类都有不同的格式。这使您可以同时查看两个不同电平变化之间的变化。 警报 该指标包括当价格在可配置距离内时在主要、次要或两个价格水平发出警报的能力。 自动设置 默认情况下,该指标将为主要价格和次要价格确定适当的水平。它使用可配置的 DensityIndex 设置来做到这一点,该设置控制您希望随时在屏幕上看到多少行。 如果您设置自己的缩放比例,使用 MajorGap 和 MinorGap 设置,您仍然可以通过使用 ReduceAtScale 设置来获得限制在屏幕上绘制的线数的指标。 请查看屏幕截图以更清楚地了解此功能。 设置 基本配置 重大差距 当设置为 0.0 时,指标会自动计算出合适的刻度 小间隙 当设置为 0.0 时,
TheStrat TFC Monitor
Robert Gerald Wood
使用 The Strat 进行交易时,关注多个时间范围很重要。 该指标将显示每个时间范围内当前蜡烛的每日、每周、每月和每季度状态。 圆圈图标表示该时间范围内的蜡烛目前是内部蜡烛,或 TheStrat 术语中的类型 1。 Inside Day 蜡烛正在巩固价格走势,我们正在寻找该范围的突破。 指向上或下的三角形图标是趋势蜡烛,或 TheStrat 术语中的类型 2。趋势蜡烛可以是看涨或看跌,表明它已经突破了之前的蜡烛范围,现在正朝着一个方向发展。 方形图标是外部蜡烛,或 Strat 术语中的类型 3。这表明两件事,一是价格在该时间范围内的方向未定,并且可能相当震荡,二是在较短的时间范围内,可能存在交易空头反转的好机会。该正方形将是看涨或看跌的颜色,以显示当前获胜的一方。 每个图标使用的颜色都可以根据您的喜好进行配置,文本和图标的大小也是可配置的。 设置 时间范围选择 每小时显示 当为 True 时,显示每小时蜡烛状态。 每日秀 当为 True 时,显示每日蜡烛状态。 每周秀 当为 True 时,显示每周蜡烛状态。 每月显示 当为 True 时,显示每月蜡烛状态。 季刊 当为 Tr
Active Pivot Levels
Robert Gerald Wood
5 (1)
枢轴水平是每个市场都认可的完善的技术水平。 该指标将在图表上为任何符号绘制当前的季度、月度、周度、日度和四小时支点。您还可以显示每个时期的支撑和阻力水平,并选择从水平 1 到 4 显示哪个水平。     从以下选项中选择枢轴类型: 标准 卡马里拉 丹麦 伍迪 斐波那契数列 请注意,根据原始规格,DeMark 枢轴具有单一的支撑位和阻力位。 如果线已被价格触及,指标墙会改变绘制线的方式。这可能非常有帮助,一旦触及,支撑线或阻力线的强度就会大大降低。 您可以选择显示每个时间段的预测枢轴水平。这将使用与正常枢轴相同的计算,但将适用于当前不完整的时间范围。因此,最好在那个时期结束时使用它,此时价格已经涵盖了其范围的大部分。 设置 所有设置的详细信息都在单独的博客文章中,可在此处获取: https://www.mql5.com/en/blogs/post/746511 这是一个高度可配置的指标,因此您可以按照自己的喜好让它工作。
ATR Extremes
Robert Gerald Wood
平均真实范围 (ATR) 是一种常用指标,用于衡量在设定的持续时间内价格的变动量。然而,它给出的价值并没有在任何类型的边界内定义,这使得将其用于止损或止盈计算以外的任何事情几乎是不可能的。 该指标是您的标准 ATR 指标,但我们引入了百分位分界,以便您可以看到极端情况。 您可以在百分位数和我们称之为分割中位数的东西之间进行选择 百分位水平 百分位水平绘制为 1%、5%、20%、50%、80%、95%、99%,这些显示价格与所有其他值的关系。例如,5% 水平表示在该线以下,只有 5% 的 ATR 读数变得如此低,而 99% 表示在该水平之上的 ATR 值中,只有 1% 的值变得如此高。 高于 80%,您可能会选择开始降低任何新交易的头寸规模,而高于 95% 可能是在动量改变之前获利的好时机。 分割中位数 分割中值设置是一个更简单的版本,只绘制了 4 个级别,极端、较高、中值和较低。这些级别的工作方式与百分位数完全相同,但更加清晰。这就是指标的原始版本的工作方式,直到我变得更加熟练并将其更改为百分比。 ATR 移动平均线 该指标还显示 ATR 值的移动
Range Exhaustion
Robert Gerald Wood
当价格达到或超过当前期间的预期范围时,范围耗尽就会发生。在这些水平上,价格开始失去相对于该时期早些时候的动力,因此最好确保您没有建立新头寸。 该指标将向您显示图表上可能发生这种情况的位置,显示每日、每周和每月的水平。 当您看到价格超过这些耗尽水平时,它告诉您移动背后的势头非常强劲,并且可能会走向更高的时间框架水平。 该指标可以使用平均真实范围 (ATR) 或平均范围 (ADR) 计算,具体取决于您的偏好。默认情况下,我们使用 ATR,因为我们发现它在外汇图表上效果更好,但 ADR 在基于股票的指数和符号上确实具有优势。 该指标有多种绘图模式,如下所述,您可以根据自己的需要对其进行定制。 设置 计算模式 选择 AverageTrueRange (ATR) 或 AverageDailyRange (ADR) 来计算水平。 绘图模式 该指标可以以不同的方式显示。 - 绘制价格调整线 - 水平根据达到的高点和低点在整个时期内调整。这是默认且最常用的方法。 - Draw Expected Maximum   - 该水平是一个固定值,是最后一个收盘价加上或减去 ATR 或 ADR 值。 -
TheStrat FTFC MT5
Robert Gerald Wood
FTFC 指的是 Rob Smith 的 The Strat 定义的全时间框架连续性。 该指标在图表上绘制两条线,一条是季度、每月、每周、每日或每小时开盘水平的最高水平,第二条是这些值中最低的水平。这为您提供了一个高于或低于该通道的交易更有可能在一个方向上非常强劲。言外之意,价格走势将更加波动,您可以使用更宽的止损。 还绘制了第三条虚线以显示高点和低点之间的中点。当市场试图将价格推向某个方向时,这通常是寻找支撑或阻力的好地方。如果您通过将颜色设置为无来选择,则可以关闭此行。 设置 包括季度级别 允许您选择在计算中包括季度开盘价,因为有些人喜欢忽略它。 IncludeCurrentTimeframe打开 为真时,如果当前显示的时间范围是 H1、D1、W1 或 MN1,指标将在其计算中包括开放的时段。这是最新版本指标中的新设置。以前,计算不包括当前打开的时间段,这与 TheStrat 不一致。 该设置默认为 false,因此现有用户不受影响,除非他们选择打开它。 MaxMilliSecondsToCalculate 对于加载了大量历史记录(超过 10,000 条柱)的图表,这将限制指
TheStrat Patterns MT5
Robert Gerald Wood
This indicator will draw patterns based on   Rob Smith's   The Strat   as they emerge in real time on your chart. As price evolves,   TheStrat   offers 18 distinct price action patterns that can help you get good entries in the market. Each pattern involves two or three candles, and this indicator will draw a bounding box around the candles and name the pattern. The indicator also shows when a potential setup is forming, known by stratters as an Actionable signal. Candles Each candle is de
TheStrat Monitor MT5
Robert Gerald Wood
5 (1)
如果您还没有了解 Strat 交易策略 ,现在就去谷歌搜索吧。我保证这不会浪费您的时间,而且无论您是否使用它,您都可能会学到一些新技巧。 好的,现在您知道 TheStrat 是什么,您将能够理解该指标可以为您做什么。 主要特征 简而言之,该指标将: 显示所有支持的时间范围的时间范围连续性 支持两种时间视图,即日交易者和波段交易者 显示任何 4 个连续时间帧的全时间帧连续性何时到位 显示每个时间范围的当前蜡烛状态 显示所有时间范围内的当前形态(如果有) 显示有效和可操作模式 每 5 秒更新一次(可从 1 秒开始配置) 允许您单击面板以在选定的交易品种和时间范围内打开图表 您可以选择用于打开图表的图表模板 您选择要显示的组和这些组中的符号 该指标显示您经纪商支持的任何交易品种的所有关键 Strat 元素、时间框架连续性、当前模式和当前蜡烛状态的快照概览。它针对所有受支持的时间范围执行此操作,因此您可以准确地看到市场上正在发生的事情。 您可以根据需要对符号进行分组,并选择与每个组相关的按钮的标题。同时在屏幕上显示特定类型的所有符号可以让您发现整个组的相似之处,从而有助于您的分析。 有关配
枢轴水平是每个市场都认可的完善的技术水平。 该指标将在图表上为任何符号绘制当前的季度、月度、周度、日度和四小时支点。您还可以显示每个时期的支撑和阻力水平,并选择从水平 1 到 4 显示哪个水平。     从以下选项中选择枢轴类型: 标准 卡马里拉 丹麦 伍迪 斐波那契数列 请注意,根据原始规格,DeMark 枢轴具有单一的支撑位和阻力位。 如果线已被价格触及,指标墙会改变绘制线的方式。这可能非常有帮助,一旦触及,支撑线或阻力线的强度就会大大降低。 您可以选择显示每个时间段的预测枢轴水平。这将使用与正常枢轴相同的计算,但将适用于当前不完整的时间范围。因此,最好在那个时期结束时使用它,此时价格已经涵盖了其范围的大部分。 设置 所有设置的详细信息都在单独的博客文章中,可在此处获取: https://www.mql5.com/en/blogs/post/746511 这是一个高度可配置的指标,因此您可以按照自己的喜好让它工作。
Round Price Levels MT5
Robert Gerald Wood
市场真的很喜欢整数,它们通常在下跌的市场中充当支撑,或在价格上涨时充当阻力。 该指标旨在以整数值绘制价格水平。它会自动执行此操作,但您也可以选择覆盖它并确定您希望看到的级别。 一轮水平可以像 10 步一样简单,例如 10、20、30 等,或者如果您从事外汇交易,您可能希望看到 0.1 或 0.01 的变化。 该指标绘制两类线,Major 和 Minor,每类都有不同的格式。这使您可以同时查看两个不同电平变化之间的变化。 警报 该指标包括当价格在可配置距离内时在主要、次要或两个价格水平发出警报的能力。 自动设置 默认情况下,该指标将为主要价格和次要价格确定适当的水平。它使用可配置的 DensityIndex 设置来做到这一点,该设置控制您希望随时在屏幕上看到多少行。 如果您设置自己的缩放比例,使用 MajorGap 和 MinorGap 设置,您仍然可以通过使用 ReduceAtScale 设置来获得限制在屏幕上绘制的线数的指标。 请查看屏幕截图以更清楚地了解此功能。 设置 基本配置 重大差距 当设置为 0.0 时,指标会自动计算出合适的刻度 小间隙 当设置为 0.0 时,指标会自
ATR Extremes MT5
Robert Gerald Wood
平均真实范围 (ATR) 是一种常用指标,用于衡量价格在设定期限内的变动量。然而,它给出的值没有在任何类型的边界内定义,这使得除了止损或止盈计算之外,几乎不可能将其用于任何其他用途。 该指标是您的标准 ATR 指标,但我们引入了百分位分界,因此您可以看到极端情况。 您可以在百分位数和我们称之为分裂中位数的东西之间进行选择 百分位水平 百分位水平绘制为 1%、5%、20%、50%、80%、95%、99%,这些显示价格与所有其他值的关系。例如,5% 水平表示在该线以下,只有 5% 的 ATR 读数达到那么低,而 99% 表示在该水平之上的 ATR 值中,只有 1% 的值达到那么高。 高于 80%,您可能会选择开始降低任何新交易的头寸规模,高于 95% 可能是在势头改变之前获利了结的好时机。 拆分中位数 Split Medians 设置是一个更简单的版本,只绘制了 4 个级别,Extreme、Higher、Median 和 Lower。这些级别的工作方式与百分位数完全相同,但更清晰一些。这就是指标原始版本的工作方式,直到我变得更加熟练并将其更改为百分位数。 ATR移动平均线 该指标还显示 A
Range Exhaustion MT5
Robert Gerald Wood
当价格达到或超过当前期间的预期范围时,范围耗尽就会发生。在这些水平上,价格开始失去相对于该时期早些时候的动力,因此最好确保您没有建立新头寸。 该指标将向您显示图表上可能发生这种情况的位置,显示每日、每周和每月的水平。 当您看到价格超过这些耗尽水平时,它告诉您移动背后的势头非常强劲,并且可能会走向更高的时间框架水平。 该指标可以使用平均真实范围 (ATR) 或平均范围 (ADR) 计算,具体取决于您的偏好。默认情况下,我们使用 ATR,因为我们发现它在外汇图表上效果更好,但 ADR 在基于股票的指数和符号上确实具有优势。 该指标有多种绘图模式,如下所述,您可以根据自己的需要对其进行定制。 设置 计算模式 选择 AverageTrueRange (ATR) 或 AverageDailyRange (ADR) 来计算水平。 绘图模式 该指标可以以不同的方式显示。 - 绘制价格调整线     - 水平根据达到的高点和低点在整个时期内进行调整。这是默认且最常用的方法。 - 绘制预期最大值     - 水平是一个固定值,是最后一个收盘价加上或减去 ATR 或 ADR 值。 - 绘制两条线  
筛选:
Christian Astillero
1203
Christian Astillero 2022.03.08 14:52 
 

Perfect

Robert Gerald Wood
4238
来自开发人员的回复 Robert Gerald Wood 2022.04.01 12:01
Thank You!
CasiousD
784
CasiousD 2021.10.30 19:39 
 

2nd indicator I have from this author. Took some getting used to understanding how it interacts with other indicators already on the chart, but once I figured it out (I can be slow sometimes), works perfectly. As with the other indicator I have from this author (Multi Chart Crosshairs), this is going to make my market analysis so much easier! Thank you again!

Payman
662
Payman 2021.04.16 15:05 
 

its really cool because its the only copier that also copies the objects description i found. i wish i could exclude certain objects like buttons and labels. but anyways its already awesome. thanks

Robert Gerald Wood
4238
来自开发人员的回复 Robert Gerald Wood 2021.04.16 15:08
Hello again Payman, you're now my biggest fan :)
Being able to exclude object of a type is a good idea, definitely adding that to the to-do list for the next version. Thank you!
tr4ppist
97
tr4ppist 2021.04.15 17:41 
 

BEST cloner ever tried, and i have tried a lot of cloners. This clones ALL, perfectly. Download this and don't waste your time on others

Robert Gerald Wood
4238
来自开发人员的回复 Robert Gerald Wood 2021.04.15 17:43
Thats really kind of you. Thanks for taking the time to leave a review, I appreciate it :).
回复评论
版本 1.2 2022.11.13
Added option to copy Indicator window objects as well as those in the main chart window. Rely's on the second chart already having the Indicators attached, and in the same order as the source chart.

New Option: CopyIndicatorWindowObjects (true/false)

By default the option is set to false, so it will not affect existing users unless they take action and set the option to true.
版本 1.1 2021.04.15
Fixed bug where the text for the first fibo level was not cloned correctly.