• 概述
  • 评论
  • 评论

Anchored VWAP with no Volume

Anchored VWAP (with no Volume)

A unique development of one of the most useful VWAP indicators. This product allows you to get away from using the basics of VWAP, namely the volume. Everything is calculated without it. In addition, a convenient system for selecting starting points has been developed - by moving the "starting field" you indicate to the script the area, in which the extremum, from which the calculation will start, should be searched for.

The main advantages of this development:

  • convenient system for selecting the starting point of VWAP calculation with a movable rectangular zone moved with the mouse
  • VWAP can now be used in markets where no volume data is available - FOREX, Crypto
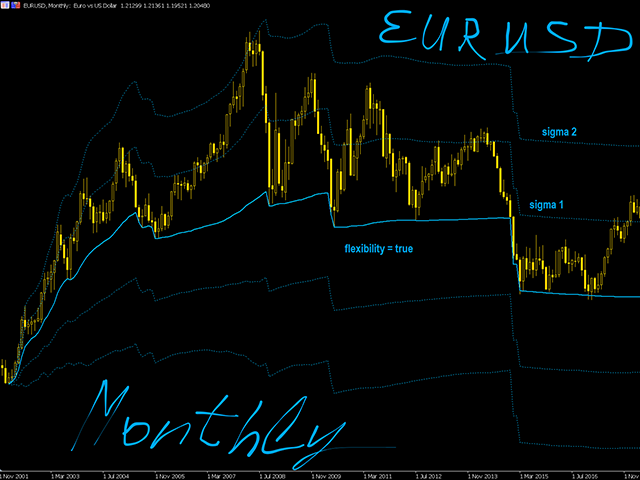
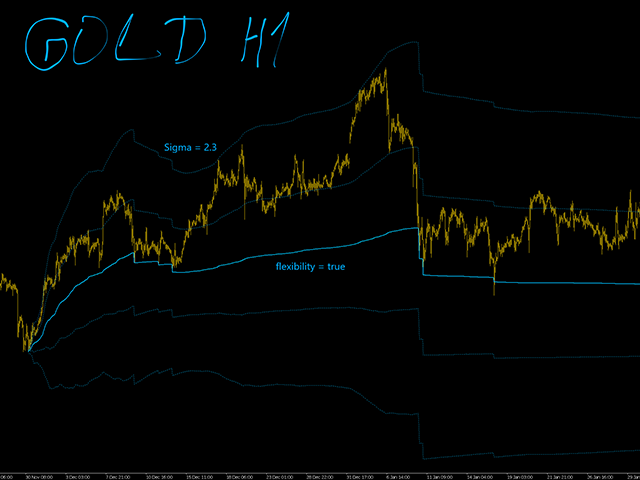
  • availability of adjustable standard deviation zones. You want 1.79 instead of sigma 2 - you can do it
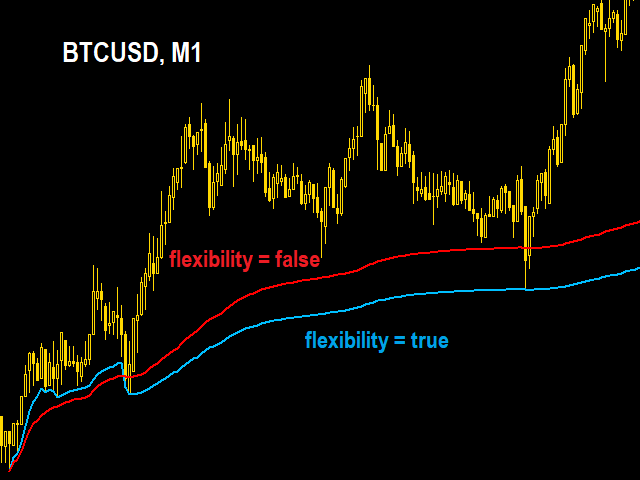
  • A completely unique modification of VWAP is the "Flexibility" parameter. Check it out in the screenshots
  • calculation from extremes, which makes VWAP as accurate as possible

The input parameters of the product are elementary.

  • indicator number. If you want to put several VWAPs on the chart, each one must have its own number.
  • color selection
  • control field dimensions
  • the prices that will participate in the calculation. There are both standard median and extremes, which I recommend to pay special attention to
  • Enable the "Flexibility" parameter
  • Enable/disable calculation using volume
  • Enable/disable sigma display and manually adjust their values

推荐产品
BoxChart MT5
Evgeny Shevtsov
5 (7)
The market is unfair if only because 10% of participants manage 90% of funds. An ordinary trader has slim changes to stand against these "vultures". This problem can be solved. You just need to be among these 10%, learn to predict their intentions and move with them. Volume is the only preemptive factor that faultlessly works on any timeframe and symbol. First, the volume appears and is accumulated, and only then the price moves. The price moves from one volume to another. Areas of volume accumu
Blahtech Market Profile MT5
Blahtech Limited
5 (8)
Was: $249  Now: $99   Market Profile defines a number of day types that can help the trader to determine market behaviour. A key feature is the Value Area, representing the range of price action where 70% of trading took place. Understanding the Value Area can give traders valuable insight into market direction and establish the higher odds trade. It is an excellent addition to any system you may be using. Inspired by Jim Dalton’s book “Mind Over Markets”, this indicator is designed to suit the
本指标可以让您享受两个最流行的产品来分析在感兴趣的价位的请求量和市场成交量: 真实市场深度图表 真实报价足迹成交量图表 本产品结合两个指标的效力,并以单个文件提供。 反危机出售。今日低价。赶紧! 真实的 COMBO 市场深度功能和报价成交量图表,完全等同于原始指标。您将享受这两款产品结合为单一超级指标的力量!下面是您将得到的功能: 真实市场深度图表 股民专用工具现已在 MetaTrader 5 上可用。 真实市场深度图表 指标在图表上以直方条的形式显示可视化的市场深度,并在实时模式下刷新。 利用 真实市场深度图表 指标您可以正确评估市场请求并从图表上看到大的市场。这可以 100% 的精确剥头皮和设置持仓止损。 指标以两种相应颜色的水平直方条形式显示买和卖的请求 (买-卖)。价格图表上给定级别的显示条和它们的长度与请求的交易量相应。此外, 它指示买卖请求的最大交易量。 此指标显示买卖请求总数量作为堆积面积图。这可以评估当经过下一价位时将会执行的请求总量。买卖请求总数量也显示在图表上。 省缺, 指标显示在图表背景上, 且它不会干扰任何其它指标。当使用指标交易时, 建议使用实际交易量。
股票交易者的专业工具现已登陆 MetaTrader 5 。 真实市场深度图表 指标在图表上以直方条的形式显示可视化的市场深度,并在实时模式下刷新。 根据用户需要提供更新! 现在真实市场深度指标显示买卖交易请求的交易量比率 (B/S 率)。它显示每种请求类型占全部请求流的份额,以及绝对交易量。 怎么使用它?一般高频交易者的观点, 当某种请求占显著支配地位, 价格趋势将往请求方向倾斜, 即交易量大的。观察并使用我们的真实市场深度指标! 利用 真实市场深度图表 指标您可以正确评估市场请求并从图表上看到大的市场。这可以 100% 的精确剥头皮和设置持仓止损。 指标以两种相应颜色的水平直方条形式显示买和卖的请求 (买-卖)。价格图表上给定级别的显示条和它们的长度与请求的交易量相应。此外, 它指示买卖请求的最大交易量。 反危机出售。今日低价。赶紧! 此指标显示买卖请求总数量作为堆积面积图。这可以评估当经过下一价位时将会执行的请求总量。买卖请求总数量也显示在图表上。 省缺, 指标显示在图表背景上, 且它不会干扰任何其它指标。当使用指标交易时, 建议使用实际交易量。 本指标仅与提供市场深度的品种
Simple ATR modern
Pavel Bereznichenko
Indicator  Simple ATR  Modern It is used in technical analysis to measure market volatility and show it as a level that is more understandable to the eye and not as an oscillator. ATR Daily - Blue The possibilities of using the ATR in trade can be found in the internet. It can also be used in conjunction with another author's indicator  Volatility Vision The Average True Range indicator measures market volatility. Volatility can be low while the market is growing (and vice versa). It is
该指标建立当前报价,可以与历史报价进行比较,并在此基础上进行价格走势预测。指示器有一个文本字段,用于快速导航到所需日期。 选项: 符号 - 选择指标将显示的符号; SymbolPeriod - 选择指标从中获取数据的时段; IndicatorColor - 指示器颜色; HorisontalShift - 由指标绘制的报价移动指定的柱数; Inverse - true 反转引号,false - 原始视图; ChartVerticalShiftStep - 图表垂直移动(键盘上的向上/向下箭头); 接下来是文本字段的设置,您可以在其中输入日期,您可以通过按“回车”立即跳转到该日期。 接下来是文本字段的设置,您可以在其中输入日期,您可以通过按“回车”立即跳转到该日期。
UPD1 Profile Levels MT5
Vitaliy Kuznetsov
5 (3)
该指标在指定柱数的工作直方图上找到最大和最低价格量(市场概况)的水平。   复合型材 。 柱状图的高度是全自动的,并适应任何仪器和时间框架。 作者的算法被使用,并且不重复众所周知的类似物。 两个直方图的高度近似等于蜡烛的平均高度。 智能警报将帮助您了解有关交易量水平的价格。 概念Smart Money 。 Low Volume - Imbalance. 用于寻找良好的市场环境,确定市场结构并作为二元期权的过滤器。 它是价格的磁铁。 High Volume - Liquidity. 用于退出累积时的测试。 输入参数 。 基本 。 Bars Count - 要计数和显示的条数 。 Signal Fractal = 5 (对于颜色信号电平)。 水平将在以下条件下成为信号:顶部和底部有五个直方图不超过它 。 Min Candles For High Volume Level - 在水平蜡烛的最小数量,以便它可以成为一个信号 。 按钮设置 。 Visual Button - 按钮显示(启用/禁用) 。 Corner - 按钮的卡角 。 X indent - 以像素为单位的水平偏移
Volume by Price MT5
Brian Collard
5 (3)
The Volume by Price Indicator for MetaTrader 5 features Volume Profile and Market Profile TPO (Time Price Opportunity). Get valuable insights out of currencies, equities and commodities data. Gain an edge trading financial markets. Volume and TPO histogram bar and line charts. Volume Footprint charts. TPO letter and block marker charts including split structures. Versatile segmentation and compositing methods. Static, dynamic and flexible ranges with relative and/or absolute visualizations. Lay
ICT Fair Value Gap Indicator
David Muriithi
4.5 (4)
An ICT fair value gap is a trading concept that identifies market imbalances based on a three-candle sequence. The middle candle has a large body while the adjacent candles have upper and lower wicks that do not overlap with the middle candle. This formation suggests that there is an imbalance where buying and selling powers are not equal. Settings Minimum size of FVG (pips) -> FVGs less than the indicated pips will be not be drawn Show touched FVGs Normal FVG color -> color of FVG that hasn't
FREE
Wapv Price and volume
Eduardo Da Costa Custodio Santos
Forex Volume MT5
KEENBASE SOFTWARE SOLUTIONS
KT Forex Volume shows the buying and selling volume of a currency pair in the form of a colored histogram. The volume is made of buying and selling transactions in an asset. In FX market: If the buying volume gets bigger than the selling volume, the price of a currency pair would go up. If the selling volume gets bigger than the buying volume, the price of a currency pair would go down. Features Avoid the bad trades by confirming them using the tick volume data. It helps you to stay on the si
This indicator provides an original mix of WPR, VSA, and volume delta. It shows ratio of buy/sell volumes scaled on 100% range based on total volume change for a selected period. The convetional VSA (Volume Spread Analysis) studies interconnections of price action and volume change in absolute values, whereas WPR (Williams Percent Range) offers a convenient approach of price moves normalization into the fixed percentage metric: 0 - 100%. Hence overbough and oversold states are easily spotted. N
Before installing the HeatMap indicator make sure you are using a broker that gives you access to the Depth of market (DOM) !! This indicator creates a heatmap on your chart allowing you to see the buy or sell limit orders easily and in real time. You have the possibility to change the setting and the colors of the HeatMap in order to adapt to all markets and all charts. Here is an example of a setting you can use with the NASDAQ100 on the AMPGlobal broker :  https://www.youtube.com/watch?v=x0
Blahtech Supply Demand MT5
Blahtech Limited
4.57 (14)
Was: $299  Now: $99   Supply Demand uses previous price action to identify potential imbalances between buyers and sellers. The key is to identify the better odds zones, not just the untouched ones. Blahtech Supply Demand indicator delivers functionality previously unavailable on any trading platform. This 4-in-1 indicator not only highlights the higher probability zones using a multi-criteria strength engine, but also combines it with multi-timeframe trend analysis, previously confirmed swings
Volumes Direction MT5
William Oswaldo Mayorga Urduy
卷方向 MT5 通常,当当前音量高于前一音量时,音量指示器具有默认的颜色变化,这很重要但不是很有用。 出于这个原因,这个指标的创建是为了除了正常的交易量之外,当蜡烛看涨或看跌时,它会为它们绘制不同的颜色,默认情况下看涨的蓝色和看跌的红色,但这些颜色可以定制为 商人的味道。 不要忘记查看我的其他指标,它们将帮助您改善交易。 卷方向 MT5 通常,当当前音量高于前一音量时,音量指示器具有默认的颜色变化,这很重要但不是很有用。 出于这个原因,这个指标的创建是为了除了正常的交易量之外,当蜡烛看涨或看跌时,它会为它们绘制不同的颜色,默认情况下看涨的蓝色和看跌的红色,但这些颜色可以定制为 商人的味道。 不要忘记查看我的其他指标,它们将帮助您改善交易。
The balance of supply and demand is a simple and effective market analysis method. The supply and demand diagram can show you in advance, even before the trend reversal, where the supply ends and the demand is already emerging, where the demand ends and the supply is emerging, while substantially increasing the probability of making a deal in the right direction and with a high profit factor. Indicator signals The indicator uses the price/volume values to generate signals: ED – excess demand.
该指标的独特之处在于交易量核算算法:在所选时段内直接进行累积,而无需参考当天的开始。可以从计算中排除最后的柱线,那么当前数据对之前形成的显着水平(交易量)的影响较小。 为了更精确的计算,默认使用 M1 图表中的数据。规范了价格量的分配步骤。默认情况下,显示的右边框设置为用于分析的数据开头对应的栏,但如果需要,可以设置为您需要的栏。显示的音量带的长度(右边界)由系数调节,也可以向左或向右移动到 0(当前)条或参照当前条进行镜像。 参数: Accumulation period -  累积量计算周期 Number of excluded last bars - 从计算中排除的最后一根柱线的数量   Accumulation price step - 按价格参数的成交量总和步骤 Graph length multiplier -  显示数据的长度比例 Use data from timeframe - 用于分析的图表(时间范围) Graph show shift - 开始显示数据的移位,如果留为0,则数据将从分析数据周期开始时间对应的条开始显示; “-1”——显示在左侧; “-2” - 显示
Color Histogram Volume Set
Ricardo Almeida Branco
Do you use volume in your reading of the market? Certainly many traders use it, and do not imagine operating without it. The Color Histogram Volume Set indicator allows the user to choose the value that he considers interesting to monitor. When you pass this you will have visual confirmation and if you want you will also have the audible alert that is given by the indicator. Of course, there are other ways to try to find a high volume, such as assessing whether the volume
Volume Bars
DARIO GALLIONE
An effective indicator that highlights candles with increasing volumes, overshadowing those with shrinking volumes. Also suitable for Forex because it uses tick_volume.  You can set the colors to your liking. It will be easier to spot trends and possible reversals. The increasing volumes indicate the presence of large investors and therefore determine the reliability of the candle under observation
VolumeProfile MT5
Robert Hess
3.75 (8)
Description: The Volume Profile displays detailed informations of historical trading activities at certain price levels (Market Profile). Locate the areas with the best prices in the market and get an advantage over other market participants. Support: The indicator is constantly being developed and improved. Please do not hesitate to contact me via the MQL5 Platform. I am very grateful about any Bug report, so that i can constantly improve the indicator. I appreciate any public review for this
Each bar graph is a brick, take buy a bill now as an example, the brick that is in lowest position at the moment, go to the left, when the brick with the 3rd highest is in existence, take the height of this brick as a benchmark, when the price exceeds the height of this brick, can establish buy a bill, when appear opposite circumstance closes a position, establish empty order at the same time. This is a simple rule, need each friend grope by oneself.
No Demand No Supply MT5
Trade The Volume Waves Single Member P.C.
No Demand No Supply   This indicator identifies   No Demand –No Supply candles  to your chart and plots volume bars colored according to the signal. It can be applied to all timeframes or to a specific one only. It can also be used as regular volume indicator  with exceptional future of WEIGHTED VOLUME. Furthermore is has an alert notification, sound and email when a signals occurs. The indicator does not repaint but the alert will come on two candles back due to the definition of No Demand No S
Waves PRO
Flavio Javier Jarabeck
For those who appreciate Richard Wyckoff approach for reading the markets, we at Minions Labs designed a tool derived - yes, derived, we put our own vision and sauce into this indicator - which we called Waves PRO . This indicator provides a ZigZag controlled by the market volatility (ATR) to build its legs, AND on each ZigZag leg, we present the vital data statistics about it. Simple and objective. This indicator is also derived from the great book called " The Secret Science of Price and Volum
Tick Chart — full-featured chart for MetaTrader 5. A utility for creating and working with a tick chart in the MetaTrader 5 terminal. You can create a tick chart that works exactly the same as a regular chart. You can apply indicators, Expert Advisors and scripts to the tick chart. You get a fully functional tick chart on which you can work just as well as on a regular chart. You can enable the output of the Ask price data. The data are generated in the form of the upper shadow of a tick bar. Fr
Alpha Trend Pro
Eslam Mohamed Abdelrady Shehata
Alpha Trend Pro: Your Ultimate Trading Companion Embark on a new era of trading with Alpha Trend Pro Indicator. Crafted with precision and innovation, Alpha Trend is designed to elevate your trading experience by seamlessly blending powerful elements to navigate various market conditions. **Key Features:** **1. Dynamic Adaptability:**    - In sideways market conditions, Alpha Trend acts as a dead indicator. Say goodbye to many false signals and welcome a tool that adapts seamlessly to mar
Candlesize Histogram
Alexis Brian Luna
Candlesize Histogram is an indicator for monitoring candlestick sizes. This indicator is based on the high and low of a candle, also adopting the use of a histogram to easily determine the length of each candlestick bar. We can determine if the market is gaining momentum using this indicator. The histogram is calculated based on the size of the bars.  Key benefits     - Easily get the length of every candlestick     - Determine market condition if trending or not trending using the Candl
Volume Profile เป็นเครื่องมือที่ใช้สำหรับการวิเคราะห์ระดับการซื้อขายของตลาดในแต่ละระยะเวลาโดยใช้ปริมาณการซื้อขาย (volume) ซึ่งช่วยให้เราเข้าใจว่ามีการซื้อขายเกิดขึ้นมากที่สุดที่ราคาใด รวมทั้งช่วยในการหาจุดที่มีความนิยมในการซื้อขาย (Point of Control: POC) และระดับการซื้อขายอื่น ๆ ที่สำคัญ เรียกว่า Value Area. การใช้งาน Volume Profile ในการวิเคราะห์ตลาดมักจะมีขั้นตอนดังนี้: กำหนดระยะเวลาที่ต้องการวิเคราะห์ : เราต้องกำหนดระยะเวลาที่เราสนใจในการวิเคราะห์ Volume Profile เช่น ชั่วโมง, วัน, หรือสัปดาห์
VolumeDeltaBars
Stanislav Korotky
This indicator is a conventional analytical tool for tick volumes changes. It calculates tick volumes for buys and sells separately, and their delta on every bar, and displays volumes by price clusters (cells) within a specified bar (usually the latest one). The algorithm used internally is the same as in the indicator VolumeDeltaMT5 , but results are shown as cumulative volume delta bars (candlesticks). Analogous indicator for MetaTrader 4 exists - CumulativeDeltaBars . This is a limited substi
Market book
Aliaksandr Hryshyn
Depth of market display. Up to sixteen instruments can be displayed. There is auto-scrolling of prices, which can be turned off by clicking on "A" at the top of the window. It is quite a beautiful indicator, it can act as a splash screen, it will not be so boring to look like a regular chart, just right for meditation, especially after big losses in the market. The indicator is not for trading, so your deposit will be more complete. The video displays fast playback of previously saved data. Atte
Z Score Plus MT5
Eduardo Da Costa Custodio Santos
该产品的买家也购买
Atomic Analyst MT5
Issam Kassas
3.64 (11)
首先值得强调的是,该交易指标是非重绘、非延迟的指标,这使其成为手动和机器人交易的理想选择。 Atomic Analyst是一种PA价格行动指标,利用价格的力量和动量来寻找市场上更好的机会。配备了高级过滤器,可帮助去除噪音和假信号,并提高交易潜力。使用多层复杂的指标,Atomic Analyst扫描图表,并将复杂的数学计算转化为任何初学者都能理解并用来做出一致交易决策的简单信号和颜色。 “Atomic Analyst”是专为新手和经验丰富的交易者量身定制的综合交易解决方案。它将高级指标和一流功能融合为一体的交易策略,使其成为所有类型交易者的多功能选择。 日内交易和剥头皮策略:专为快速准确的日内交易和短期交易而设计。 日内和摆动交易策略:可用作追求价格大幅波动的日内和摆动交易者的可靠工具。 多货币和市场:凭借其可靠的精度,在不同的工具和市场上运作。 多个时间框架:可在多个时间框架上使用,性能良好。 稳定性:所有指标均不重绘、不重绘和不滞后,确保可靠的信号。 信号清晰度:提供箭头信号,用于清晰的入场和出场点。 实时警报:通过交易入场、SL和TP警报通知交易者。 多个利润水平:使用
首先,值得强调的是,这个交易系统是一个非重绘、非重画和非滞后的指标,这使得它非常适合手动和机器人交易。 “智能趋势交易系统 MT5”是专为新手和经验丰富的交易者量身定制的综合交易解决方案。它结合了超过 10 个优质指标,具有 7 多个强大的交易策略,使其成为适用于各种市场条件的多功能选择。 趋势跟随策略:提供精确的入场和止损管理,以有效地跟随趋势。 反转策略:识别潜在的趋势反转,使交易者能够利用区域市场的机会。 剃头策略:专为快速准确的日内交易和短期交易而设计。 稳定性:所有指标都不会重绘、不会重画和不会滞后,确保可靠的信号。 定制:支持自定义策略,以满足个人交易偏好。超过 7 种策略和组合可帮助您找到最佳策略。 信号清晰度:提供箭头信号,以指示清晰的入场和退出点。 实时警报:通过交易进出警报使交易者保持了解。 深入分析:提供更高时间框架的趋势分析和实时交易监控。 自适应颜色编码:利用蜡烛颜色编码来显示成交量、趋势和反转蜡烛信号。通过蜡烛颜色分析市场方向。 “智能趋势交易系统 MT5”赋予交易者必要的工具,以便在各种市场条件下做出明智和战略性的交易决策。无论当前市场状态如何,都能够充满
Quantum Trend Sniper
Bogdan Ion Puscasu
5 (37)
介绍   量子趋势狙击指标 ,突破性的 MQL5 指标,正在改变您识别和交易趋势反转的方式!由拥有超过13年交易经验的资深交易员团队开发,     量子趋势狙击指标   旨在通过其创新的方式以极高的准确度识别趋势反转,将您的交易之旅推向新的高度。 ***购买量子趋势狙击指标,即可免费获得量子突破指标!*** 当量子突破指标识别出趋势反转时,它会向您发出警报和信号箭头,并建议您三个止盈水平。 它既适合新手交易者,也适合专业交易者。 量子 EA 通道:       点击这里 MT4版本:       点击这里 建议: 时间范围: 所有时间范围。为了获得最佳结果,我们建议在 M15、M30 和 H1 时间范围内使用它。 货币对:欧元兑美元、英镑兑美元、澳元兑美元、欧元兑英镑、, EURAUD,  XAUUSD 账户类型:ECN、Raw 或 Razor,点差极低 经纪时间:任意 经纪商:IC Markets、Pepperstone with Raw 和 Razor 的点差最低 建议止损:50 点 建议止盈水平:20 点、50 点和
RelicusRoad Pro MT5
Relicus LLC
4.81 (21)
现在$ 147(更新后增加到$ 499) - 无限帐户(PC或Mac) RelicusRoad 用户手册 + 培训视频 + 访问 Private Discord Group + VIP 身份 一种看待市场的新方式 RelicusRoad 是世界上最强大的外汇、期货、加密货币、股票和指数交易指标,为交易者提供保持盈利所需的所有信息和工具。我们提供技术分析和交易计划,帮助每一位交易者取得成功,从初学者到高级。它是一个关键的交易指标,可以提供足够的信息来预测未来的市场。我们相信一个完整的解决方案,而不是图表上几个没有意义的不同指标。这是一个多合一指标,显示无与伦比且非常准确的信号、箭头 + 价格行为信息。 RelicusRoad 基于强大的人工智能,提供缺失的信息和工具来教育您并使您成为交易专家,成为成功的交易者。 几乎所有技术指标都滞后,这意味着它们只能报告已经发生的事情。因此,他们只确认您过去可以看到的价格已经在哪里。我们相信领先指标可以预测未来价格,而无需重新绘制,也不要过度依赖可能改变并导致重新绘制的滞后指标。如果您根据滞后指标进行交易并建立头寸,您就知道您已
FX Volume MT5
Daniel Stein
4.94 (17)
通过 mql5 和 Telegram 上 的 " 晨间简报 "获取每日市场更新,包括详细信息和屏幕截图 ! 外汇交易量(FX Volume)是第一个也是唯一一个从经纪商角度真正洞察市场情绪的交易量指标。 直接在您的图表上看到这些信息是真正改变游戏规则和突破性的交易解决方案。 受益于独特的市场数据洞察,如 比率(Ratios )显示货币多头和空头头寸的比率(百分比 比率变化 显示所选时间段内的多头比率及其百分比变化 总交易量 显示货币的总交易量(多头和空头),以手为单位 多头 交易量显示货币所有多头头寸的交易量 空头 交易量显示所有货币空头头寸的交易量 净多头 显示净多头交易量,即所有多头头寸减去所有空头头寸(以手为单位)。 净多头百分比 显示货币净多头交易量的变化 请阅读我们的基本教程 -> "如何使用外汇交易量进行交易 " 获取更多信息,如常见问题、交易技巧和教程视频,请访问我们的 外汇交易量公共信息频道 请 安装并运行 SI Connect 以建立与我们数据中心的持续连接 背景信息 我们都知道,外汇是一个分散的市场。这就是为什么我们必须打破常规思维,开发一个独
FX Power MT5 NG
Daniel Stein
5 (4)
通过 mql5 和 Telegram 上 的晨间简报获取每日市场更新,包括详细信息和屏幕截图 ! FX Power MT5 NG 是我们长期以来非常受欢迎的货币强度计算器 FX Power 的下一代产品。 这款下一代强度计算器能提供什么?您所喜爱的原版 FX Power 的所有功能 附加功能 黄金/XAU 强度分析 更精确的计算结果 可单独配置的分析周期 可自定义计算限制,以获得更好的性能 为希望查看更多信息的用户提供特殊的多实例设置 无尽的图形设置,可在每个图表中设置您最喜欢的颜色 无数的通知选项,让您再也不会错过任何重要信息 采用 Windows 11 和 macOS 风格的全新圆角设计 神奇的移动指标面板 FX Power 主要功能 所有主要货币的完整强势历史 所有时间框架内的货币强弱历史 所有经纪商和图表的计算结果完全相同 100% 可靠的实时计算 -> 无重绘 可通过下拉列表选择分析时段 通过自定义模式单独配置分析时段 可在一个图表中使用多个实例 可移动 FX Power 显示屏(通过拖放) 适用于高分辨率 QHD、UHD 和 4K 显示器 自动终端配置 针对平板电脑
Advanced Supply Demand MT5
Bernhard Schweigert
4.53 (15)
任何新手或专业交易者的最佳解决方案! 该指标是一款独特、高质量、且价格合理的交易工具,因为我们已经整合了许多专有功能和新公式。 依据此更新,您将能够显示双重时间帧区域。 您不仅可以显示一个较高的时间帧,还可以同时显示图表时间帧,加上更高的时间帧:显示嵌套时区。 供需双方所有交易者都会喜欢它。 :) 重要信息披露 高级供需的最大潜力,请访问 https://www.mql5.com/zh/blogs/post/720245   想象您的交易如何得以改善,是因为您能够精准定位入场或目标位吗? 构建于新的底层算法,它可以更轻松地识别出买卖双方之间的潜在失衡。 这是因为它以图形方式展示供需最强劲区域,及其过去的表现(显示旧区域)。 这些功能旨在帮助您更轻松地发现最佳入场区域和价位。 现在您可以针对您的交易品种和时间帧来优化和编辑区域强度! 高级供需指标适用于所有产品和时间帧。 它是一个新的公式,非常新的功能是两个区域强度函数可由用户输入进行调整! 这在交易中是一大优势。 当您学习如何使用专有功能,例如带有价格游离最小 X 因子的区域强度时,您能够判断该区域强劲与否。 供需区域用作警报触发器
XQ Indicator MetaTrader 5
Marzena Maria Szmit
5 (1)
Step into the realm of Forex trading with confidence and precision using XQ, a cutting-edge Forex indicator designed to elevate your trading game to unprecedented heights. Whether you're a seasoned trader or just stepping into the world of currency exchange, XQ Forex Indicator empowers you with the insights and signals needed to make informed trading decisions. The signal conditions are a combination of three indicators, and XQ Forex Indicator only display  medium and long-term trends . The ind
Entry Points Pro for MT5
Yury Orlov
4.54 (157)
这款指标用于 MT5,可提供准确的入场交易信号,且无重绘。 它可应用在任何金融资产:外汇、加密货币、贵金属、股票、指数。 它将提供极其精准的评估,并告诉您何时开仓和平仓的最佳时机。 观看 视频 (6:22),其中包含一个仅处理单一信号的示例,该信号即可值回指标购价! 大多数交易者在 Entry Points Pro 指标的帮助下,在第一个交易周内即改善了他们的交易结果。 订阅我们的 Telegram 群 ! Entry Points Pro 指标的益处。 入场信号无重绘 如果信号出现,并得到确认,则它不会再消失;不像是重绘指标,它会导致重大的财产损失,因为它们可以在显示信号后再将其删除。 无差错开仓 指标算法可令您找到入场交易(买入或卖出资产)的理想时机,从而提高每位交易者的成功率。 Entry Points Pro 可操作任何资产 它允许您在 MT5 平台上交易任何经纪商的加密货币、股票、贵金属、指数、大宗商品和货币。 提供任何方向的信号 Entry Points Pro 指标提供针对任意价格走势的入场交易信号 - 上涨、下跌或横盘(横向)。
介绍     Quantum Breakout PRO   ,突破性的 MQL5 指标,正在改变您交易突破区域的方式!由拥有超过13年交易经验的资深交易员团队开发,     量子突破 PRO     旨在通过其创新和动态的突破区域策略将您的交易之旅推向新的高度。 量子突破指标将为您提供带有 5 个利润目标区域的突破区域的信号箭头,以及基于突破框的止损建议。 它既适合新手交易者,也适合专业交易者。 量子 EA 通道:       点击这里 重要的!购买后请私信我领取安装手册。 建议: 时间范围:M15 货币对:GBPJPY、EURJPY、USDJPY、NZDUSD、XAUUSD 账户类型:ECN、Raw 或 Razor,点差极低 经纪商时间:GMT +3 经纪商:IC Markets、Pepperstone with Raw 和 Razor 的点差最低 规格: 不重漆! 最多 5 个建议利润目标区域 建议止损水平 可定制的盒子。您可以设置自己的 Box Time Start 和 Box Time End。 接触 如果您有任何疑问或需要帮
ICT, SMC, SMART MONEY CONCEPTS, SMART MONEY, Smart Money Concept, Support and Resistance, Trend Analysis, Price Action, Market Structure, Order Blocks, BOS/CHoCH,   Breaker Blocks ,  Momentum Shift,   Supply&Demand Zone/Order Blocks , Strong Imbalance,   HH/LL/HL/LH,    Fair Value Gap, FVG,  Premium  &   Discount   Zones, Fibonacci Retracement, OTE, Buy Side Liquidity, Sell Side Liquidity, BSL/SSL Taken, Equal Highs & Lows, MTF Dashboard, Multiple Time Frame, BigBar, HTF OB, HTF Market Structure
TrendMaestro5
Stefano Frisetti
note: this indicator is for METATRADER4, if you want the version for METATRADER5 this is the link:  https://www.mql5.com/it/market/product/108106 TRENDMAESTRO recognizes a new TREND in the bud, he never makes mistakes. The certainty of identifying a new TREND is priceless. DESCRIPTION TRENDMAESTRO identifies a new TREND in the bud, this indicator examines the volatility, volumes and momentum to identify the moment in which there is an explosion of one or more of these data and therefore the mome
Owl Smart Levels MT5
Sergey Ermolov
4.47 (36)
MT4版本  |   FAQ Owl Smart Levels Indicator 是一個完整的交易系統,包含 Bill Williams 的高級分形、構建正確的市場波浪結構的 Valable ZigZag 以及標記準確入場水平的斐波那契水平等流行的市場分析工具 進入市場和地方獲利。 策略的详细说明 指示灯使用说明 顾问-贸易猫头鹰助手助理 私人用户聊天 ->购买后写信给我,我会将您添加到私人聊天中,您可以在那里下载所有奖金 力量在於簡單! Owl Smart Levels 交易系統非常易於使用,因此適合專業人士和剛開始研究市場並為自己選擇交易策略的人。 策略和指標中沒有隱藏的秘密公式和計算方法,所有策略指標都是公開的。 Owl Smart Levels 允許您快速查看進入交易的信號,突出顯示下訂單的水平並向您發送有關已出現信號的通知。 優點很明顯: 清楚地顯示主要和更高時間框架的趨勢方向。 指示儀器信號的出現。 標記開單、止損設置和固定利潤的水平。 沒有多餘的,只有必要的結構! ZigZag 表示全球趨勢的方向,因此也表示貿易方向。 市場反轉點的短線清楚地表明在什麼水平上構建斐波
Quantum Heiken Ashi PRO MT5
Bogdan Ion Puscasu
4.5 (8)
Quantum Heiken Ashi PRO 简介 Heiken Ashi 蜡烛旨在提供对市场趋势的清晰洞察,以其过滤噪音和消除虚假信号的能力而闻名。告别令人困惑的价格波动,迎接更流畅、更可靠的图表表示。 Quantum Heiken Ashi PRO 的真正独特之处在于其创新公式,它将传统烛台数据转换为易于阅读的彩色条。红色和绿色条分别优雅地突出了看跌和看涨趋势,让您能够以非凡的精度发现潜在的进入和退出点。 量子 EA 通道:       点击这里 MT4版本:       点击这里 这一卓越的指标具有以下几个关键优势: 增强清晰度:通过平滑价格波动,Heiken Ashi 金条可以更清晰地反映市场趋势,使您更容易识别有利的交易机会。 减少噪音:告别经常导致错误信号的不稳定价格变动。 Quantum Heiken Ashi 指标可过滤噪音,使您能够做出更明智的交易决策 无缝集成:Heiken Ashi 指标专为 MetaTrader 开发,可无缝集成到您的交易平台中。它用户友好、高度可定制,并且与您的其他交易指标和过滤器兼容 无论您是寻求新优势的经验丰富的交易者,
IX Power MT5
Daniel Stein
5 (2)
IX Power 终于将 FX Power 的无与伦比的精确性带到了非外汇交易符号中。 它能准确判断您喜爱的指数、股票、商品、ETF 甚至加密货币的短期、中期和长期趋势强度。 您可以 分析 终端提供的 一切 。试试吧,体验一下您在交易时如何把握 时机 。 IX Power 主要功能 100% 精确的非重绘计算结果 - 适用于您终端中的所有交易符号 下拉式选择预配置以及可单独配置的强度分析周期 通过电子邮件、消息和手机通知的无数种通知选项 可访问的 EA 请求缓冲区 可自定义计算限制,以获得更好的性能 为希望查看更多信息的用户提供特殊的多实例设置 无尽的图形设置,让您在每个图表中都能找到最喜欢的颜色 采用 Windows 11 和 macOS 风格的圆角新面板设计 神奇的移动指标面板,可在子窗口和主图表之间无缝移动 适用于高分辨率 QHD、UHD 和 4K 显示器,并针对平板电脑和触摸屏进行了优化 IX Power 参数 最重要的参数不言自明,但我们很快会在另一篇文章中为您提供所有 IX Power 参数的完整说明。 使用别名 "参数可为技术交易符号
TrendDecoder Premium MT5
Christophe, Pa Trouillas
5 (1)
确定范围和下一步可能的走势    |     获得早期信号和趋势强度   |     在反转之前获得明确的退出   |     了解价格将测试哪些斐波水平   |  非重绘、非延迟指标 - 手动和自动交易的理想选择 - 适用于所有资产和所有时间单位 推出时为   69 美元 --然后恢复到 >>   149 美元 购买后,  请联系我的频道  获取推荐设置 MT4 版本: 点击此处 使用 BladeSCALPER 和 PowerZONES 获取我们的完整方法 它是什么? TrendDECODER 集多种创新于一身,使趋势监测变得简单易行。 投射趋势线(Projective TrendLine )--快速参考即将到来的趋势 实时趋势线(RealTime TrendLine) 与投射趋势线(Projective TrendLine)的对比 - 与之前的同方向走势相比,市场是加速还是放缓? 实时趋势线交叉 -   趋势正在偏离轨道 使用 GreyBox -   市场不再是趋势并进入新的过渡序列 使用 DecoderSignals 和 Blue/Orange Clouds
Gartley Hunter Multi
Siarhei Vashchylka
5 (5)
Gartley Hunter Multi - An indicator for searching for harmonic patterns simultaneously on dozens of trading instruments and on all classic timeframes: (m1, m5, m15, m30, H1, H4, D1, Wk, Mn). Manual (Be sure to read before purchasing) | Version for MT4 Advantages 1. Patterns: Gartley, Butterfly, Shark, Crab. Bat, Alternate Bat, Deep Crab, Cypher 2. Simultaneous search for patterns on dozens of trading instruments and on all classic timeframes 3. Search for patterns of all possible sizes. Fr
Golden Spikes Detector
Batsirayi L Marango
5 (1)
Golden Spikes Detector This indicator is based on an advanced strategy primarily for trading spikes on Boom and Crash Indices. Complex algorithms were implemented to detect high probability entries only. It alerts on potential Buy and Sell entries. To trade spikes on the Deriv or Binary broker, only take Buy Boom and Sell Cash alerts. It was optimised to be loaded on 5-minute timeframe although multiple timeframe analysis is done in the background. Features ·             Desktop pop up and sound
Matrix Arrow Indicator MT5
Juvenille Emperor Limited
5 (14)
矩阵箭头指标 MT5   是一种独特的 10 合 1 趋势,遵循   100% 非重绘多时间框架指标 ,可用于所有符号/工具: 外汇 、 商品 、 加密货币 、 指数 、 股票 。 Matrix Arrow Indicator MT5 将在其早期阶段确定当前趋势,从多达 10 个标准指标中收集信息和数据,它们是: 平均定向运动指数 (ADX) 商品渠道指数 (CCI) 经典 Heiken Ashi 蜡烛 移动平均线 移动平均收敛散度 (MACD) 相对活力指数 (RVI) 相对强弱指数 (RSI) 抛物线SAR 随机振荡器 威廉姆斯的百分比范围 当所有指标给出有效的买入或卖出信号时,相应的箭头将打印在图表上,在下一根蜡烛/柱线开盘时,指示强劲的上升趋势/下降趋势。用户可以选择使用哪些指标,并可以单独调整每个指标的参数。 Matrix Arrow Indicator MT5 仅从选定的指标中收集信息,并仅根据其数据打印箭头。   Matrix Arrow Indicator MT5   还可以为所有新信号发送终端、推送通知或电子邮件警报。无论您是黄牛、日内交易者还是波段交易者, Mat
Golden Gate Algo MT5
James David Lane
4 (6)
40% 圣诞优惠!价格将于1月1日涨至$250! 推出GoldenGate Entries:前沿交易解决方案! 发现与GoldenGate Entries(GGE)一同进行交易的革命性方法,这是一款设计用于提升您交易体验的先进指标。GGE提供了一套全面的功能,以赋予用户在交易决策中的精准和信心。 交易对:任意(外汇 - 商品 - 股票 - 股票 - 加密货币) 时间框架:15分钟至H1 主要特点: 买入和卖出箭头指示:接收伴随弹出警报的买入和卖出箭头指示,确保您随时保持了解。 GoldenGate_Algo:通过GoldenGate_Algo深入了解市场状况,这是一款强大的工具,用于评估市场是否处于“超卖”或“超买”状态。 当前趋势分析:通过访问您正在查看的时间框架上的当前趋势,保持领先地位,使您能够将交易与市场当前方向对齐。 内置枢轴点:使用内置的枢轴点轻松识别关键市场点,提供有价值的支撑和阻力水平。 蜡烛扫描器:分析蜡烛形态和图案,找到最佳的入场点并过滤掉低概率的入场。 完全定制:通过完整的定制选项,完全掌控您的交易体验,允许您个性化从
Legacy of Gann for MT5
Pavel Zamoshnikov
5 (4)
The indicator very accurately determines the levels of the possible end of the trend and profit fixing. The method of determining levels is based on the ideas of W.D.Gann, using an algorithm developed by his follower Kirill Borovsky. Extremely high reliability of reaching levels (according to K. Borovsky  - 80-90%) Indispensable for any trading strategy – every trader needs to determine the exit point from the market! Precisely determines targets on any timeframes and any instruments (forex, met
Trend Forecaster
Alexey Minkov
5 (3)
The Trend Forecaster indicator utilizes a unique proprietary algorithm to determine entry points for a breakout trading strategy. The indicator identifies price clusters, analyzes price movement near levels, and provides a signal when the price breaks through a level. The Trend Forecaster indicator is suitable for all financial assets, including currencies (Forex), metals, stocks, indices, and cryptocurrencies. You can also adjust the indicator to work on any time frames, although it is recommen
Bill Williams Advanced
Siarhei Vashchylka
5 (3)
Bill Williams Advanced is designed for automatic chart analysis using Bill Williams' "Profitunity" system. The indicator analyzes four timeframes at once. Manual (Be sure to read before purchasing) Advantages 1. Automatically analyzes the chart using the "Profitunity" system of Bill Williams. The found signals are placed in a table in the corner of the screen. 2. Equipped with a trend filter based on the Alligator indicator. Most of the system signals are recommended to be used only accordi
PZ Swing Trading MT5
PZ TRADING SLU
5 (4)
Swing Trading 是第一个旨在检测趋势方向的波动和可能的反转波动的指标。它使用在交易文献中广泛描述的基准摆动交易方法。该指标研究多个价格和时间向量,以追踪总体趋势方向,并检测市场超卖或超买并准备好进行修正的情况。 [ 安装指南 | 更新指南 | 故障排除 | 常见问题 | 所有产品 ] 市场波动的利润不会被窃取 指示器始终显示趋势方向 彩色价格带代表机会基准 彩色虚线表示可能的反转波动 该指标分析其自身的质量和性能 它实现了一个多时间仪表板 可定制的趋势和波动周期 它实现了电子邮件/声音/推送警报 指示器为非重涂或重涂 什么是摇摆交易 摇摆交易是一种尝试在一天到一周内从证券中获得收益的交易方式,尽管某些交易最终可以保持更长的寿命。摇摆交易者使用技术分析来买入弱点和卖出力量,并有耐心等待这些机会的发生,因为在发生一波抛售浪潮之后购买证券而不是陷入抛售更有意义。 机会基准 关于历史数据的大量研究证明,适合于波动交易的市场倾向于在基线价格带上下交易,基线价格带由图表显示,使用平均真实区间计算得出。波动交易者使用基线,该策略是购买常态和卖出躁狂,或做空常态并掩盖沮丧。
Professional Scalping Tool on Deriv Attention! The indicator will be sold in limited quantities!!! Description: This trading indicator is designed for professional traders focused on scalping. Designed with the market in mind, it provides highly accurate spike trading signals. It works on the M1 timeframe and supports the following symbols: Boom 300 Index, Boom 500 Index, Boom 1000 Index, Crash 300 Index, Crash 500 Index, Crash 1000 Index. Functional Features: - Direction: - Trading is ca
123模式 是最受欢迎,功能强大和灵活的图表模式之一。该模式由三个价格点组成:底部,峰值或谷值以及38.2%至71.8%之间的斐波纳契回撤位。当价格突破最后一个峰值或谷值时,该形态被认为是有效的,此时指标绘制箭头,发出警报并可以进行交易。 [ 安装指南 | 更新指南 | 故障排除 | 常见问题 | 所有产品 ] 清除交易信号 可自定义的颜色和尺寸 实施绩效统计 可定制的斐波那契回撤水平 显示适当的止损和获利水平 该指标可用于查找连续或反转形态 它是不可重涂和不可重涂的 它实现了电子邮件/声音/视觉警报 123模式 可以表现为连续或反转模式。为了简化操作,该指标使您可以选择要寻找哪种类型的形态,使其成为趋势或反转交易者的绝佳工具。 设置 将指标加载到任何图表时,将显示一组选项作为输入参数。如果您认为它们太多,请不要感到失望,因为参数被分组为不言自明的块。这就是每个参数块的作用。 幅度-幅度表示替代价格点之间的最小柱线量。要找到大图案,请增加幅度参数。要查找较小的模式,请减小幅度参数。 闵。回撤-形态中所需的最小斐波那契回撤。设置为零不对其进行评估。 最大。回撤-形态中可能
Trades Assistant MT5
Martin Muriu Maina
Trade Assistant MetaTrader System  — a multi-timeframe system that is based on three standard indicators:   Stochastic oscillator ,   RSI   (Relative Strength Index), and   CCI   (Commodity Channel Index). It displays current trend directions for M1, M5, M15, M30, H1, H4, D1, W1, and MN1 timeframes. When you follow such an indicator you have a clear picture of the trends across all important timeframes. It doesn't matter which timeframe you attach this indicator to. Input parameters CheckCandl
TPSpro RFI Levels MT5
Roman Podpora
5 (5)
A key element in trading is zones or levels from which decisions to buy or sell a trading instrument are made. Despite attempts by major players to conceal their presence in the market, they inevitably leave traces. Our task was to learn how to identify these traces and interpret them correctly. Reversal First Impulse levels (RFI)   -  Version MT4                  INSTRUCTIONS                 RUS                 ENG                         R ecommended to use with an indicator   -  TREND PRO  
Gartley Hunter MT5
Siarhei Vashchylka
5 (13)
Gartley Hunter - An indicator for searching for harmonic patterns (Gartley patterns) and their projections. The indicator is equipped with a system of alerts and push notifications. Manual (Be sure to read before purchasing) | Version for MT4 Advantages 1. 12 harmonic patterns: 7 classical and 5 exotic. New patterns will be added as the indicator develops. 2. Constant automatic search for harmonic patterns. The indicator is capable of finding from the smallest to the largest patterns. 3. Autom
作者的更多信息
Cumulative Delta NG
Anton Polkovnikov
Cumulative delta indicator As most traders believe, the price moves under the pressure of market buying or selling. When someone redeems an offer standing in the cup, the deal is a "buy". If someone pours into the bid standing in the cup - the deal goes with the direction of "sale". The delta is the difference between purchases and sales. A cumulative delta - the difference between the cumulative sum of purchases and sales for a certain period of time. It allows you to see who is currently contr
Seconds time frame In MT5 there are no second charts by default. Many of the presented options for creating such do not work fully - errors with extrema, inability to use indicators, etc. I present you a fully working variant. The script works as an Expert Advisor by creating a custom symbol. To work, the script is placed on the M1 chart of the instrument of interest, after which the window of the custom symbol will open automatically. The settings are minimal and intuitive - the timeframe inte
RENKO Reversal
Anton Polkovnikov
4 (4)
RENKO Reversal by StockGamblers Actually working RENKO in MT5. Uses "custom symbols" for drawing. You can apply any indicators with complete peace of mind. The movement of the last price is displayed in real during the formation of the "brick". Put the script in the MQL5/Experts folder. More precisely: C:\Users\user\AppData\Roaming\MetaQuotes\Terminal\terminal_number\MQL5\Experts Settings: ValuePerBar - height of the "brick" in points revCandle - multiplier for the height of the turning "brick".
FREE
The script removes all of the indicators on the chart with one movement of the hand. There are situations when there are too many indicators on the chart. And it is required to delete all of them without closing the tab. Unfortunately, the settings window doesn't allow us to select all indicators at once and we have to delete one by one. This script will solve this problem. Simply drag the script   from Navigator window onto the chart.
FREE
TrendMeasurer indicator manual / TMi manual The indicator is designed to help the user to find the end point of a strong trending price movement. Important - END. Not start. How the indicator works The first price impulse and its subsequent pullback form a certain "critical mass" which acts as "fuel" for further price movement. The production of this fuel indicates the potential end of the trend. Both volume and indicator calculated in a certain way from price data can be the fuel. The amount of
TrendMeasurer indicator / TMi The indicator is designed to help the user to find the end point of a strong trending price movement. Important - END. Not start. How the indicator works The first price impulse and its subsequent pullback form a certain "critical mass" which acts as "fuel" for further price movement. The production of this fuel indicates the potential end of the trend. Both volume and indicator calculated in a certain way from price data can be the fuel. The amount of "fuel" can be
VWAP Daily
Anton Polkovnikov
Weighted average price indicator or VWAP. The well-known standard VWAP with the beginning of the day is added with the function of selecting the periodization. It can be calculated both every day and on other periods. Also the indicator allows to exclude the volume from the calculation, which will allow using it on the cryptocurrencies and forex. There is an alert for a VWAP price crossing. There are 1 and 2 standard deviation. Settings: Volume: turning volume on and off in the calculation mecha
Point of Control POC
Anton Polkovnikov
A huge number of traders use the VolumeProfile/MarketProfile analysis method. And I think there is no need to explain such concepts as POC and VAH/VAL. However, the standard VolumeProfile representation has a drawback - we only see the current picture of the market. We see the "convexity" of the volume distribution within the period. But we don't see the main thing - the "migration" of the POC level during the price movement. Our indicator is unique. It is dynamic. The first feature is that the
Non-lagging VOLATILITY indicator A radical modification of the ATR indicator, which corrected all of its shortcomings (the picture shows the difference with ATR). The indicator shows the swing size of the current market movement. Features: does not have a time window period, i.e. any subjective settings non-delayed, the extremums of the indicator always coincide with the extremum of the price (note the picture) is normalized by means of a color solution, i.e. it has the properties of an oscillat
MultiVWAP
Anton Polkovnikov
5 (1)
MultiVWAP A radical reworking of the well-known VWAP, which is in fact a completely new unique tool. It gives you the opportunity to put 5 types of different VWAPs on the chart: Volume - standard VWAP calculated based on volume No volume - no volume in calculations, which allows using the indicator on the charts, for which the broker does not supply volumetric data Volatility - new development, the calculation is based on unsteady volatility Buyer - VWAP calculation is based on current market bu
POC Auto
Anton Polkovnikov
Auto Point of Control Indicator for those who use the Market/Volume Profile in their trading, who are familiar with the concepts of POC and VAH/VAL. I often noticed that it is inconvenient to change the zone of POC level calculation. Also it is not always convenient to use periodic areas, such as Day, Hour, etc. So I decided to develop a fully automated POC, where the zones change each other through the algorithm in the script. How to use POC - everyone decides for himself. They can be stop-loss
Pullback Hunter
Anton Polkovnikov
PULLBACK HUNTER (回调猎手) 每个交易员的终极梦想是什么?要毫不迟疑地看到反转将在哪里发生。当然,这也是一种魔法,虽然... 没有什么是不可能的。但与此同时,我为你准备了一个指标,它可以实时标记当前运动的修正结束,或者简而言之,它可以捕捉到反转的情况。什么是主旨?许多人在价格向开仓方向移动时练习反弹。他们在新极点的形成过程中这样做。一切都很好,但在这种情况下,头寸的加权平均价格并不理想。但如果我们等待回调并在趋势中买入,我们将获得一个良好的平均价格。这个指标显示了矫正运动可能结束的地方。 什么是重要的?不建议 "正面 "使用指示器。也就是说,在向上的箭头上买入,等待向下的箭头来关闭购买。指标的最佳用途是设定一个位置。通过这个额外的工具,你可以过滤你的方向,并在箭头上买入(或做空)被过滤的方向。例如,你使用累积三角洲。它向你展示了整个市场的购买情况。你等待上升的箭头,然后买入。使用额外的分析工具来退出头寸。 该指标的原理是什么?箭头是价格测试支撑或阻力水平的地方。这些水平是由指标内部的算法计算出来的。一个相同的蜡烛图可能同时测试几个支撑位。这可以通过箭头的颜色看出。如果烛
Levels StopTP
Anton Polkovnikov
水平(極值、止損、獲利) 用於更改止損訂單的放置水平(由用戶手動完成,指標僅可視化水平)。它也可用於在與運動相反的水平上獲取部分利潤。 該指標將允許您採取大部分強勁的運動。您不必擔心過早退出該職位。如果您陷入強勢走勢,只需觀察支撐位並在價格突破該水平時止損退出。 該指標並非旨在搜索入場位置 設置: 極值區域 - 最初搜索極值的區域。 在這種情況下,之前有 2 根蠟燭,之後有 2 根蠟燭。 类型级别-负责级别的值-蜡烛的极端或收盘价 Any Break - 啟用此參數可在第一級更改時提供更高的靈敏度。 重新開始新的一天 - 用於具有潛在大範圍第一根蠟燭的工具的日內圖表。 否則,第一根帶有尾巴的蠟燭可能會立即決定全天的水平。 Bar's Quantity - 顯示指標的左側蠟燭數 .... 演示版在"讨论"。 出于某种原因,MQL默认制作的演示不起作用。
筛选:
无评论
回复评论