ADX Vidya Moving Average Crossover
- 指标
- Leif Christian Ringstad
- 版本: 1.0
- 激活: 20
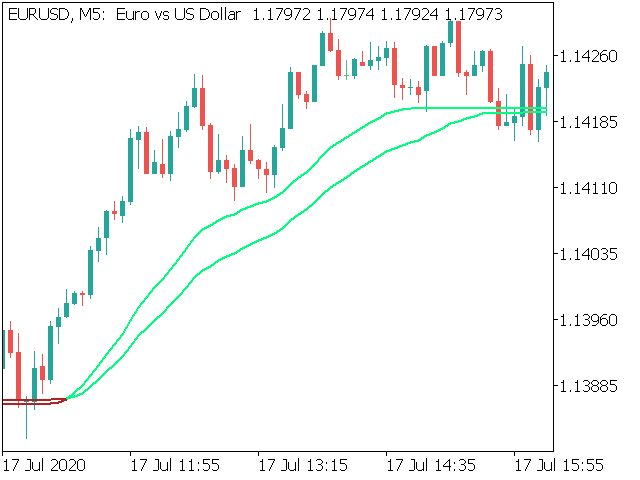
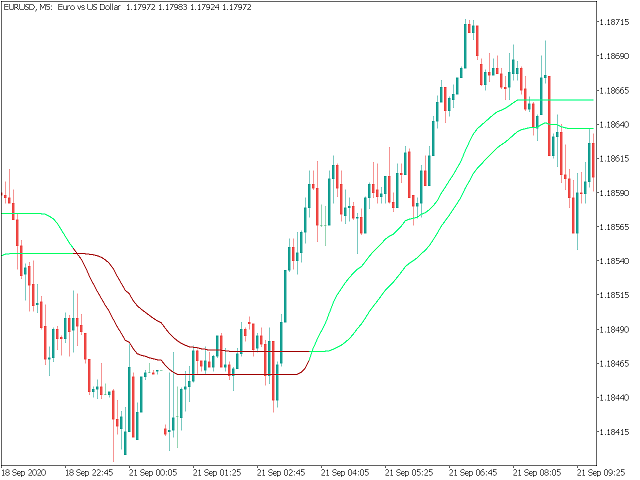
This is a moving average crossover using Average Directional Index Vidya Moving average. It can change colour on slope or on the crossover.
Use the crossover as signals for entering a trade in the long or short direction.
Parameters:
| Parameter | Default value | Options |
|---|---|---|
| Fast ADXVMA period | 14 | Any number of bars |
| Fast ADXVMA price method | Close | Open, Close, High, Low, Median, Typical, Weighted |
| Slow ADXVMA period | 21 | Any number of bars |
| Slow ADXVMA price method | Close | Open, Close, High, Low, Median, Typical, Weighted |
| Visual colour of moving average | Change colour on Crossover | Change colour on crossover, change colour on slope direction of each of the moving averages, no colour change |
- Fast Moving Average Period (Default: 14)
- Fast Moving Average Price method (Default: Close)
- Slow Moving Average Period (Default: 21)
- Slow Moving Average Price method (Default: Close)
- Change of colour on slope / Change colour on crossover
For crossover type trades:
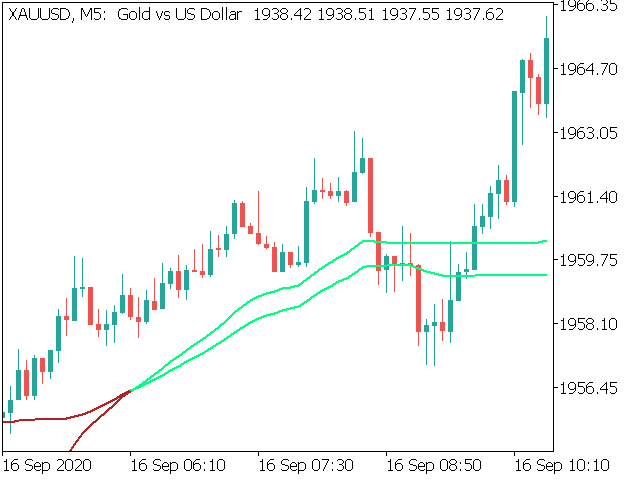
When the fast moving average crosses above the slow moving average, look for buy entries. (Both MA should be green)
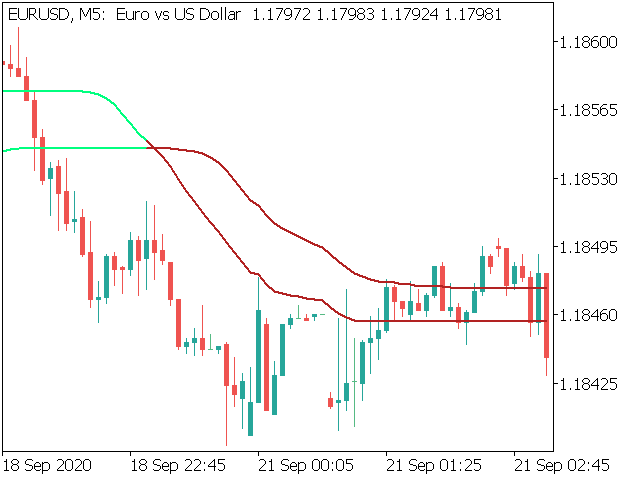
When the fast moving average crosses below the slow moving average, look for sell entries. (Both MA should be red)
For slope direction change:
Look for change of color of the MA you want to follow, and use the other as confirmation. Green for buy/long trades, and red for sell/short trades.
The indicator can also be used to show the current trend direction, by looking at the color of the ADX Vidya Moving averages.
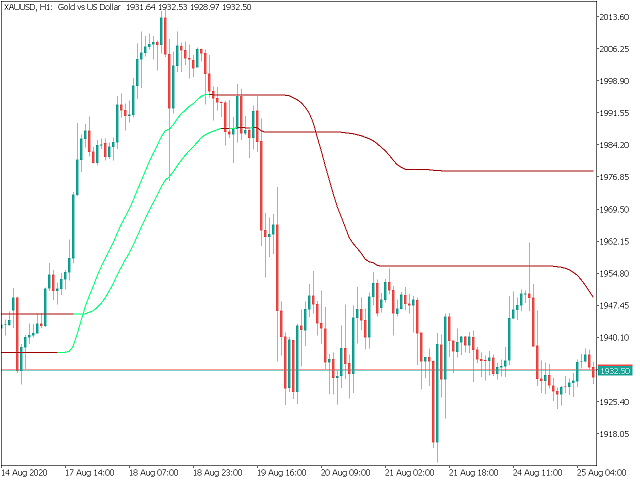


Gute Arbeit, mit diesem Indikator habe ich im H4 und D1 gute Gewinne gemacht. Signale auf die man sich verlassen kann.