Noize Absorption Index - is the manual trading system that measures the difference of pressure between bears forces and bulls forces. Green line - is a noize free index that showing curent situation. Zero value of index shows totally choppy/flat market.Values above zero level shows how powerfull bullish wave is and values below zero measures bearish forces.Up arrow appears on bearish market when it's ready to reverse, dn arrow appears on weak bullish market, as a result of reverse expectation.
Fit line supports to extrapolation next movement of market, support for buy/sell decision. Indicator using spline algorithm to extrapolation. You can change number of spline with parameter "PointsNumber" and number of extrapolation point with "ExtrapolateBars". Eextrapolation points will be save into csv format, with prefix in parameter "PointsPrefix", and store in folder File of Data Folder.
Sniper2 , It has points of lines, with colors that are showing you an entrance, that work as support and resistance! green dotted lines green shows entry for sale, the red dotted lines show a buy entry, pay attention to the supports that work as a break to catch long candles in a longer period of time. works for forex all pairs works for synthetic indices all pairs ! indicator on sale!
This is an advanced multi-timeframe version of the popular Hull Moving Average (HMA) Features Two lines of the Hull indicator of different timeframes on the same chart. The HMA line of the higher timeframe defines the trend, and the HMA line of the current timeframe defines the short-term price movements. A graphical panel with HMA indicator data from all timeframes at the same time . If the HMA switched its direction on any timeframe, the panel displays a question or exclamation mark with a tex
Welcome to the Ultimate Harmonic Patterns recognition indicator that is focused to detect advanced patterns. The Gartley pattern, Bat pattern, and Cypher pattern are popular technical analysis tools used by traders to identify potential reversal points in the market.
Our Ultimate Harmonic Patterns recognition Indicator is a powerful tool that uses advanced algorithms to scan the markets and identify these patterns in real-time.
With our Ultimate Harmonic Patterns recognition Indicator, you
Indicator and Expert Adviser EA Available in the comments section of this product. Download with Indicator must have indicator installed for EA to work.
Mt5 indicator alerts for bollinger band and envelope extremes occurring at the same time. Buy signal alerts occur when A bullish candle has formed below both the lower bollinger band and the lower envelope Bar must open and close below both these indicators. Sell signal occur when A bear bar is formed above the upper bollinger band and upp
This indicator obeys the popular maxim that: "THE TREND IS YOUR FRIEND" It paints a Blue line for BUY and also paints a RED line for SELL. (you can change the colors). It gives alarms and alerts of all kinds. IT DOES NOT REPAINT COLOR and can be used for all currency pairs and timeframes. Yes, as easy and simple as that. Even a newbie can use it to make great and reliable trades. https://www.mql5.com/en/market/product/115553
Perfect Sniper! is a triple indicator with support resistance detection, downtrend channel, uptrend channel Bands included! where he hunts the rebounds in the red lines for sale, in the green lines mark purchase, in the lower bands that are the breaks gives another second entry either buy or sell, perfect to take advantage of the double entrance, It is used in any temporality, It is used to scalp and long on h1 or h4 to D1. It works for Forex markets, All pairs. It is used for the synthetic inde
Cumulative delta indicator As most traders believe, the price moves under the pressure of market buying or selling. When someone redeems an offer standing in the cup, the deal is a "buy". If someone pours into the bid standing in the cup - the deal goes with the direction of "sale". The delta is the difference between purchases and sales. A cumulative delta - the difference between the cumulative sum of purchases and sales for a certain period of time. It allows you to see who is currently contr
交易时段指标突出显示每个交易时段的开始和结束 。
Trading_Sessions_Indicator_Free 产品的付费版本,可以自定义会话的开始/结束。
[选项:] Asian session Open Asian session Close Asian session OpenSummertime Asian session CloseSummertime European session Open European session Close European session Open European session Close Timeshift
请使用M15-H2时间帧以获得最佳效果。
增加了时间帧M1,M5的校正。 近似校正: Bars Correction ------------------ 23.50 ____ 10 23.54 ____ 5 23.55 ____ 4(5) 00.05 ____ 5(6)
我在市场上的其他产品 https://www.mql5.com/en/users/sky-angel/selle
Volality Index scalper indicator Meant for Volality pairs such as Volality 10, 25, 50, 75 and 100 The indicator works on all timeframes from the 1 minute to the monthly timeframe the indicator is non repaint the indicator has 3 entry settings 1 color change on zero cross 2 color change on slope change 3 color change on signal line cross Orange line is your sell signal Blue line is your buy signal.
Laguerre SuperTrend Clouds adds an Adaptive Laguerre averaging algorithm and alerts to the widely popular SuperTrend indicator. As the name suggests, Laguerre SuperTrend Clouds (LSC) is a trending indicator which works best in trendy (not choppy) markets. The SuperTrend is an extremely popular indicator for intraday and daily trading, and can be used on any timeframe. Incorporating Laguerre's equation to this can facilitate more robust trend detection and smoother filters. The LSC uses the
Ichimoku Aiko MTF is a collection of technical indicators that show support and resistance levels, as well as momentum and trend direction. It is a multi-timeframe indicator so you don't need to change the chart timeframe when you want to see the ichimoku clouds on a higher timeframe. eg. The chart timeframe is M15 and you want to see on the M15 timeframe chart the H1 ichimoku indicators (the ichimoku in Metatrader can't do that) that's why you need to use Ichimoku Aiko MTF.
Exclusive Limited Time Offer! Grab this useful indicator for a lifetime at just $49. Note: It is requested that purchases must be refrained from if the buyer is from India, Bangladesh, or Pakistan, as developer support for these regions is unavailable due to legal restrictions. Volatility indicator dashboard designed to revolutionize how traders perceive and navigate market volatility. Track volatile for multiple currency pairs one at time for multiple timeframes. Works best with Forex Market,
Think of an indicator that instantly shows you all supports, resistances and turncoats and can send a notification to your phone or an alarm on your computer. In addition to all these, it groups how many times it has entered each field and, accordingly, the strength of the field. Supply Demand And Turncoat is at your service. Setup for any TimeFrame and Chart you want and enjoy easy trading. Features: Ability to select the fields to be shown (weak, untested, turncoat, verified, proven) Merge fie
GIVE A LOOK TO MY OTHER PRODUCTS !
100 % PER MONTH PROFIT---- MY NEW SIGNAL HERE -------> https://www.mql5.com/en/signals/2162238?source=Site+Signals+My# BROKEN TRENDLINE ALERT IS A SIMPLE TOOL INDICATOR. JUST DRAW IN YOUR CHART A DYNAMIC OR STATIC TRENDLINE,AND THE INDICATOR WILL SEND YOU ALERT WHENEVER THE PRICE CROSSES BELOW OR ABOVE YOUR DRAWN TRENDLINE. IT WORKS IN ANY TIMEFRAME AND ANY CHART YOU WANT.JUST GOT A VPS AND DON'T STRESS IN FRONT OF YOUR COMPUTER.
FOR ANY KIND OF QUESTION
Mine Farm is one of the most classic and time-tested scalping strategies based on the breakdown of strong price levels.
Mine Farm is the author's modification of the system for determining entry and exit points into the market...
Mine Farm - is the combination of great potential with reliability and safety.
Why Mine Farm?!
- each order has a short dynamic Stop Loss
- the advisor does not use any risky methods (averaging, martingale, grid, locking, etc.)
- the advisor tries to get
An indicator of pattern #31 ("Long Island") from Encyclopedia of Chart Patterns by Thomas N. Bulkowski. The second gap is in the opposite direction.
Parameters: Alerts - show alert when an arrow appears Push - send a push notification when an arrow appears (requires configuration in the terminal) GapSize - minimum gap size in points ArrowType - a symbol from 1 to 17 ArrowVShift - vertical shift of arrows in points ShowLevels - show levels ColUp - color of an upward line ColDn - color of a
KT Renko Patterns scans the Renko chart brick by brick to find some famous chart patterns that are frequently used by traders across the various financial markets. Compared to the time-based charts, patterns based trading is easier and more evident on Renko charts due to their uncluttered appearance.
KT Renko Patterns features multiple Renko patterns, and many of these patterns are extensively explained in the book titled Profitable Trading with Renko Charts by Prashant Shah. A 100% automate
The trend is your friend!
Look at the color of the indicator and trade on that direction. It does not repaint. After each candle is closed, that's the color of the trend. You can focus on shorter faster trends or major trends, just test what's most suitable for the symbol and timeframe you trade. Simply change the "Length" parameter and the indicator will automatically adapt. You can also change the color, thickness and style of the lines. Download and give it a try! There are big movements
Was: $249 Now: $99 Market Profile defines a number of day types that can help the trader to determine market behaviour. A key feature is the Value Area, representing the range of price action where 70% of trading took place. Understanding the Value Area can give traders valuable insight into market direction and establish the higher odds trade. It is an excellent addition to any system you may be using. Inspired by Jim Dalton’s book “Mind Over Markets”, this indicator is designed to suit the
US30 Ninja is a 5 minute scalping indicator that will let know you when there is a trade set up (buy or sell). Once the indicator gives the trade direction, you can open a trade and use a 30 pip stop loss and a 30 pip to 50 pip take profit. Please trade at own own risk. This indicator has been created solely for the US30 market and may not yield positive results on any other pair.
Description : Rainbow EA MT5 is a simple Expert advisor based on Rainbow MT5 indicator witch is based on Moving average with period 34. The indicator is incorporated in the EA, therefore, it is not required for the EA to operate, but if you wish, you can download it from my product page . The Expert Advisor settings are as follows : Suitable for Timeframes up to H1
The parameters below can be set according to your trading rules. StopLoss ( Stop Loss in pips) TakeProfit ( Take Profit in pi
通过 mql5 和 Telegram 上 的晨间简报获取每日市场更新,包括详细信息和屏幕截图 ! FX Power MT5 NG 是我们长期以来非常受欢迎的货币强度计算器 FX Power 的下一代产品。 这款下一代强度计算器能提供什么?您所喜爱的原版 FX Power 的所有功能 附加功能 黄金/XAU 强度分析 更精确的计算结果 可单独配置的分析周期 可自定义计算限制,以获得更好的性能 为希望查看更多信息的用户提供特殊的多实例设置 无尽的图形设置,可在每个图表中设置您最喜欢的颜色 无数的通知选项,让您再也不会错过任何重要信息 采用 Windows 11 和 macOS 风格的全新圆角设计 神奇的移动指标面板
FX Power 主要功能 所有主要货币的完整强势历史 所有时间框架内的货币强弱历史 所有经纪商和图表的计算结果完全相同 100% 可靠的实时计算 -> 无重绘 可通过下拉列表选择分析时段
通过自定义模式单独配置分析时段 可在一个图表中使用多个实例 可移动 FX Power 显示屏(通过拖放) 适用于高分辨率 QHD、UHD 和 4K 显示器 自动终端配置 针对平板电脑
Step into the realm of Forex trading with confidence and precision using XQ, a cutting-edge Forex indicator designed to elevate your trading game to unprecedented heights. Whether you're a seasoned trader or just stepping into the world of currency exchange, XQ Forex Indicator empowers you with the insights and signals needed to make informed trading decisions. The signal conditions are a combination of three indicators, and XQ Forex Indicator only display medium and long-term trends . The ind
The Volume by Price Indicator for MetaTrader 5 features Volume Profile and Market Profile TPO (Time Price Opportunity). Get valuable insights out of currencies, equities and commodities data. Gain an edge trading financial markets. Volume and TPO histogram bar and line charts. Volume Footprint charts. TPO letter and block marker charts including split structures. Versatile segmentation and compositing methods. Static, dynamic and flexible ranges with relative and/or absolute visualizations. Lay
note: this indicator is for METATRADER4, if you want the version for METATRADER5 this is the link: https://www.mql5.com/it/market/product/108106 TRENDMAESTRO recognizes a new TREND in the bud, he never makes mistakes. The certainty of identifying a new TREND is priceless. DESCRIPTION TRENDMAESTRO identifies a new TREND in the bud, this indicator examines the volatility, volumes and momentum to identify the moment in which there is an explosion of one or more of these data and therefore the mome
Was: $299 Now: $99 Supply Demand uses previous price action to identify potential imbalances between buyers and sellers. The key is to identify the better odds zones, not just the untouched ones. Blahtech Supply Demand indicator delivers functionality previously unavailable on any trading platform. This 4-in-1 indicator not only highlights the higher probability zones using a multi-criteria strength engine, but also combines it with multi-timeframe trend analysis, previously confirmed swings
Gartley Hunter Multi - An indicator for searching for harmonic patterns simultaneously on dozens of trading instruments and on all classic timeframes: (m1, m5, m15, m30, H1, H4, D1, Wk, Mn). Manual (Be sure to read before purchasing) | Version for MT4 Advantages 1. Patterns: Gartley, Butterfly, Shark, Crab. Bat, Alternate Bat, Deep Crab, Cypher
2. Simultaneous search for patterns on dozens of trading instruments and on all classic timeframes
3. Search for patterns of all possible sizes. Fr
Golden Spikes Detector This indicator is based on an advanced strategy primarily for trading spikes on Boom and Crash Indices. Complex algorithms were implemented to detect high probability entries only. It alerts on potential Buy and Sell entries. To trade spikes on the Deriv or Binary broker, only take Buy Boom and Sell Cash alerts. It was optimised to be loaded on 5-minute timeframe although multiple timeframe analysis is done in the background. Features · Desktop pop up and sound
IX Power 终于将 FX Power 的无与伦比的精确性带到了非外汇交易符号中。
它能准确判断您喜爱的指数、股票、商品、ETF 甚至加密货币的短期、中期和长期趋势强度。
您可以 分析 终端提供的 一切 。试试吧,体验一下您在交易时如何把握 时机 。
IX Power 主要功能
100% 精确的非重绘计算结果 - 适用于您终端中的所有交易符号 下拉式选择预配置以及可单独配置的强度分析周期 通过电子邮件、消息和手机通知的无数种通知选项
可访问的 EA 请求缓冲区 可自定义计算限制,以获得更好的性能
为希望查看更多信息的用户提供特殊的多实例设置 无尽的图形设置,让您在每个图表中都能找到最喜欢的颜色
采用 Windows 11 和 macOS 风格的圆角新面板设计
神奇的移动指标面板,可在子窗口和主图表之间无缝移动 适用于高分辨率 QHD、UHD 和 4K 显示器,并针对平板电脑和触摸屏进行了优化
IX Power 参数 最重要的参数不言自明,但我们很快会在另一篇文章中为您提供所有 IX Power 参数的完整说明。
使用别名 "参数可为技术交易符号
The indicator very accurately determines the levels of the possible end of the trend and profit fixing. The method of determining levels is based on the ideas of W.D.Gann, using an algorithm developed by his follower Kirill Borovsky. Extremely high reliability of reaching levels (according to K. Borovsky - 80-90%) Indispensable for any trading strategy – every trader needs to determine the exit point from the market! Precisely determines targets on any timeframes and any instruments (forex, met
Bill Williams Advanced is designed for automatic chart analysis using Bill Williams' "Profitunity" system. The indicator analyzes four timeframes at once.
Manual (Be sure to read before purchasing)
Advantages
1. Automatically analyzes the chart using the "Profitunity" system of Bill Williams. The found signals are placed in a table in the corner of the screen.
2. Equipped with a trend filter based on the Alligator indicator. Most of the system signals are recommended to be used only accordi
The Trend Forecaster indicator utilizes a unique proprietary algorithm to determine entry points for a breakout trading strategy. The indicator identifies price clusters, analyzes price movement near levels, and provides a signal when the price breaks through a level. The Trend Forecaster indicator is suitable for all financial assets, including currencies (Forex), metals, stocks, indices, and cryptocurrencies. You can also adjust the indicator to work on any time frames, although it is recommen
Professional Scalping Tool on Deriv Attention! The indicator will be sold in limited quantities!!!
Description:
This trading indicator is designed for professional traders focused on scalping. Designed with the market in mind, it provides highly accurate spike trading signals. It works on the M1 timeframe and supports the following symbols: Boom 300 Index, Boom 500 Index, Boom 1000 Index, Crash 300 Index, Crash 500 Index, Crash 1000 Index.
Functional Features: - Direction: - Trading is ca
Quantum Heiken Ashi PRO 简介 Heiken Ashi 蜡烛旨在提供对市场趋势的清晰洞察,以其过滤噪音和消除虚假信号的能力而闻名。告别令人困惑的价格波动,迎接更流畅、更可靠的图表表示。 Quantum Heiken Ashi PRO 的真正独特之处在于其创新公式,它将传统烛台数据转换为易于阅读的彩色条。红色和绿色条分别优雅地突出了看跌和看涨趋势,让您能够以非凡的精度发现潜在的进入和退出点。
量子 EA 通道: 点击这里
MT4版本: 点击这里
这一卓越的指标具有以下几个关键优势: 增强清晰度:通过平滑价格波动,Heiken Ashi 金条可以更清晰地反映市场趋势,使您更容易识别有利的交易机会。 减少噪音:告别经常导致错误信号的不稳定价格变动。 Quantum Heiken Ashi 指标可过滤噪音,使您能够做出更明智的交易决策 无缝集成:Heiken Ashi 指标专为 MetaTrader 开发,可无缝集成到您的交易平台中。它用户友好、高度可定制,并且与您的其他交易指标和过滤器兼容 无论您是寻求新优势的经验丰富的交易者,
This is the MT5 version. Get Dual Onset MT4 here
It is an algorithm to detect trend changes early. You should try multiple values for the Multiplier parameter (1 <value <10 recommended). At first glance you can see effective entries. This is, in fact, one of the rows that Geleg Faktor initially had. But it was removed because it was no longer needed. The other rows were sufficient for G.Faktor's effectiveness, but I still wanted to share this one.
Always test before using it on your live
This is MT5 version Get Tunnel Warrens MT4 here
Here are several indicators that work together. It basically works with moving averages and various levels of ATR creating a dynamic channel through which the price is drained. As I always recommend, you should try it before using it in live so that you understand how it works. The market entry signal is similar to other MA indicators, but with this one you also have a graphical analysis of the moment when the trend is found and dynamic levels to
It is an algorithm to detect trend changes early. You should try multiple values for the Multiplier parameter (1 <value <10 recommended). At first glance you can see effective entries. This is, in fact, one of the rows that Geleg Faktor initially had. But it was removed because it was no longer needed. The other rows were sufficient for G.Faktor's effectiveness, but I still wanted to share this one.
Always test before using it on your live account so that you fully understand how it works and
Based on a combination of indicators, E13 Acid Fulx is an excellent indicator for knowing when to buy or sell on any asset and temporaryity. The indicator myself I have used it as a tool for my analysis when trading Forex. It is a useful and easy-to-understand trend indicator. If you combine it with your own analyses you will surely get a good result in your operation.
This is the MT5 version. Get Q-Math MT4 here
Check it out and if you like it just enjoy it. Try various values to find the setting that best suits your trading. Upward signal if the indicator is colored lawn green and bearish signal if the indicator is gray. You can use the line itself to trailing stop when you open orders. This is just a tool. A complement. It is not a strategy. Combine it with your own analysis Just download it and try it, it's free.
With this customizable indicator you will be able to observe other timeframes besides the usual one. This way you will get to know better the general environment in which the price moves and probably will be better your effectiveness. *It is important that the timeframe in the indicator is greater than that set in Metatrader. I'll share more indicators for free soon. If you have any specific ideas of an indicator that you want to have you can write me a private message directly. Opinions, review
Check it out and if you like it just enjoy it. Try various values to find the setting that best suits your trading. Upward signal if the indicator is colored lawn green and bearish signal if the indicator is gray. You can use the line itself to trailing stop when you open orders. This is just a tool. A complement. It is not a strategy. Combine it with your own analysis Just download it and try it, it's free.
Here are several indicators that work together. It basically works with moving averages and various levels of ATR creating a dynamic channel through which the price is drained. As I always recommend, you should try it before using it in live so that you understand how it works. The market entry signal is similar to other MA indicators, but with this one you also have a graphical analysis of the moment when the trend is found and dynamic levels to adjust your stop loss and take profit depending
Trading is about waiting for the right time. This indicator was created to know what is happening on our charts without having to cover the screen with indicators. In addition, it has several types of alerts that allow us to dedicate our time to other things until something interesting happens. You can use multiple alarms at the same time. It is not a problem.
By default AlterAlert offers us alerts when the following indicators give us a signal:
Moving average (MA crosses) Stochastic Oscill
Buy and sell signals using the MACD histogram. The interface is simple and easy to understand. You can perzonalize the indicator in several ways according to its visual style or even more importantly, its setting of parameters to detect market signals. Using the Multiplier option in the menu you can increase the indicator period although it is recommended to use the default settings.
Based on a combination of indicators, PS Acid Fulx is an excellent indicator for knowing when to buy or sell on any asset and temporaryity. The indicator myself I have used it as a tool for my analysis when trading Forex. It is a useful and easy-to-understand trend indicator. If you combine it with your own analyses you will surely get a good result in your operation.
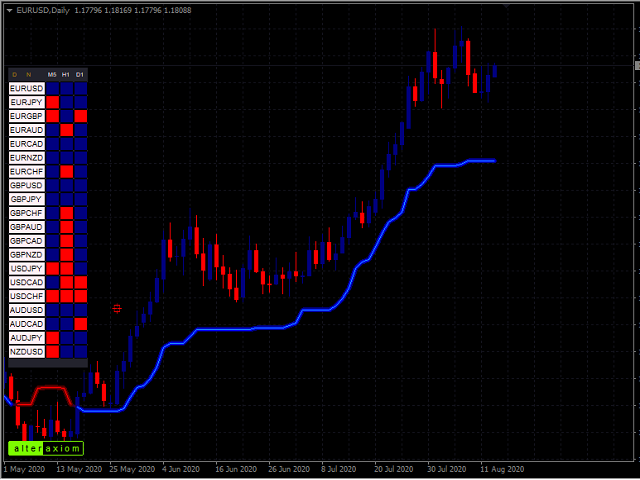
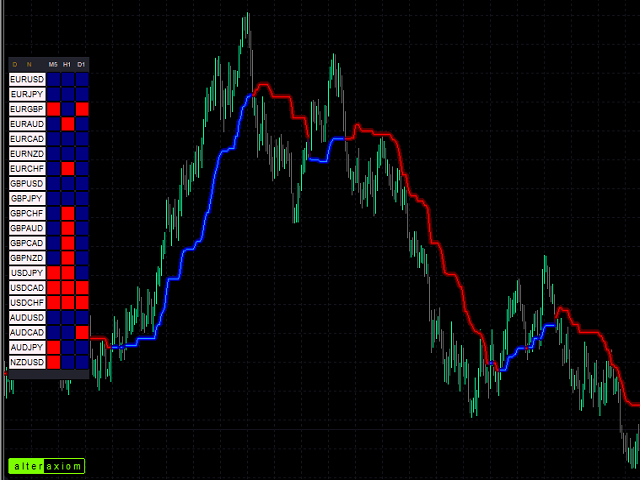
The new indicator is a trend predictor for the current chart as well as other symbols and timeframes. Every button on the board is interactive. By default, you have 20 currency pairs in the watchlist and three timeframes (M5, H1, D1) but you can choose the periods and symbols you want to display from the menu.
If the indicator is blue, it indicates the beginning of an uptrend. If it is red, it indicates the beginning of a downtrend.
In capture # 3 (Daylight mode) I will explain each element
Trading is about waiting for the right time. This indicator was created to know what is happening on our charts without having to cover the screen with indicators. In addition, it has several types of alerts that allow us to dedicate our time to other things until something interesting happens. You can use multiple alarms at the same time. It is not a problem. By default AlterAlert offers us alerts when the following indicators give us a signal:
Moving average (MA crosses) Stochastic Oscillat
It is a truly useful multifunctional tool. I did it thinking about my needs as a trader some years ago although I have been modifying it for my partners to use it.
This tool allows: Directly send buy or sell orders with one click and shows where you should place the stop loss based on an algorithm using ATR and comparison with previous significant levels.
Close all profits by clicking a button.
Close all losses by clicking a button.
Close all operations by clicking a button.
Show
This is the MT5 version. Get MT4 version here → https://www.mql5.com/en/market/product/52923
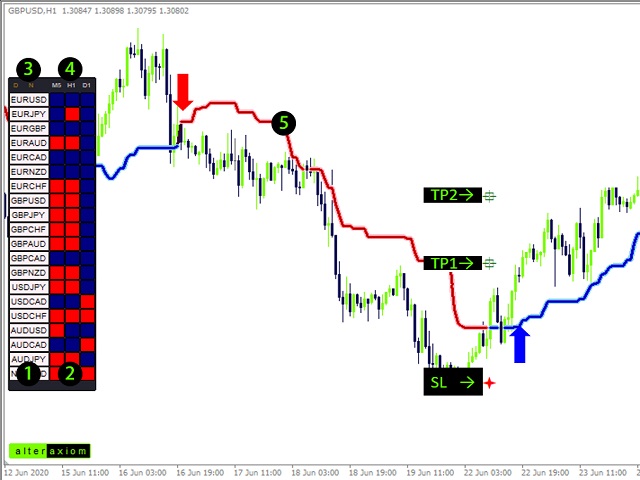
In the third screenshot (Daylight Mode) I have marked 7 elements that we are going to explain step by step.
1 Three buttons. a) Night Mode b) Daylight Mode c) Fix scale / Adjusted scale
2 Four buttons.
a) Draw a buy arrow, buy line and the corresponding Stop Loss based on ATR.
b) Close the previously drawn buy and drows a check mark.
c) Draw a sell arrow, sell line

用户没有留下任何评级信息