ExtremeTMALine
- 指标
- Vasilii Luchnikov
- 版本: 1.2
- 更新: 20 二月 2021
速度略有变化。 测试人员需要一个新的顾问,谁有兴趣,写信给我通过电子邮件777basil@mail.ru
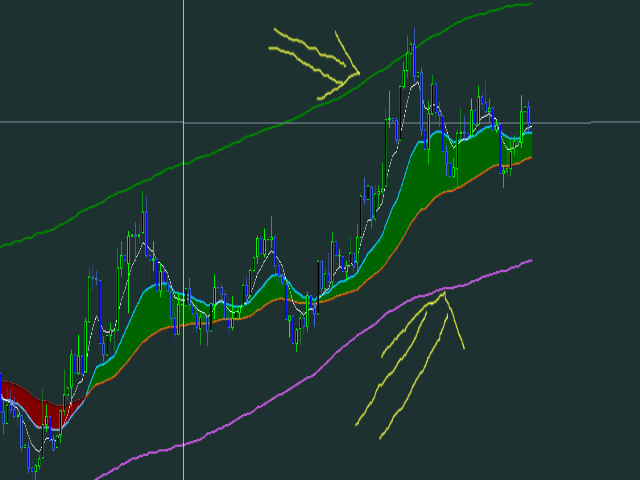
该指标基于历史价格变化计算,并以数学方式计算,每次再次接收数据时重新计算。 它可以在不同的时间框架上使用。 从70%的指标边界来看,价格运动或整合方向发生变化。 通过这种方式,您可以在趋势和通道中间从其边界进行交易。 最好在趋势交易中使用它来确定阻力位/支撑位。 在视频中,您可以看到指标是如何工作的:
https://youtu.be/UG2ZZEH9B_U 通讯联系人777basil@mail.ru 我们将为您的任务准备一个专家,一个指标。
该指标基于历史价格变化计算,并以数学方式计算,每次再次接收数据时重新计算。 它可以在不同的时间框架上使用。 从70%的指标边界来看,价格运动或整合方向发生变化。 通过这种方式,您可以在趋势和通道中间从其边界进行交易。 最好在趋势交易中使用它来确定阻力位/支撑位。 在视频中,您可以看到指标是如何工作的:


this is a wonderful indicator! Backtest, adjust and see for yourself. Thanks LiK’e INVEST!