SRP Pro Demo
- 指标
- Farhad Kia
- 版本: 1.0
- 激活: 5
Strong Retracement Points Pro demo edition!
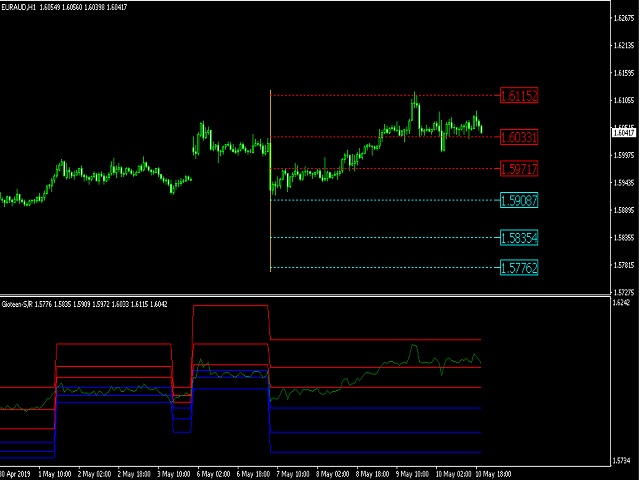
SRP (Strong Retracement/Reversal Points) is a powerful and unique support and resistance indicator.
It displays the closest important levels which we expect the price retracement/reversal!
If all level are broken from one side, it recalculates and draws new support and resistance levels, so the levels might be valid for several days depending on the market!
If you are still hesitating to start using this wonderful tool, you can check this link to see how effective and magical these levels are!
Using this demo version you can see SRP levels on EURUSD, GBPUSD and Bitcoin!
Key Features
- You can use it in all time-frames smaller than daily and bigger than M1!
- Displays closest significant support and resistance levels
- Update the levels if all levels are clearly broken
- The levels are time independent means that these levels are valid in all time-frames which make this indicator very unique!
- It can be very helpful as a complementary tool for your own trading system to adjust the stop-loss or take-profit, and can also be a helpful stand-alone tool for scalpers!
Extra Features in Pro edition
- Buffer - You can read levels easily by using these buffers
- History- in classic version you could only see the current valid levels, but in this version you can also see the previous levels in the indicator window!