• 概述
  • 评论
  • 评论
  • 新特性

PSI Position Smart Indicator

NEW check the FULL Version Including the private ICT tools limited so far until the release of the full 2016 Mentorship Core Content to the public.

Indicator type: Money Management Calculator; Forex Position Size Calculator; Fixed or ATR value for Stop Loss and Take Profit levels; Average Position Size Indicator (True Average Price); Account Information; Stop-out Level, Margin and Risk Exposure Warning, Forex Sessions; Institutional Levels Grid; Major Highs and Lows, Detailed Account Report and much more useful tools applicable both for Price Action or Algo Systems Strategies.

The tool is highly recommended if you participate in a Forex challenge or trade for a funded account as you can observe closely to not exceed your lot size exposure or daily draw-down requirements.

Some of the concepts provided by this tool are inspired by the Free YouTube Content of NNFX (No Nonsense Forex) and ICT (The Inner Circle Trader) Channels as well as some of the most popular funded programs and their requirements thus making it very useful and flexible for wide variety of users.

Be Smart! Calculate your position before you apply your strategy. Know where you are standing, what you are risking, what you put on the table and what you expect to gain. Do you know all that? Well don’t make wild guesses. Just know and be relentless!

The Position Smart Indicator indicator lets you chose risk parameters and calculates the maximum lot size you have to put in the trade plus many additional information panels with commission, swap, pip and point value, real risk taken, spread in points, value and % of the equity, the real average price of the position (accounts for commissions, swap and hedged trades), net result in deposit currency, pips or points and much more.

Among some of the features you can get from this indicator are:

  • The range and remaining time of the last candle.
  • Stop loss factor. Standard 1.5 times the ATR.
  • Take profit factor. Standard 1.0 times the ATR.
  • The current equity and allowed risk.
  • The maximum allowed lot size.
  • The pip and point value.
  • Spread in points, percentage from the equity and real value in deposit currency.
  • Swap and Commissions.
  • Buy Stop Loss, Buy Take Profit, Sell Stop Loss and Sell Take Profit.
  • It also presents commission, swap, the real risk and projected gain based on all hidden costs and maximum allowed lots.
  • The margin requirement for the trade.
  • You can add comments or motivational quotes to your screen or see the instrument description.
  • You can change the font face and size.
  • You can see your overall account equity, free and used margin.
  • You can choose which information panels to show and which to hide. It also lets you use a light version with only the most important information on the screen.
  • You can even use this indicator for trailing stop strategies and scaling out.
  • Average price line with the net position, the size, the net profit and the net distance to break-even.
  • All-time and Daily results, applicable also to Average price if needed.
  • Stop-out Level.
  • Size exposure.
  • Integrated risk and positional warnings.
  • Manual entry and Stop Loss, Take Profit, Risk to Reward calculations.
  • NY Open line and potential London High, Low target.
  • Forex Sessions.
  • Focus on Day of Week Price action.
  • Interactive buttons.
  • Multiple preset brokers and views.
  • ATR Strategies (NNFX).
  • ICT Killzones, Swings, etc. from the free ICT content.
  • Sophisticated Account Report.

Money management is the first and the most important skill you must learn in trading, especially in Forex. Don’t make the mistake anyone else does and learn it the hard way. Use your time and money wisely to acquire this skill.

With this indicator you will have anything you need to precisely position yourself and make smart decisions. If this is not very useful, detailed and pedantic then what is?

Important Note: If you want to test the Demo due to the fact that the MT4 Strategy Tester focus only on the current pair test on pair having your account currency as part of it. For instance open a Demo account in USD and test on EURUSD, GBPUSD, USDJPY, Gold, Silver, etc.

推荐产品
Noize Absorption Index MT4
Ekaterina Saltykova
5 (1)
Noize Absorption Index - is the manual trading system that measures the difference of pressure between bears forces and bulls forces. Green line - is a noize free index that showing curent situation. Zero value of index shows totally choppy/flat market.Values above zero level shows how powerfull bullish wave is and values below zero measures bearish forces.Up arrow appears on bearish market when it's ready to reverse, dn arrow appears on weak bullish market, as a result of reverse expectation. S
Laguerre SuperTrend Clouds adds an Adaptive Laguerre averaging algorithm and alerts to the widely popular SuperTrend indicator. As the name suggests, Laguerre SuperTrend Clouds (LSC) is a trending indicator which works best in trendy (not choppy) markets. The SuperTrend is an extremely popular indicator for intraday and daily trading, and can be used on any timeframe. Incorporating Laguerre's equation to this can facilitate more robust trend detection and smoother filters. The LSC uses the impro
TWO PAIRS SQUARE HEDGE METER INDICATOR Try this brilliant 2 pairs square indicator It draws a square wave of the relation between your two inputs symbols when square wave indicates -1 then it is very great opportunity to SELL pair1 and BUY Pair2 when square wave indicates +1 then it is very great opportunity to BUY pair1 and SELL Pair2 the inputs are : 2 pairs of symbols         then index value : i use 20 for M30 charts ( you can try other values : 40/50 for M15 , : 30 for M30 , : 10 for H1 ,
Owl smart levels
Sergey Ermolov
4.63 (54)
MT5版本  |  FAQ Owl Smart Levels Indicator   是一個完整的交易系統,包含   Bill Williams   的高級分形、構建正確的市場波浪結構的 Valable ZigZag 以及標記準確入場水平的斐波那契水平等流行的市場分析工具 進入市場和地方獲利。 策略的详细说明 指示灯使用说明 顾问-贸易猫头鹰助手助理 私人用户聊天 ->购买后写信给我,我会将您添加到私人聊天中,您可以在那里下载所有奖金 力量在於簡單! Owl Smart Levels   交易系統非常易於使用,因此適合專業人士和剛開始研究市場並為自己選擇交易策略的人。 策略和指標中沒有隱藏的秘密公式和計算方法,所有策略指標都是公開的。 Owl Smart Levels 允許您快速查看進入交易的信號,突出顯示下訂單的水平並向您發送有關已出現信號的通知。 優點很明顯: 清楚地顯示主要和更高時間框架的趨勢方向。 指示儀器信號的出現。 標記開單、止損設置和固定利潤的水平。 沒有多餘的,只有必要的結構! ZigZag   表示全球趨勢的方向,因此也表示貿易方向。 市場反轉點的短線清楚地表明在
这是一个预测蜡烛收盘价的指标。 该指标主要用于 D1 图表。 该指标适用于传统外汇交易和二元期权交易。 该指标可以用作独立的交易系统,也可以作为您现有交易系统的补充。 该指标分析当前蜡烛,计算蜡烛本身内部的某些强度因素,以及前一根蜡烛的参数。 因此,该指标预测市场走势的进一步方向和当前蜡烛的收盘价。 由于这种方法,该指标既适用于短期盘中交易,也适用于中长期交易。 该指标允许您设置指标在分析市场情况期间将产生的潜在信号的数量。 在指标设置中有一个特殊的参数。 此外,该指标可以通过图表上的消息、电子邮件以及推送通知的形式通知新信号。感谢您的关注!交易愉快! 购买后一定要写信给我! 我会给你我的交易指标的建议! 还可以获得奖金!
Quantum Heiken Ashi PRO MT4
Bogdan Ion Puscasu
4.43 (7)
介绍     Quantum Heiken Ashi PRO 图表 Heiken Ashi 蜡烛旨在提供对市场趋势的清晰洞察,以其过滤噪音和消除虚假信号的能力而闻名。告别令人困惑的价格波动,迎接更流畅、更可靠的图表表示。 Quantum Heiken Ashi PRO 的真正独特之处在于其创新公式,它将传统烛台数据转换为易于阅读的彩色条。红色和绿色条分别优雅地突出了看跌和看涨趋势,让您能够以非凡的精度发现潜在的进入和退出点。 量子 EA 通道:       点击这里 MT5版本:       点击这里 这一卓越的指标具有以下几个关键优势: 增强清晰度:通过平滑价格波动,Heiken Ashi 金条可以更清晰地反映市场趋势,使您更容易识别有利的交易机会。 减少噪音:告别经常导致错误信号的不稳定价格变动。 Quantum Heiken Ashi 指标可过滤噪音,使您能够做出更明智的交易决策 无缝集成:Heiken Ashi 指标专为 MetaTrader 开发,可无缝集成到您的交易平台中。它用户友好、高度可定制,并且与您的其他交易指标和过滤器兼容 无论您是寻求新优势的经验
The indicator displays the data of the Stochastic oscillator from a higher timeframe on the chart. The main and signal lines are displayed in a separate window. The stepped response is not smoothed. The indicator is useful for practicing "manual" forex trading strategies, which use the data from several screens with different timeframes of a single symbol. The indicator uses the settings that are identical to the standard ones, and a drop-down list for selecting the timeframe. Indicator Parame
MA Alignment Scanner
Benedict Jamora
5 (1)
This indicator scans and displays currency pairs that have recently aligned moving averages on a given timeframe. You can configure which pairs the indicator will scan. It also includes all types of alert options. Bullish MA Alignment =  MA1>MA2>MA3>MA4>MA5 Bearish MA Alignment =  MA1<MA2<MA3<MA4<MA5 Features Attach to one chart and scans all the currency pairs configured and visible in the Market Watch Window It can monitor all the available timeframes from M1 to MN1 and sends alerts on ever
斐波那契折返和扩展画线工具 适用于MT4平台的斐波那契折返和扩展画线工具,适合于使用黄金分割交易的交易者 优点:没有多余的线,没有过长的线,易于观察发现交易的机会 试用版: https://www.mql5.com/zh/market/product/35884 主要功能: 1.可以直接画出多组斐波那契折返,可以看出重要折返点之间的关系; 2.可以画出斐波那契扩展,比率有三种0.618,1,1.618 3.画出的斐波那契折返和扩展均可左右移动,有数值显示,方便观察 4.可通过数字键切换周期 使用指南和功能键: 1.按 [ 或R画折返,按需要画折返,最多云持8组折返; 2.按 ] 或E画扩展; 3.按 \ 删除当前周期下的所有扩展和折返,其余周期的不受影响 4.如何左右移动折返和扩展 (1)点击第一组折返的F5字符,可以左右移动折返; (2)点击COP的字符 ,可以左右移动扩展; 5. (1)点击第一组折返的F5字符,按del 可以删除这组折返; (2)点击COP的字符, 按del 可以删除这组扩展; 6.修改折返和扩展(随着市场的运行
Title : Market Bias Indicator - Oscillator-Based Trading Tool Introduction : Discover the potential of the "Market Bias Indicator," a revolutionary oscillator-based trading tool designed for precise market analysis. If you're in search of a robust alternative to traditional bias indicators, your quest ends here. Market Bias Indicator offers unparalleled accuracy in identifying market sentiment and is your gateway to confident trading decisions. Recommended Trading Pairs : Market Bias Indicator i
VR Cub
Vladimir Pastushak
VR Cub 这是获得高质量切入点的指标。该指标的开发是为了促进数学计算并简化对仓位入场点的搜索。多年来,该指标所针对的交易策略已被证明其有效性。交易策略的简单性是其巨大的优势,即使是新手交易者也能成功进行交易。 VR Cub 计算开仓点以及获利和止损目标水平,这显着提高了效率和易用性。查看使用以下策略进行交易的屏幕截图,了解简单的交易规则。 设置、设置文件、演示版本、说明、问题解决,可以从以下位置获取 [博客] 您可以在以下位置阅读或撰写评论 [关联] 版本为 [MetaTrader 5] 计算入场点的规则 开仓 要计算入场点,您需要将 VR Cub 工具从最后一个高点拉伸到最后一个低点。 如果第一个点在时间上早于第二个点,交易者等待柱线收于中线上方。 如果第一个点在时间上晚于第二个点,交易者等待柱线收于中线下方。 根据上述条件,严格在 柱线收盘 后建仓。 换句话说,如果我们在小时图上进行交易,那么从最高点到最低点的时间距离必须超过24小时,最高点和最低点之间的点数必须大于或等于平均价格变动每天。 维持和改变市场地位 可以有多个未平仓头寸;每个头寸都可以单独修改。 VR Cu
Forex Gump
Andrey Kozak
2.83 (6)
Forex Gump is a fully finished semi-automatic trading system. In the form of arrows, signals are displayed on the screen for opening and closing deals. All you need is to follow the instructions of the indicator. When the indicator shows a blue arrow, you need to open a buy order. When the indicator shows a red arrow, you need to open a sell order. Close orders when the indicator draws a yellow cross. In order to get the most effective result, we recommend using the timeframes H1, H4, D1. There
To get access to MT5 version please click here . - This is the exact conversion from TradingView: "Stochastic Momentum Index" By "UCSgears". - This is a popular version of stochastic oscillator on tradingview. - This is a light-load processing and non-repaint indicator. - Buffers are available for the lines on chart. - You can message in private chat for further changes you need. Thanks for downloading
The Th3Eng PipFinite indicator is based on a very excellent analysis of the right trend direction with perfect custom algorithms. It show the true direction and the best point to start trading. With StopLoss point and Three Take Profit points. Also it show the right pivot of the price and small points to order to replace the dynamic support and resistance channel, Which surrounds the price. And Finally it draws a very helpful Box on the left side on the chart includes (take profits and Stop loss
Heiken Ashi candle chart is an improved version of The Japanese candle chart, which can effectively filter the market "noise" of the Japanese candle chart. It is favored by many traders for its simplicity and intuition. For trend traders, the HA candle chart is a magic tool. Unlike the traditional Japanese candle chart, Heikenashi does not reflect the opening price, high price, low price and closing price of the market. Instead, Heikenashi calculates the value of a single K line in the dominant
HMA Trend Professional MT4
Pavel Zamoshnikov
4.63 (8)
Improved version of the free HMA Trend indicator (for MetaTrader 4) with statistical analysis. HMA Trend is a trend indicator based on the Hull Moving Average (HMA) with two periods. HMA with a slow period identifies the trend, while HMA with a fast period determines the short-term movements and signals in the trend direction. The main differences from the free version: Ability to predict the probability of a trend reversal using analysis of history data. Plotting statistical charts for analyz
Cosmic Diviner X Planet
Olena Kondratenko
4 (2)
This unique multi-currency strategy simultaneously determines the strength of trends and market entry points, visualizing this using histograms on the chart. The indicator is optimally adapted for trading on the timeframes М5, М15, М30, Н1. For the convenience of users, the indicator renders the entry point (in the form of an arrow), recommended take profit levels (TP1, TP2 with text labels) and the recommended Stop Loss level. The take profit levels (TP1, TP2) are automatically calculated for
Trendiness Index
Libertas LLC
5 (3)
"The trend is your friend" is one of the best known sayings in investing, because capturing large trendy price movements can be extremely profitable. However, trading with the trend is often easier said than done, because many indicators are based on price reversals not trends. These aren't very effective at identifying trendy periods, or predicting whether trends will continue. We developed the Trendiness Index to help address this problem by indicating the strength and direction of price trend
This is a new strategy for SUPPLY DEMAND areas It is based on a calculation using the tick volume to detect the big price action in market for both bear /bull actions this smart volume action candles are used to determine the supply and demand areas prices in between main supply and demand lines indicate sideway market  up arrows will be shown when prices moves above the main supply and the secondary supply lines Down arrows will be shown when prices moves below the main demand and the secondary
Master scalping M1
Nataliia Marchuk
Master Scalping M1 is an innovative indicator that uses an algorithm to quickly and accurately determine the trend.The indicator calculates the time of opening and closing positions, the indicator's algorithms allow you to find the ideal moments to enter a deal (buy or sell an asset), which increase the success of transactions for most traders. Benefits of the indicator: Easy to assemble, does not overload the chart with unnecessary information. Can be used as a filter for any strategy. Works on
Binary Option Signal
Yaroslav Varankin
Indicator for binary options arrow is easy to use and does not require configuration works on all currency pairs, cryptocurrencies buy signal blue up arrow sell signal red down arrow tips do not trade during news and 15-30 minutes before their release, as the market is too volatile and there is a lot of noise it is worth entering trades one or two candles from the current period (recommended for 1 candle) timeframe up to m 15 recommended money management fixed lot or fixed percentage of the depo
Gold Bricks FX Gold
Sayan Vandenhout
Gold Bricks FX USES THE TREND WAVE INDICATOR AND IT CAN IDENTIFY THE BEGINNING AND THE END OF A NEW WAVE TREND MOVEMENT. AS AN OSCILLATOR, THE INDICATOR IDENTIFIES THE OVERBOUGHT AND OVERSOLD ZONES. IT WORKS GREAT TO CATCH THE SHORT TERM PRICE REVERSALS AND USES A MARTINGALE STRATEGY TO CLOSE ALL TRADES IN PROFIT. USE DEFAULT SETTINGS ON H1 OR HIGHER TIME FRAME ON ANY PAIR FOR MORE ACCURATE TRADES WHY THIS EA : Smart entries calculated by 4 great strategies The EA can be run on even a
其中一个数字序列称为“森林火灾序列”。它被公认为最美丽的新序列之一。它的主要特点是该序列避免了线性趋势,即使是最短的趋势。正是这一属性构成了该指标的基础。 在分析金融时间序列时,该指标试图拒绝所有可能的趋势选项。只有当他失败时,他才会认识到趋势的存在并给出适当的信号。这种方法可以让人们正确地确定新趋势开始的时刻。然而,误报也是可能的。为了减少它们的数量,该指标添加了一个额外的过滤器。当新柱打开时会生成信号。在任何情况下都不会发生重绘。 指标参数: Applied Price - 应用价格常数; Period Main - 指标的主要周期,其有效值在 5 - 60 之间; Period Additional - 附加周期,此参数的有效值为 5 - 40; Signal Filter - 附加信号滤波器,有效值 0 - 99; Alerts - 启用后,指示器会在出现新信号时提醒您; Send Mail - 允许指标向电子邮件发送消息; Push - 允许您发送 Push 消息。
Blahtech Market Profile
Blahtech Limited
4.61 (18)
Was: $249  Now: $99   Market Profile defines a number of day types that can help the trader to determine market behaviour. A key feature is the Value Area, representing the range of price action where 70% of trading took place. Understanding the Value Area can give traders valuable insight into market direction and establish the higher odds trade. It is an excellent addition to any system you may be using. Blahtech Limited presents their Market Profile indicator for the MetaTrader community. Ins
ZhiBiCCI MT4
Qiuyang Zheng
5 (1)
【ZhiBiCCI】指标适合所有的周期使用,也适合所有的市场品种。 【ZhiBiCCI】绿色实线是逆转看涨背离。绿色虚线是经典的看涨背离。 【ZhiBiCCI】向红色实线是反向看跌背离。红色虚线是古典看跌背离。 【ZhiBiCCI】可以在参数里面设置(Alert、Send mail、Send notification),设置为(true)就可以发送即时信号到警报窗口、电子邮件、即时消息。 参数设置说明: 【displayAlert】:这是警报开关,设置成true,如果出现箭头就会自动警报提示;设置成false,则不会警报提示。 【sendmail_NO_OFF】:这是发送邮件的开关,设置成true,如果出现箭头就会发送邮件到你在MT4设置好的邮箱里面;设置成false,则不会发邮件。 【sendnotification_NO_OFF】:这是发送即时消息的开关,设置成true,如果出现箭头就会发送消息到你的移动设备;设置成false,则不会发消息。 更多好用的指标网址: https://www.mql5.com/en/users/zhengqiuyang/seller
An indicator of pattern #31 ("Long Island") from Encyclopedia of Chart Patterns by Thomas N. Bulkowski. The second gap is in the opposite direction. Parameters: Alerts - show alert when an arrow appears   Push - send a push notification when an arrow appears (requires configuration in the terminal) GapSize - minimum gap size in points ArrowType - a symbol from 1 to 17 ArrowVShift - vertical shift of arrows in points   ShowLevels - show levels ColUp - color of an upward line ColDn - color of
该指标自动计算并绘制斐波那契支撑位和阻力位 - 最有效的市场分析工具之一。 计算使用所选期间和时间范围的平均价格数据。此期间的最小值和最大值被视为运动的开始和结束。 斐波那契水平让您可以看到潜在的参考点,围绕这些点价格走势可以放缓或逆转,也就是说,它们用于预测进一步的走势,以及设置止损和限价单。 参数: PartsShow - 从当前柱状图显示的历史级别数 CalcPeriod - 价格平均周期 SmoothingMethod - 价格平均法(26 个选项) TF - 用于计算的时间范围 LevelColor - 水平线的颜色 ZeroLevelColor - 零级颜色 ShowVerticalLine - 启用/禁用水平之间的垂直线的显示 VLineStyle - 垂直线的样式 VLineColor - 垂直线的颜色 ShowInfo - 启用以标签形式显示有关级别百分比值的信息,否则以对象描述的形式显示 InfoFontSize - 信息字体大小 InfoColor - 信息字符串的颜色 FiboLevels - 显示水平的百分比值
KT Renko Patterns MT4
KEENBASE SOFTWARE SOLUTIONS
2.33 (3)
KT Renko Patterns scans the Renko chart brick by brick to find some famous chart patterns that are frequently used by traders across the various financial markets. Compared to the time-based charts, patterns based trading is easier and more evident on Renko charts due to their uncluttered appearance. KT Renko Patterns features multiple Renko patterns, and many of these patterns are extensively explained in the book titled Profitable Trading with Renko Charts by Prashant Shah. A 100% automate
Gvs Undefeated Trend   indicator is designed for trend and signal trading. This indicator generates trend signals.  It uses many algorithms and indicators to generate this signal. It tries to generate a signal from the points with the highest trend potential. This indicator is a complete trading product. This indicator does not need any additional indicators.  You can only trade with this indicator. The generated signals are displayed on the graphical screen.  Thanks to the alert features you ca
Trend PA
Mikhail Nazarenko
5 (3)
The Trend PA indicator uses   Price Action   and its own filtering algorithm to determine the trend. This approach helps to accurately determine entry points and the current trend on any timeframe. The indicator uses its own algorithm for analyzing price changes and Price Action. Which gives you the advantage of recognizing, without delay, a new nascent trend with fewer false positives. Trend filtering conditions can be selected in the settings individually for your trading style. The indicator
该产品的买家也购买
Gann Made Easy
Oleg Rodin
4.95 (44)
Gann Made Easy 是一个专业且易于使用的外汇交易系统,它基于使用先生理论的最佳交易原则。 W.D.江恩。该指标提供准确的买入和卖出信号,包括止损和获利水平。您甚至可以使用推送通知在旅途中进行交易。 购买后请联系我!我将免费与您分享我的交易技巧和丰厚的红利指标! 您可能已经多次听说过江恩交易方法。通常 Gann 的理论不仅对于新手交易者而且对于那些已经有一定交易经验的人来说都是非常复杂的东西。这是因为江恩的交易方法在理论上并不那么容易应用。我花了几年时间来完善这些知识,并将最好的原则应用到我的外汇指标中。 该指标非常易于应用。您所需要的只是将其附加到您的图表并遵循简单的交易建议。该指标不断进行市场分析工作并寻找交易机会。当它检测到一个好的入口点时,它会为您提供一个箭头信号。该指标还显示止损和获利水平。 换句话说,当您像先生一样进行交易时,该指标会为您提供最佳江恩建议。江恩亲自告诉你此时此刻该做什么。但最好的部分是您不需要了解任何有关江恩交易原则的知识,因为该指标会为您完成整个市场分析工作。
引入神奇外汇指标:释放精准交易的力量 你是否厌倦了寻找在所有时间框架上都能取得出色结果的完美外汇指标?别再继续寻找了!神奇外汇指标已经来到,改变您的交易体验,将您的利润推向新的高度。 神奇外汇指标基于尖端技术和多年的精心开发,堪称外汇市场上的强大和精确的巅峰之作。这个卓越的工具旨在满足各个层次的交易者需求,在追求持续盈利性方面提供无与伦比的优势。 神奇外汇指标的独特之处在于其无与伦比的适应性。无论您是日内交易者、波段交易者还是更喜欢长期持仓,该指标都经过优化,能在所有时间框架上取得出色的结果。然而,当在1小时时间框架上使用时,它的准确性和捕捉市场复杂走势的能力得到真正展示。 准备好对神奇外汇指标的准确性和可靠性感到惊讶。其先进的算法无缝结合了强大的指标、统计分析和趋势识别,实时为您提供全面的市场视图。指标的智能和动态信号使您能够自信地做出明智的交易决策,最大限度地提高获胜交易的机会。 不再犹豫和迷茫。神奇外汇指标消除了交易的猜测,使您在市场参与者中具有独特的优势。其用户友好的界面和直观的设计使得无论是经验丰富的专业人士还是初学者都能轻松掌握这一卓越工具的力量。 有了神奇外汇指标的支持,
目前八折优惠! 对任何新手或专家交易者来说都是最好的解决方案! 这个仪表板软件适用于28种货币对。它基于我们的两个主要指标(高级货币强度28和高级货币冲动)。它对整个外汇市场提供了一个伟大的概述。它显示高级货币强度值,货币运动速度和28个外汇对在所有(9)时间段的信号。想象一下,当你可以使用图表上的单一指标观察整个市场,以确定趋势和或剥头皮的机会时,你的交易将得到改善 我们已经在这个指标中建立了一些功能,使你更容易识别强势和弱势货币,同时识别和确认潜在的交易。该指标以图形方式显示货币的强势或弱势是增加还是减少,以及它在所有时间段的表现。 增加的新功能是动态市场斐波那契水平,它适应当前的市场条件变化,这是一个已经在我们的高级货币强度28和高级货币冲动指标中使用的成熟的加分项。 在交易时,总是将弱势货币和强势货币配对,这个新指标将帮助你做到这一点。 用户手册:点击这里  https://www.mql5.com/en/blogs/post/708783 特点  显示每个时间段的ACS28和GAP-speed(冲动)的货币强度值。 列:颜色代码以7种颜色
TPSpro RFI Levels
Roman Podpora
5 (13)
A key element in trading is zones or levels from which decisions to buy or sell a trading instrument are made. Despite attempts by major players to conceal their presence in the market, they inevitably leave traces. Our task was to learn how to identify these traces and interpret them correctly. Reversal First Impulse levels (RFI)   -  Version MT5                INSTRUCTIONS                 RUS                 ENG                                       R ecommended to use with an indicator   -  
TPSproTREND PrO
Roman Podpora
5 (15)
TPSpro TRENDPRO  - is a trend indicator that automatically analyzes the market and provides information about the trend and each of its changes, as well as giving signals for entering trades without redrawing! The indicator uses each candle, analyzing them separately. referring to different impulses - up or down impulse. Exact entry points into transactions for currencies, crypto, metals, stocks, indices!  -  Version MT5               DETAILED DESCRIPTION        /       TRADING SETUPS           
Atomic Analyst
Issam Kassas
5 (1)
首先值得强调的是,该交易指标是非重绘、非延迟的指标,这使其成为手动和机器人交易的理想选择。 Atomic Analyst是一种PA价格行动指标,利用价格的力量和动量来寻找市场上更好的机会。配备了高级过滤器,可帮助去除噪音和假信号,并提高交易潜力。使用多层复杂的指标,Atomic Analyst扫描图表,并将复杂的数学计算转化为任何初学者都能理解并用来做出一致交易决策的简单信号和颜色。 “Atomic Analyst”是专为新手和经验丰富的交易者量身定制的综合交易解决方案。它将高级指标和一流功能融合为一体的交易策略,使其成为所有类型交易者的多功能选择。 日内交易和剥头皮策略:专为快速准确的日内交易和短期交易而设计。 日内和摆动交易策略:可用作追求价格大幅波动的日内和摆动交易者的可靠工具。 多货币和市场:凭借其可靠的精度,在不同的工具和市场上运作。 多个时间框架:可在多个时间框架上使用,性能良好。 稳定性:所有指标均不重绘、不重绘和不滞后,确保可靠的信号。 信号清晰度:提供箭头信号,用于清晰的入场和出场点。 实时警报:通过交易入场、SL和TP警报通知交易者。 多个利润水平:使用
Advanced Currency Strength28 Indicator
Bernhard Schweigert
4.9 (662)
目前26%的折扣 任何新手或专家交易者的最佳解决方案! 这个指标是一个独特的、高质量的、可负担得起的交易工具,因为我们纳入了一些专有的功能和一个新的公式。只需一个图表,你就可以读出28个外汇对的货币强度!想象一下,你的交易将如何得到改善,因为你的交易是在你的手中进行的。想象一下,你的交易将如何改善,因为你能够准确地确定新趋势或剥头皮机会的触发点? 用户手册:点击这里  https://www.mql5.com/en/blogs/post/697384 这是第一本,原版的! 不要买一个毫无价值的崇拜者的克隆品。 特别的 子窗口中的箭头显示强劲的货币势头GAP将指导你的交易! 当基础货币或报价货币处于超卖/超买区域(外盘斐波那契水平)时,在个人图表的主窗口中出现警告信号。 当货币力量从外围区间回落时,回撤/反转警报。 十字星模式的特别警报 可选择多个时间框架,以快速查看趋势! 货币强度线在所有的时间框架中都非常平稳,当使用较高的时间框架来识别总体趋势,然后使用较短的时间框架来确定精确的入口时,效果非常好。你可以根据自己的意愿选择任何时间框架。每个时间框架都由其自身进
Scalper Inside PRO
Alexey Minkov
4.75 (55)
An exclusive indicator that utilizes an innovative algorithm to swiftly and accurately determine the market trend. The indicator automatically calculates opening, closing, and profit levels, providing detailed trading statistics. With these features, you can choose the most appropriate trading instrument for the current market conditions. Additionally, you can easily integrate your own arrow indicators into Scalper Inside Pro to quickly evaluate their statistics and profitability. Scalper Inside
Trend Screener
STE S.S.COMPANY
4.83 (86)
趋势指标,趋势交易和过滤的突破性独特解决方案,所有重要趋势功能都内置在一个工具中! 它是 100% 非重绘多时间框架和多货币指标,可用于所有符号/工具:外汇、商品、加密货币、指数、股票。 趋势筛选器是有效的指标趋势跟踪指标,它在图表中提供带有点的箭头趋势信号。 趋势分析器指标中可用的功能: 1.趋势扫描仪。 2. 具有最大利润分析的趋势线。 3.趋势货币强度计。 4. 带有警报的趋势反转点。 5. 带有警报的强趋势点。 6. 趋势箭头 每日分析示例,每日信号表现...等与我们的趋势筛选指标,可以在这里找到: 点击这里 限时优惠:Trend Screener Indicator 仅售 50 美元且终身可用。原价 125$) 通过访问我们的 MQL5 博客,您可以找到我们所有的高级指标以及分析示例、每日信号表现...等。 : 点击这里 我们的趋势系统由 2 个指标组成: 1. Trend Screener Indicator:显示趋势仪表盘、图表中的趋势线、入场点...等。 2. Trend Line Map Indicator:显示买卖作为仪表板,活动信号盈利/亏损
Quantum Trend Sniper Indicator MT4
Bogdan Ion Puscasu
4.59 (39)
介绍   量子趋势狙击指标 ,突破性的 MQL5 指标,正在改变您识别和交易趋势反转的方式!由拥有超过13年交易经验的资深交易员团队开发,     量子趋势狙击指标   旨在通过其创新的方式以极高的准确度识别趋势反转,将您的交易之旅推向新的高度。 ***购买量子趋势狙击指标,即可免费获得量子突破指标!*** 当量子突破指标识别出趋势反转时,它会向您发出警报和信号箭头,并建议您三个止盈水平。 它既适合新手交易者,也适合专业交易者。 量子 EA 通道:       点击这里 MT5版本:       点击这里 建议: 时间范围:  所有时间范围。为了获得最佳结果,我们建议在 M15、M30 和 H1 时间范围内使用它。 货币对:欧元兑美元、英镑兑美元、澳元兑美元、欧元兑英镑, EURAUD, XAUUSD 账户类型:ECN、Raw 或 Razor,点差极低 经纪时间:任意 经纪商:IC Markets、Pepperstone with Raw 和 Razor 的点差最低 建议止损:50 点 建议止盈水平:20 点、50 点和 1
TrendMaestro
Stefano Frisetti
5 (2)
note: this indicator is for METATRADER4, if you want the version for METATRADER5 this is the link: TRENDMAESTRO recognizes a new TREND in the bud, he never makes mistakes. The certainty of identifying a new TREND is priceless. DESCRIPTION TRENDMAESTRO identifies a new TREND in the bud, this indicator examines the volatility, volumes and momentum to identify the moment in which there is an explosion of one or more of these data and therefore the moment in which prices have strong probability of f
首先,值得强调的是,这个交易工具是非重绘、非重画和非滞后的指标,非常适合专业交易。 智能价格行动概念指标是一个非常强大的工具,既适用于新手,也适用于经验丰富的交易者。它将超过20个有用的指标合并到一个指标中,结合了高级交易思想,如内圈交易员分析和智能资金概念交易策略。该指标侧重于智能资金概念,提供有关大型机构交易方式的见解,帮助预测它们的动向。 它在流动性分析方面尤其擅长,有助于理解机构的交易方式。它擅长预测市场趋势,并仔细分析价格波动。通过将您的交易与机构策略对齐,您可以更准确地预测市场走向。该指标多才多艺,擅长分析市场结构,识别重要的订单区块,并识别各种模式。 它擅长识别BOS和CHoCH等模式,理解动量的转变,并突出显示供需强劲的关键区域。它还擅长发现强大的不平衡,并分析价格创造更高高点或更低低点的模式。如果您使用斐波那契回撤工具,该指标可以满足您的需求。它还可以识别相等的高点和低点,分析不同的时间框架,并通过仪表板显示数据。 对于使用更高级策略的交易者,该指标提供了工具,如公平价值差指标和优惠和折扣区域的识别。它特别关注高时间框架订单区块,并在较长时间框架内彻
Currency Strength Wizard
Oleg Rodin
4.91 (44)
货币强度向导是一个非常强大的指标,为您提供成功交易的一体化解决方案。该指标使用多个时间范围内所有货币的数据来计算这个或那个外汇对的力量。此数据以易于使用的货币指数和货币电力线的形式表示,您可以使用它们来查看这种或那种货币的力量。 您所需要的只是将指标附加到您要交易的图表上,该指标将向您显示您交易的货币的真实强度。该指标还向您显示买卖量压力的极值,您可以在顺势交易时利用这些压力。该指标还显示了基于斐波那契的可能目标。该指标可用于各种交易时间范围。该指标支持各种货币对的交易。 该指标为您提供所有类型的警报,包括推送通知。 购买后请联系我。我将与您分享我的交易技巧,并免费为您提供丰厚的红利指标! 祝您交易愉快,获利丰厚!
XQ Indicator MetaTrader 4
Marzena Maria Szmit
3 (2)
Step into the realm of Forex trading with confidence and precision using XQ, a cutting-edge Forex indicator designed to elevate your trading game to unprecedented heights. Whether you're a seasoned trader or just stepping into the world of currency exchange,   XQ Forex Indicator   empowers you with the insights and signals needed to make informed trading decisions. The signal conditions are a combination of three indicators, and XQ Forex Indicator only display  medium and long-term trends . The
使用我们的自定义MT4指标发现成功外汇交易的秘诀! 您是否曾经想过如何在外汇市场上取得成功,一贯赚取利润,同时降低风险? 这是您一直在寻找的答案! 允许我们介绍我们的专有MT4指标,该指标将彻底改变您的交易方法。 独特的多功能性 我们的指标专为喜欢Renko和Rangebar Candle编队的用户而设计。 我们了解到,这些图表类型受到许多经验丰富的交易者的青睐,这就是为什么我们的指标与它们无缝集成,从而提供无与伦比的市场分析。 清晰的趋势信号 忘记复杂的分析! 我们的指标利用鲜艳的色彩和清晰的点结构来明确指示市场趋势。 红色和蓝色的点毫无疑问地对价格变动的方向留下了疑问,从而可以在您的交易中快速决策。 与HH/HL HL/LL策略对齐 如果您正在寻求一个指标,该指标无缝地与基于HH/HL和HL/LL结构的策略无缝合作,则不需要更多。 我们的工具不仅确定了这些形式,而且还促进了它们在投资过程中的有效利用。 绝对的清晰度和简单性 我们的首要任务是为您提供一种不仅有效而且易于使用的工具。 我们的指标是为了清晰而设计的,使您可以专注于做出投资决策,而不是
Advanced Supply Demand
Bernhard Schweigert
4.92 (310)
现在优惠 33%! 任何新手或专业交易者的最佳解决方案! 该指标是一款独特、高质量、且价格合理的交易工具,因为我们已经整合了许多专有功能和新公式。 依据此更新,您将能够显示双重时间帧区域。 您不仅可以显示一个较高的时间帧,还可以同时显示图表时间帧,加上更高的时间帧:显示嵌套时区。 供需双方所有交易者都会喜欢它。 :) 重要信息披露 高级供需的最大潜力,请访问 https://www.mql5.com/zh/blogs/post/720245   想象您的交易如何得以改善,是因为您能够精准定位入场或目标位吗? 构建于新的底层算法,它可以更轻松地识别出买卖双方之间的潜在失衡。 这是因为它以图形方式展示供需最强劲区域,及其过去的表现(显示旧区域)。 这些功能旨在帮助您更轻松地发现最佳入场区域和价位。 现在您可以针对您的交易品种和时间帧来优化和编辑区域强度! 高级供需指标适用于所有产品和时间帧。 它是一个新的公式,非常新的功能是两个区域强度函数可由用户输入进行调整! 这在交易中是一大优势。 当您学习如何使用专有功能,例如带有价格游离最小 X 因子的区域强度时,您能够判断该区域强劲与否。 供
Quantum Breakout Indicator PRO
Bogdan Ion Puscasu
4.96 (26)
介绍     Quantum Breakout PRO   ,突破性的 MQL5 指标,正在改变您交易突破区域的方式!   Quantum Breakout PRO 由拥有超过 13 年交易经验的经验丰富的交易者团队开发,旨在通过其创新和动态的突破区域策略将您的交易之旅推向新的高度。 量子突破指标将为您提供带有 5 个利润目标区域的突破区域的信号箭头,以及基于突破框的止损建议。 它既适合新手交易者,也适合专业交易者。 量子 EA 通道:       点击这里 MT5版本:   点击这里 重要的!购买后请私信我领取安装手册。 建议: 时间范围:M15 货币对:GBPJPY、EURJPY、USDJPY、NZDUSD、XAUUSD 账户类型:ECN、Raw 或 Razor,点差极低 经纪商时间:GMT +3 经纪商:IC Markets、Pepperstone with Raw 和 Razor 的点差最低 规格: 不重漆! 最多 5 个建议利润目标区域 建议止损水平 可定制的盒子。您可以设置自己的 Box Time Start 和 Box Time E
Scalper Vault
Oleg Rodin
5 (27)
Scalper Vault 是一个专业的剥头皮系统,为您提供成功剥头皮所需的一切。该指标是一个完整的交易系统,可供外汇和二元期权交易者使用。推荐的时间范围是 M5。 该系统为您提供趋势方向的准确箭头信号。它还为您提供顶部和底部信号以及江恩市场水平。无论您拥有何种交易经验,该系统都易于使用。您只需要遵循简单的规则并每天重复该过程。 建议将此系统用于主要货币对。感谢您的关注! 请注意,该指标在策略测试器中可能无法正常工作。因此,我建议仅在模拟或真实账户的真实交易条件下使用该系统。 指示器提供所有类型的警报,包括推送通知。 购买指标后请与我联系。我将免费与您分享我的个人交易建议和出色的奖励指标! 祝您交易愉快,盈利!
FX Power MT4 NG
Daniel Stein
5 (8)
通过 mql5 和 Telegram 上 的晨间简报获取每日市场更新,包括详细信息和屏幕截图 ! FX Power MT4 NG 是我们长期以来非常受欢迎的货币强度计算器 FX Power 的下一代产品。 这款下一代强度计算器能提供什么?您所喜爱的原版 FX Power 的所有功能 附加功能 黄金/XAU 强度分析 更精确的计算结果 可单独配置的分析周期 可自定义计算限制,以获得更好的性能 为希望查看更多信息的用户提供特殊的多实例设置 无尽的图形设置,可在每个图表中设置您最喜欢的颜色 无数的通知选项,让您再也不会错过任何重要信息 采用 Windows 11 和 macOS 风格的全新圆角设计 神奇的移动指标面板 FX Power 主要功能 所有主要货币的完整强势历史 所有时间框架内的货币强弱历史 所有经纪商和图表的计算结果完全相同 100% 可靠的实时计算 -> 无重绘 可通过下拉列表选择分析时段 通过自定义模式单独配置分析时段 可在一个图表中使用多个实例 可移动 FX Power 显示屏(通过拖放) 适用于高分辨率 QHD、UHD 和 4K 显示器 自动终端配置 针对平板电脑
介绍 ON Trade Waves Patterns Harmonic Elliot Wolfe,这是一款高级指标,旨在使用手动和自动方法检测各种市场模式。以下是它的工作原理: 谐波模式: 该指标可以识别出现在您图表上的谐波模式。这些模式对于练习谐波交易理论的交易者非常重要,正如Scott Carney的书《谐波交易第1卷和第2卷》所描述的那样。无论您是手动绘制它们还是依赖自动检测,ON Trade Waves Patterns都可以胜任。 控制面板: 我们配备了一个用户友好的控制面板,它会保存您的图表和时间帧设置,使您可以轻松切换不同配置。您甚至可以最小化它以最大化图表空间。如果您更喜欢使用其他分析工具,只需单击关闭按钮即可隐藏所有指标数据。 模板保存: 当您自定义设置或添加其他指标,如移动平均线或布林带时,该指标会自动保存您的模板。这意味着您可以随时轻松加载您喜欢的设置。 优化显示: 对于Windows 10用户,我们建议调整您的DPI设置以获得高清设备上的最佳屏幕体验。右键单击MetaTrader图标,选择“兼容性”,然后选择“更改高DPI设置”,将其设置为“系统(增强)”。
PRO Renko System
Oleg Rodin
5 (24)
PRO Renko Arrow Based System for trading renko charts.  准确的信号交易任何外汇工具. 另外,我将免费提供系统的附加模块! PRO Renko系统是RENKO图表上高度准确的交易系统。该系统是通用的。 该交易系统可应用于各种交易工具。 该系统有效地中和了所谓的市场噪音,打开了获得准确反转信号的通道。 该指标易于使用,只有一个参数负责产生信号。 您可以很容易地使算法适应您感兴趣的交易工具和renko酒吧的大小。 我很乐意通过提供任何咨询支持来帮助所有客户有效地使用该指标。 祝您交易成功!购买后,立即写信给我! 我将与您分享我的建议和我的renko发电机。 另外,我将免费提供系统的附加模块!
Entry Points Pro
Yury Orlov
4.7 (224)
这是一款 MT4 的趋势指标,可提供准确的入场交易信号,且无重绘或延迟。 它可应用在任何金融资产:外汇、加密货币、贵金属、股票、指数。 最好的结果出现在 M15+ 的时间帧内。 指标的 MT5 版本 重要! 购买后请联系我,以便获取详细指南和奖励。 视频 (6:22) - 一个信号赢取的利润等于指标价格的三倍。 视频 (4:44) - 它如何在测试器中工作,我的提示和技巧。 视频 (1:44) - 有关它如何处理加密货币和指数的几句话。 大多数交易者在 Entry Points Pro 指标的帮助下,在第一个交易周内就改善了他们的交易结果。 Entry Points Pro 指标的益处 入场信号无重绘或延迟 如果信号出现,并得到确认(如果信号所在烛条已收盘),则它不会再消失;不像是重绘指标,它会导致重大的财产损失,因为它们可以在显示信号后再将其删除。 无差错开仓 指标算法可令您找到入场交易(买入或卖出资产)的理想时机,从而提高每位交易者的成功率。 Entry Points Pro 可操作任何资产 它允许您在 MT4 平台上交易任何经纪商提供的加密货币、股票、
Advanced Currency IMPULSE with ALERT
Bernhard Schweigert
4.91 (493)
目前31%的折扣!! 对任何新手或专家交易者来说都是最好的解决方案! 这个指标是一个独特的、高质量的、负担得起的交易工具,因为我们已经纳入了一些专有的功能和一个秘密的公式。只需一张图表,它就能给出所有28种货币对的警报。想象一下,你的交易将如何改善,因为你能够准确地确定新趋势或剥头皮机会的触发点 建立在新的基础算法上,它使识别和确认潜在交易变得更加容易。这是因为它以图形方式显示了一种货币的强势或弱势是否正在加速,并测量了这种加速的速度--把它想象成你汽车中的速度表。当你加速时,事情显然会发生得更快,这在外汇市场上也是一样的,即如果你配对的货币正在向相反的方向加速,你就会发现一个潜在的有利可图的交易。 货币动量的垂直线和箭头将指导你的交易! 动态的市场斐波那契23水平被用作警报触发器,将适应市场活动。如果冲动触及黄色触发线,您将在MetaTrader或您的电子邮件或推送警报中收到警报。然后你就知道作为一个交易员应该做什么。货币对和方向已经给出。只要点击警报按钮,就可以切换到该货币对或打开一个新的图表,以便进一步分析。警报级别可以通过用户输入来改变,可以选择3个敏感度级别
首先值得强调的是,这个交易系统是一个不重绘、不重画和不滞后的指标,这使它非常适合专业交易。 “智能支撑和阻力交易系统”是专为新手和经验丰富的交易者量身定制的先进指标。它赋予交易者在外汇市场上精确和自信的能力。这个综合系统结合了7+种策略、10个指标和各种交易方法,包括日内交易策略、波段交易策略、支撑和阻力策略、蜡烛图模式策略、VWAP策略、多时间段趋势策略等。它提供箭头信号、入场和出场点、交易警报、更高时间框架的趋势分析、实时交易监控以及见解深刻的趋势和成交量蜡烛染色。通过自动支撑和阻力检测,这是一个多面手的指标,帮助交易者在不同的市场条件下做出明智的决策。 “智能支撑和阻力交易系统”是一个强大的技术分析方法,融合了一套高端和强大的指标和工具。在其核心,这个系统识别关键的支撑和阻力水平,这些水平作为潜在市场反转或延续的关键区域。该系统无缝集成了多时间框架趋势面板,增强了交易者在不同时间框架下评估当前趋势方向的能力。此外,蜡烛图模式检测器扫描价格图表以获取重要的蜡烛图模式,为潜在的市场走势提供宝贵的见解。此外,VWAP(成交量加权平均价格)的加入帮助交易者评估市场情绪和日内趋势
TrendDecoder Premium
Christophe, Pa Trouillas
5 (2)
确定范围和下一步可能的走势   |  获得早期信号和趋势强度   |  在反转之前获得明确的退出   |  了解价格将测试哪些斐波水平 非重绘、非延迟指标 - 手动和自动交易的理想选择 - 适用于所有资产和所有时间单位 限时优惠 >>   50% OFF 购买后,  请联系我的频道  获取推荐设置 MT5   版本: 点击此处 使用   BladeSCALPER   和   PowerZONES   获取我们的完整方法 它是什么? TrendDECODER 集多种创新于一身,使趋势监测变得简单易行。 投射趋势线(Projective TrendLine)--快速参考即将到来的趋势 实时趋势线(RealTime TrendLine)与投射趋势线(Projective TrendLine)的对比 - 与之前的同方向走势相比,市场是加速还是放缓? 实时趋势线交叉 - 趋势正在偏离轨道 使用 GreyBox - 市场不再是趋势并进入新的过渡序列 使用 DecoderSignals 和 Blue/Orange Clouds - 利用作为动态支撑/阻力的 Blue/Orange
TakePropips Donchian Trend Pro
Eric John Pajarillaga Aldana
4.82 (17)
TakePropips Donchian Trend Pro   (MT4) 是一款功能强大且有效的工具,可使用 Donchian 通道自动检测趋势方向,并为您提供进场和退场交易信号! 这个多功能指标包括趋势扫描器、交易信号、统计面板、筛选器、交易时段和警报历史仪表板。它旨在为您提供交易信号并节省您分析图表的时间! 您可以在我们的博文中下载用户手册和安装指南:   https   :// www.mql5.com/en/blogs/post/751368 今天立减 50%!价格从 98 美元降到 49 美元! 您可以在 Strategy Tester 上测试该指标(启用可视模式)。如果您喜欢在实时图表上进行测试,也可以给我发消息以获取 7 天试用版。 视频教程也可在说明下方获得更多详细信息。 如果您有任何问题或需要任何帮助,请与我联系。 TakePropips Donchian Trend Pro 指标适用于所有外汇对、金属、商品、指数和加密货币。 主要特点 交易信号 - 检测多个时间范围内所有货币对的买卖机会。它将为您提供警报并在图表上绘制交易信号,最多 3 个止盈价和一个止
介绍 Zeus 指标:您的终极利润突破交易工具。 该指标简化了交易,消除了使用突破策略进行深入分析的需要。它会根据您预设的时间框架自动绘制区域,建议止损(SL)、获利点(TP)和跟踪止损水平。 当价格接近买入或卖出入场点时,Zeus 指标会迅速通知您并显示信号箭头。它还提供了四个不同获利点和各种跟踪止损选项的建议。 这个工具适用于初学者和经验丰富的交易者。 频道支持: 点击这里 商店 : 点击这里 MT5 版本: 点击这里 建议: 时间框架:M5 或 M15 货币对:与所有货币对兼容 帐户类型:与任何类型的帐户兼容 建议止损:使用 Zeus 指标提供的 SL 建议 建议获利点:使用 Zeus 指标的 TP 建议 规格: 根据您预设的时间框架自动绘制区域 自动建议买入和卖出入场点 自动建议跟踪止损以保护利润 自动且易于看到的止损和获利点 包括警报通知 提供用于回测结果的面板 为每个货币对提供可自定义选项 能够调整区域边界以满足每个货币对的具体需求 以及更多功能! 联系方式: 如果您有任何问题或需要帮助,请随时通过私信与我们联系。
FX Volume
Daniel Stein
4.6 (35)
通过 mql5 和 Telegram 上 的 " 晨间简报 "获取每日市场更新,包括详细信息和屏幕截图 ! 外汇交易量(FX Volume)是第一个也是唯一一个从经纪商角度真正洞察市场情绪的交易量指标。 直接在您的图表上看到这些信息是真正改变游戏规则和突破性的交易解决方案。 受益于独特的市场数据洞察,如 比率(Ratios )显示货币多头和空头头寸的比率(百分比 比率变化 显示所选时间段内的多头比率及其百分比变化 总交易量 显示货币的总交易量(多头和空头),以手为单位 多头 交易量显示货币所有多头头寸的交易量 空头 交易量显示所有货币空头头寸的交易量 净多头 显示净多头交易量,即所有多头头寸减去所有空头头寸(以手为单位)。 净多头百分比 显示货币净多头交易量的变化 请阅读我们的基本教程 -> "如何使用外汇交易量进行交易 " 获取更多信息,如常见问题、交易技巧和教程视频,请访问我们的 外汇交易量公共信息频道 请 安装并运行 SI Connect 以建立与我们数据中心的持续连接 背景信息 我们都知道,外汇是一个分散的市场。这就是为什么我们必须打破常规思维,开发一个独
Cycle Sniper
Elmira Memish
4.41 (34)
NEW YEAR SALE PRICE FOR LIMITED TIME!!! Please contact us after your purchase and we will send you the complimentary indicators to complete the system Cycle Sniper is not a holy grail but when you use it in a system which is explained in the videos, you will feel the difference. If you are not willing to focus on the charts designed with Cycle Sniper and other free tools we provide, we recommend not buying this indicator. We recommend watching the videos about the indiactor and system before pu
Trend Forecasting
Mohamed Hassan
5 (11)
This indicator is unstoppable when combined with our other indicator called Katana . After purchase, send us a message and you could get Katana  for FREE as a BONUS!  You can also ask to join our private group where we discuss together with other members!  MT5 version: click here There are limited copies available at $45 (3 copies left). Next price is $99. Don't miss this great deal!  The Trend Forecasting indicator is a very unique & easy tool that is able to make prediction a
作者的更多信息
ICT Core Content Concepts turned into indicator plus all previous tools known from the  Position Smart Indicator . This makes it the Full PSI Private Version ( read more ) restricted up to now but available only after the Mentorship Core Content was made public on   YouTube. You will find many price action study tools like: Central Bank Dealing Range - CBDR Asian Range FLOUT Profiles and SD targets on the CBRD, Asian Range and Flout both on the   wicks   and on the   bodies Seek & Destroy   Prof
PSI  Close by Hedge script closes out balanced trades. It is much more easier and cost efficient to use hedges (limit order by the One Click Trading) to partially exit at better prices. As you get filled and control you break even price and net position with PSI Average Price  the script will close the positions from oldest to newest. It also prints valuable information in the Expert tab about the overall position before and after the script. You can chose to cancel automatically any remaining
FREE
PSI  SL/TP script adds preset Stop Loss or Take Profit levels on all naked positions with just one click. It is easier then to modify and drag the levels with the One Click Trading. Additional settings and warnings especially if you put too tight Stop Loss in comparison to the spread. Check out also the   Position Smart Indicator  - a powerful Money Management tool (and much more) both useful for Price Action and Algo traders . NEW check the FULL Version Including the private ICT tools limited
FREE
PSI  SL/TP script (defaulted to points and Print MSG) adds preset Stop Loss or Take Profit levels on all naked positions with just one click. It is easier then to modify and drag the levels with the One Click Trading. Additional settings and warnings especially if you put too tight Stop Loss in comparison to the spread. Check out also the   Position Smart Indicator  - a powerful Money Management tool (and much more) both useful for Price Action and Algo traders . NEW check the FULL Version Incl
FREE
PSI  Cancel Pending script deletes pending positions. Check out also other free PSI scripts and indicators like adding Stop Loss , Take Profit Levels , closing Hedged Orders , Average Price , etc. Check out also the   Position Smart Indicator   - a powerful Money Management tool (and much more) both useful for Price Action and Algo traders . NEW check the FULL Version Including the private ICT tools limited so far until the release of the full 2016 Mentorship Core Content to the public. It has
FREE
PSI tools delivers new special look aimed to bring Detailed Account Statement for all important statistics. The integrated MT4 is not accurate. It does not account correctly for Deposits, Withdrawals and completely ignores cases like hedged trades, break-even trades, other broker related credits, bonuses and so on events and as a result all statistics like draw-down, total trades, average win size, rate and so on are totally skewed. PSI corrects these mistakes. In the example below a demo accou
ICT Core Content Concepts turned into indicator plus all previous tools known from the  Position Smart Indicator . This makes it the Full PSI Private Version ( read more ) restricted up to now but available only after the Mentorship Core Content was made public on   YouTube. You will find many price action study tools like: Central Bank Dealing Range - CBDR Asian Range FLOUT Profiles and SD targets on the CBRD, Asian Range and Flout both on the   wicks   and on the   bodies Seek & Destroy Profil
PSI tools   delivers new special look aimed to bring Detailed Account Statement for all important statistics. The integrated MT4 is not accurate. It does not account correctly for Deposits, Withdrawals and completely ignores cases like hedged trades, break-even trades, other broker related credits, bonuses and so on events and as a result all statistics like draw-down, total trades, average win size, rate and so on are totally skewed. PSI corrects these mistakes. In the example below a demo acc
This is the MT5 version of the absolute OCD tool that delivers Position Size Calculator and many more other options of the matured  PSI Position Smart Indicator NEW check the FULL Version Including the private ICT tools limited so far until the release of the full 2016 Mentorship Core Content to the public. Indicator type: Money Management Calculator; Forex Position Size Calculator; Fixed or ATR value for Stop Loss and Take Profit levels; Average Position Size Indicator (True Average Price); Acc
筛选:
无评论
回复评论
版本 8.1 2023.10.02
Error comments typo fix for No Trades Yet.
版本 8.0 2023.01.28
Added the Current or the Last created (Mutable) Fractal.
版本 7.9 2023.01.28
Better Intermediate Highs and Lows fractals representation.
版本 7.8 2023.01.26
Sessions update.
版本 7.7 2023.01.26
Session's duration tooltip check improvement.
版本 7.6 2023.01.26
Added three more versions V7,V8,V9 (same as V1 for labels) but are used for quick AVR Price settings control:
- AVR Price on Open Positions including Add All Past Trades
- AVR Price on Open Positions including Current Day's Closed Trades
- AVR Price on Open Positions including only Manual Past Closed P/L (if any submitted)
版本 7.5 2023.01.08
Added another quick change version between full extended report and light version with just core report statistics plus other improvements.
版本 7.4 2022.12.28
Fixed and rearrange sections in Report.
版本 7.3 2022.12.28
Added ability to change AVR Holding time in Hours, Minutes or Seconds and calculate it based on the selected aggregation method by Position, Daily Sessions, Weekly and so on into the Detailed Report Tool.
版本 7.2 2022.12.26
Typos correct in parameters and explanations. Renamed Partials to Positions.
版本 7.1 2022.12.18
Discover a new powerful Accounting Tool that gives you ability to consolidate the trades correctly and the way you want them to be presented as a singular trade idea. You could do such consolidations based on Daily, Weekly, Monthly and so on. Total of 8 unique consolidation options. Each of them helps the traded to focus on his style rather than a single complimentary partials or hedge trades that clutters the report and make able to see his total and meaningful Daily performance or Monthly, etc.
Additionally this version gives choice to hide sensitive information for the account from the main view.
版本 7.0 2022.12.14
Few tweaks including buttons' click skip when certain range or session selection is not applicable due to higher time frame. Typical overlays are targeted for H1 or lesser timeframes.
版本 6.9 2022.12.08
Indicator Facelift. Newer settings explanations sections, no lag response on buttons control plus many more functionalities for the Account Report function on top of the extract report like customizable Risk dial up or dial down suggestions, etc.
版本 6.8 2022.11.22
Reduced Alarm frequencies when parameters are wrong and need to be fixed.
版本 6.7 2022.11.16
Renamed ICT Swing Fractals.
版本 6.6 2022.02.08
Day of Week update on M1.
版本 6.5 2022.02.07
Account with no trades Average Holding Time fix.
版本 6.4 2022.01.08
Font change.
版本 6.3 2022.01.08
Few improvements on lines like the NY Midnight and London Judas Swing ICT lines.

Few more stats and improvements on the Detail Report most important of them is new capability of addressing partial closes.

Let say you entered a trade and you took 5 partial profits until you close it. In the end the MetaTrader 4 will report that as 5 small wins but in reality that is one larger win and thus MetaTrader 4 skews the results of your actual win to lose statistics. It makes your profit percentage unrealistically much higher and our profit to loss ration much worse.

The PSI Detail Report fixes that as much as possible. Since closed orders in the MetaTrader 4 are followed not by entry point but by ID when opening and closing multiple partials of different positions at the same time if the order is not followed ideally it will stack most of the partials together but not all. To help whit that you can use the focus on particular pair Report.

Ideally focusing only on one trade idea at the same time and especially using the PSI Close By Hedge script and using the PSI Detail Report capability fixes all of these problems.

Let say you open a trade and it goes against you so you close 50% partial to reduce risk. Then it turns positive and you close 25% partial on profit and let the rest run. You close the rest on higher profit and making break even, smaller loss or a profit for the day in the end MetaTrader 4 will report that in the statement as if you had 1 loss and 2 smaller wins for the day when in realty this is just one single trade idea. It is just 1 win or just 1 break even or just 1 small loss trade which is a combination of 3 partial closes - 1 partial loss and 2 partial wins.
版本 6.2 2021.09.21
Additional distance multipliers to chose from when your screen resolution makes rows and buttons too stacked together on the default settings.
版本 6.1 2021.09.10
Added alert if you enter a Simulated Amount which less than the actual Absolute Drawdown for the Reporting tools.
版本 6.0 2021.09.10
Added Alert on section XV if wrong Symbol is entered for the focused on particular symbol Account Report.
Added also to the Report Average Consecutive Profit or Loss statistic.
版本 5.9 2021.09.05
Added more color auto-fixes if it happens to plot the indicator on a chart with a matching background.
版本 5.8 2021.09.05
Edit the Error Message regarding Symbol Suffix when applicable.
版本 5.7 2021.09.05
Added Error Alerts for wrong Parameter Input.
版本 5.6 2021.09.02
Added option for Offline Money Balance which affects the Account Report as well as the Risk.

Essentially you can deposit let say 40% of your money at the broker but evaluate your risk and your performance as if you have deposited all your dedicated money at the broker.

However the risk is still limited to the free margin available (and the safety margin option). So Performance is calculated based on the Total Balance. Risk is also calculated based on the Total Balance but also limited on the accrual broker plus self-imposed margin restrictions as per the Account Equity available at the broker.
版本 5.5 2021.08.29
Improvement on the Swing Fractals. Focus more on the Intermediate Swings. Option for all Swings remains.
Intermediate Swing High has a Lower High to the left and a Lower High to the right.
Intermediate Swing Low has Higher Low tho the left and Higher Low to the right.
版本 5.4 2021.08.27
In addition to the Account Report there is an option to totally ignore any Transfers (Deposits, Withdrawals, Broker related funds) and just focus on the statistics with Simulated Starting Amount.
It works also in conjunction with focusing option on a particular pair only.
版本 5.3 2021.08.26
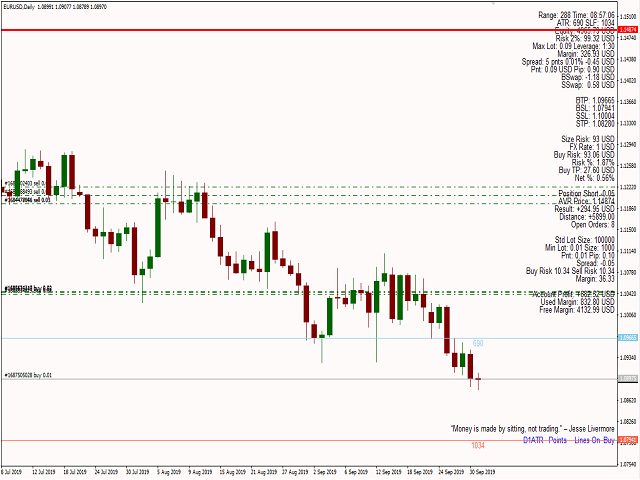
Latest version of the PSI tool delivers new special look aimed to bring you Detailed Account Statement for all important statistics. The integrated MT4 is not accurate. It does not account correctly for Deposits, Withdrawals and completely ignores cases like hedged trades, break-even trades, other broker related credits, bonuses and so on events and as a result all statistics like draw-down, total trades, average win size, rate and so on are totally skewed. PSI corrects these mistakes. In the example below a demo account was aimed to represent such case. The Maximal and Relative Draw-down according to MT4 were whooping 44% while the majority of this draw-down was achieved at time when the account was more then 10 times bigger after a huge deposit. So in a effect all trades were partitioned by their contribution at the account current state. So in reality the draw-down was much smaller in % terms at all times. In addition there are other tools and statistics. Like holding time, consecutive trades, two nearest Peaks and latest recovery against them. This is useful if you follow ICT recommended MM tactics to dial down risk after a loss and dial up only if you recover at least 50% of the latest drop in equity. You can also target the Report for only one specific instrument and ignore others or add or subtract amounts from the balance to fit your specific needs. Let say you deposited only 20% of your dedicated money at the broker and leave the rest at your account but you trade as if you deposited them fully. So with this indicator your account statistics will be based on the full dedicated amount not what is shown in MT4.
版本 5.2 2021.08.11
New cool features and more options for customizations. Now the tool can plot fractals based on the ICT inspired swings on 3 consecutive candles study.
版本 5.1 2021.08.04
New cool look for the lines study option. They are now 5 different views to chose from the Lines Button and several customizations on each one:
1) Lines On - Custom view;
2) Lines Horizontal;
3) Trend Lines - you can select how far they stretch in future price and their different style from horizontal lines.
4) Trend Lines Ray - automatically stretch the trend lines all the way to the right (Ray function);
5) Lines Off;
版本 5.0 2021.07.30
Another cool update. Now with just one button you can scroll through Off mode, favorite Version 1 and Version 2 plus two more special versions that focus more on open positions management rather than risk parameters on new ones.
版本 4.9 2021.07.28
Small fix on short orders not showing exposure when a stop loss is not applied.
版本 4.8 2021.07.28
Improvement on the Forex Sessions and the Day on Focus ranges.
版本 4.7 2021.07.27
Added ability to plot the Forex Session range on the candle bodies instead of wicks.
版本 4.6 2021.07.27
Added more custom sessions. ICT inspired Killzones.
Added range labels for all sessions as well as other tool-tip descriptions for each plotted line or tool.
Added special button layout with minimum names and space taken.
Divided the tool different options in categories with most frequently changed options on top for better use and customization.
Each category has basic explanation and credits the popular and original source for its inspiration. Research on these is recommended.
版本 4.5 2021.07.19
Added button for easy switch between primary and secondary favorite display options.
Added On/Off button to hide and to display the selected options. Useful if for a moment the user wants to hide the labels for more chart area.
Added additional days for the Vertical Line on a custom delineating period. Usually the analysis is done on the New York midnight open (default).
版本 4.4 2021.07.15
Added Vertical Line for the NY Midnight Open or any custom period.
版本 4.3 2021.02.06
Corrected typo in text.
版本 4.2 2021.02.06
New abilities like:
- add dividends for past performance results;
- new other options for Allowed Margin tolerance on new trades;
- display spread as percentage from the current candle range;
版本 4.1 2020.10.09
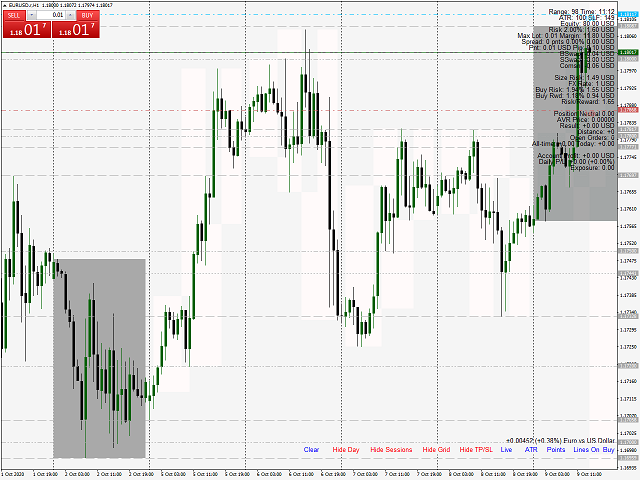
Added buttons for ON/OFF Forex Sessions as well as Focus ON/OFF on a specific Day of the Week.

Let say you want to visually compare and highlight the price action for the last few Friday sessions. On D1 time-frame candles are pointed with arrows.
版本 4.0 2020.10.08
Optimization.
版本 3.9 2020.10.08
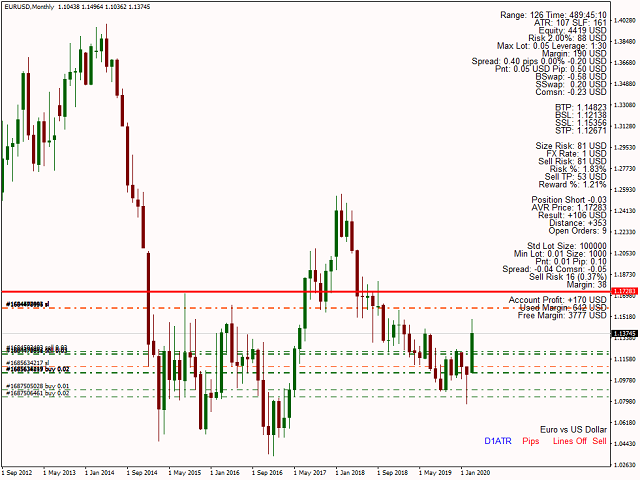
Added ability add more then one Previous Day's High and Low Lines.

Added Day of week to charge 3 days swap rollover.

版本 3.8 2020.10.07
Added auto map of major Highs and Lows for the past and current month and week.

Grid line on common institutional levels Zero, 50 plus 20 and 80 level.

New York Open Price (price during Midnight hour of NY Time) and Potential 33 pip target for a London High on a Bearish Bias Day or vice versa.

Manual Stop Loss, Take Profit targets and Manual Entry price for Money Management simulation on the outcome.

Added Clear Button to clear the Chart from manually drawn objects (or by changing the time frame). In order to keep your objects rename them after creating (maybe just add some prefix).

PSI is not only just an MM tool but has lot's of options to work with from a Price Action stand point of view or an Algo trading.

Added additional preset Brokers.
版本 3.7 2020.06.04
Added FTMO.
版本 3.6 2020.05.21
Added optional Previous Day High and Low lines as possible guidance about liquidity targets.
版本 3.5 2020.05.21
Added Forex Sessions. You can enable Asian, London and New York Session or some custom session you want to watch out for patterns or time of day you want to focus in trading. Adjust the open and close hours depending on local and server time, DST and so on. You can add or subtracts hours depending which you are interested the most.
版本 3.4 2020.05.03
Added two more optional and more optimal views and warning about exposure limits. Especially useful for proprietary accounts.
版本 3.3 2020.04.29
In some OS and MT4 resolutions the rows and buttons are too stacked together and ruin the visualization. To address that a fix adds font and buttons distance multiplier to separate them nicely.
版本 3.2 2020.04.25
Added buffer for the ATR so you can hover over candles and see the ATR value in the Data Window without the need of external ATR indicator.

Also note that the Break-even Stop Loss to be considered eligible to free protected lots from the total exposure has to be at least 1 point positive. Not exactly as the Entry price.
版本 3.1 2020.04.24
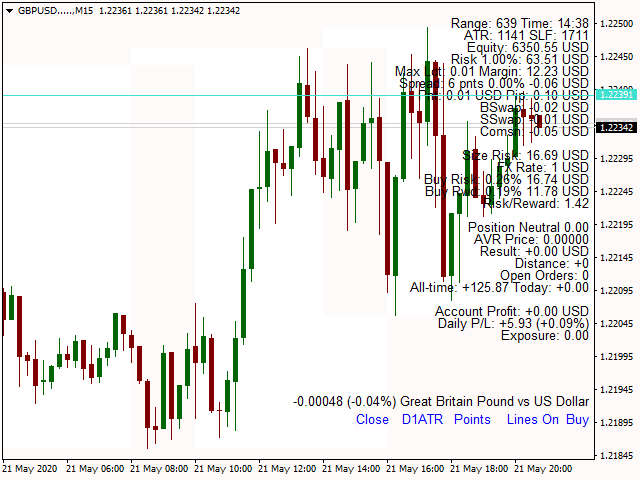
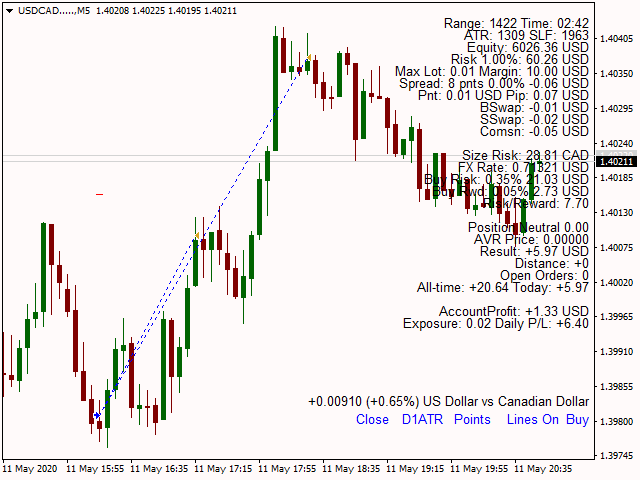
Added current Exposure in Lots. Orders that are protected with at least Break-Even Stop Loss are not counted to the total exposure. This is useful if you have set exposure limits that you shouldn't exceed. Very needed if you trade for propriety account with risk parameters.

Also added the Daily P/L for all instruments.

The average price can be affected by the all-time result in the current instrument, only by today's result and also adding additional custom result.

Added additional broker to the mix.
版本 3.0 2020.04.16
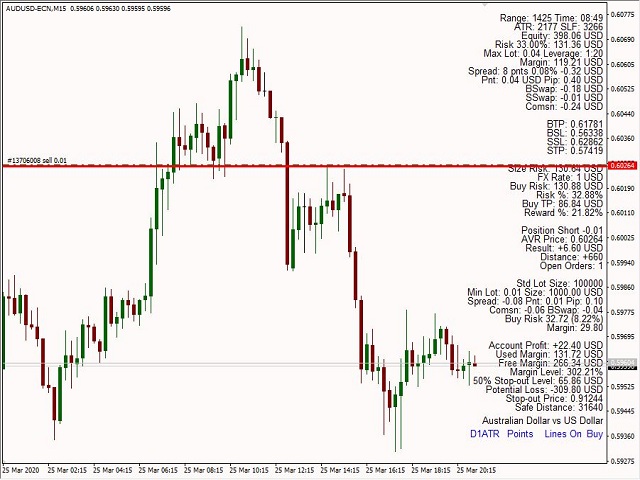
Fix for the Stop-Out price when the Average Price Level is altered through usage of result achieved by today's closed trades or by the manually entered mount (or sum of both).
版本 2.9 2020.04.14
Added information with All Time results on the current instrument and only closed trades from today - Today's Profit or Loss. Ability to automatically include today's results into the Average Price and Average Result. Still the Average Price can be adjusted with custom amount instead of that.

All that is great for Hedging positions.
版本 2.8 2020.04.14
Added daily gains for the instrument within the symbol description.
版本 2.7 2020.04.07
Now you can add custom Profit or Loss amount of previous close trades for instance to adjust the AVR Price Level and AVR Result.

This is useful if you hold a position but you have already closed few hedges and you want to know the real AVR Level based on the relative trades you want to include not only by the current open orders.
版本 2.6 2020.04.06
Now you can set a Maximum Allowed Lot Size when your Risk Profile allows you more than you actually want at the moment. This way you can limit your size without the need of reducing your Risk Profile just to do that.
版本 2.5 2020.04.01
Small fix on the maximum allowed lot size on NGAS allowing less than the minimum lot size (for rare instruments with size step 1).
版本 2.4 2020.03.31
Simple color change.
版本 2.3 2020.03.30
Added warning if the current entry based on last candle closed prices or Manual ATR entry is not valid due the fact priced moved so much that it already hit Stop Loss or Take Profit levels.
版本 2.2 2020.03.29
Added new functionalities.

Among them warnings if Margin Requirements are exceeded or when preset Margin Level is Reach for new position. This means the Risk should be lower to lower the Position Size. Either by lowering the Risk or manually prefer lower ATR.

Added new button for ATR Stop Loss and Take Profits calculated based on the Live Prices or much better on the last candle Closed price.

Close means that the referential price for entry is the last candle close. This gives advantage to enter in much better risk to reward ratios (if you delay your entry for some reason) and the targets are calculated on the time of the signal. This is due to the fact the majority of indicator signals or price action patterns are confirmed only after the candle is closed not during its shaping.

If you are much closer to the candle's closing (something you can also check in the indicator under in the candle remaining time) you may switch to Live prices as they will be much more closer to the next referential price as the previous one could be already way off.
版本 2.1 2020.03.26
Added support also for swap calculated in USD base.
版本 2.0 2020.03.25
Added support also for swap calculated in percentage terms (by interest).
版本 1.9 2020.03.24
Rearranged labels in Custom Lot panel - added swap.
版本 1.8 2020.03.23
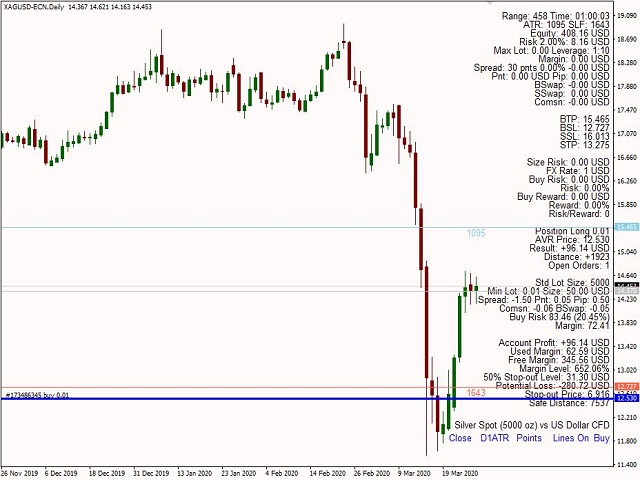
Improvement of the labels and the visualization of the new cool Stop-out Level feature.

Stop-out Level helps you make better decisions when opening positions with higher risk tolerance - especially on smaller accounts or when you aim to build a long term position on a trading instrument with multiple aggregate entries.
版本 1.7 2020.03.23
Added list of brokers to chose from with most of the ECN instruments fully optional on the fly instead of manually set some non-generic parameters that might rarely occur in some instruments.

This concerns mostly margin requirements and tick value on some instruments that differ for each broker.

Fix for some brokers that may have additional string value for the currency pairs. For example instead of AUDCAD to be AUDCAD-ECN.

Added Stop-out Level and lot's of other features like the ability to switch between different view options with single click and so on.

NB! With the Generic Broker function and all available options you can fix the calculator to work even on the strangest instruments and conditions that your broker provides. If such instrument occurs on your broker just follow the instructions and hit the correct indicator settings to match it. Do that while testing on Demo and save the template.

More brokers will be added in the feature to extend preset coverage of such cases. Upon purchase of the indicator you can request you broker and instrument of choice to be added to the list.
版本 1.6 2020.03.17
Added some new functionalities mostly concerning commissions and margin requirements.

You are able to chose between flat commission in deposit currency per standard lot size according to the broker's specification for the instrument or use a commission calculated on a dollar amount traded as some brokers do.

Also you can opt out for a standard margin requirements suitable for most instruments and brokers or if this list doesn't work for a particular case you still can use the Multiplier Fix to align the calculator with that.

As always test on a Demo account to be sure about the inputs you will need if they are required as some special cases can be presented as each broker may have different specifications for indices, commodities, non-major currencies, etc.
版本 1.5 2020.03.10
Added new features including ability to switch between round account numbers or the normal view with 2 decimal points.
版本 1.4 2019.10.01
Added button to use Daily ATR for all timeframes or use the ATR of the current timeframe. Also ability to hide buttons if there are not needed.
版本 1.3 2019.08.31
Better labels.
版本 1.2 2019.08.30
Added Chart Buttons for PSI:

- Switch directly from the chart from Buy to Sell risk calculations.
- Show or hide Stop Loss and Take Profit Lines.
- Last but not least ability to switch from points to pips and vice versa.
版本 1.1 2019.08.24
Changed Font Color to White if the user Background color is Black.