Identify Trend
- 指标
- Aleksey Ivanov
- 版本: 3.20
- 更新: 10 八月 2021
识别趋势指标使用基于移动中位数的健壮过滤方法 -XM 算法和更复杂的 ( 由作者开发 XC,XF,XS, 四种类型的移动平均线,无延迟 SMAWL, EMAWL, SSMAWL , LWMAWL) 算法。“识别趋势”指示器使您可以非常准确地(最重要的是,稍有延迟)确定(1)真实趋势运动的开始,以及(2)识别侧面趋势(平坦)。这样的指标既可以用于根据剥头皮交易策略进行交易,也可以在使用长期交易策略时使用。上一个屏幕截图详细介绍了指标操作算法。
指标读数是可视的,非常简单,不需要评论。
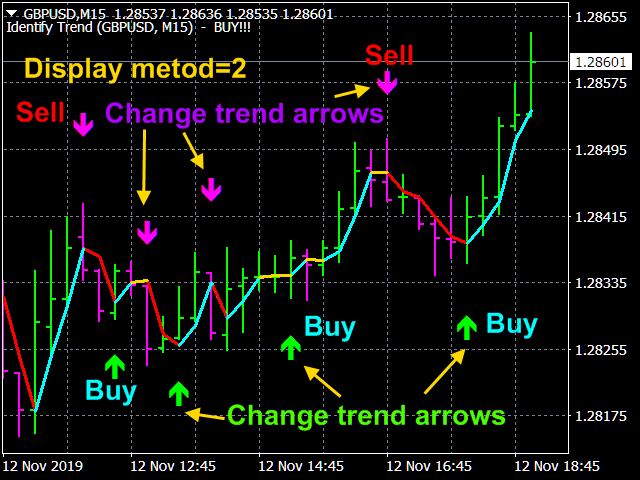
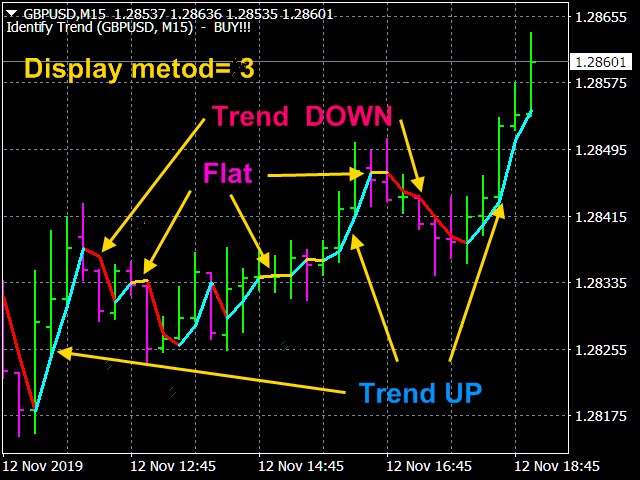
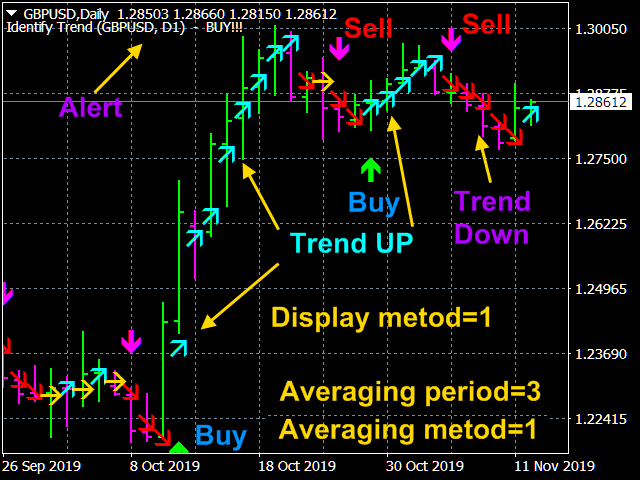
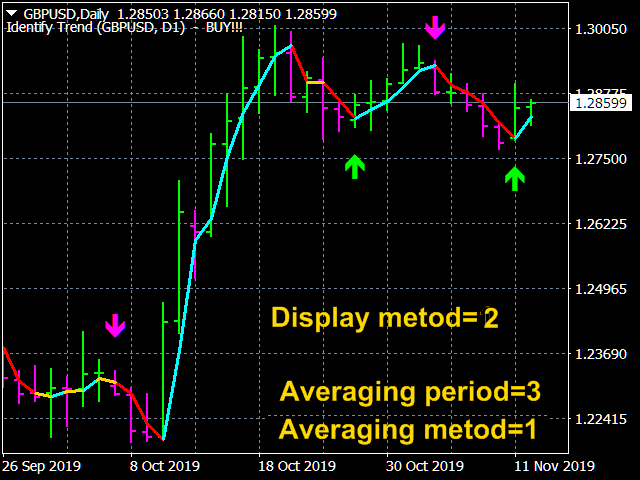
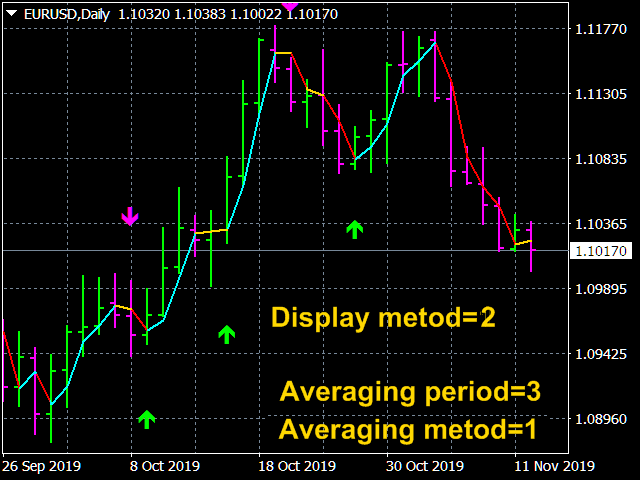
指标的蓝线标志着上升趋势,黄金线是平坦的,红线是下降趋势。因此,当红色或金色线被蓝色替换时,买入的入口点和卖出的入口点 - 相反,当蓝色或金色线被红色替换时。
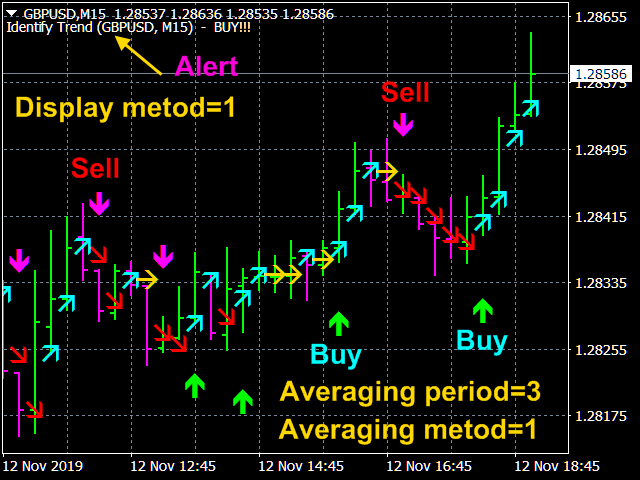
该指标有各种警报。当指示器指示(趋势方向)在最后两个柱上重合时,警报被激活。
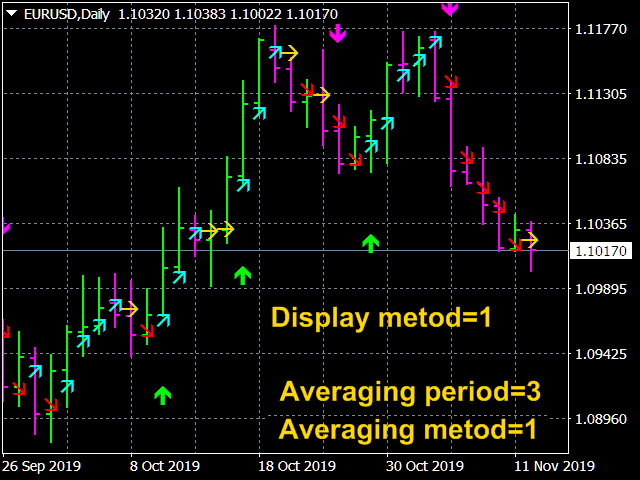
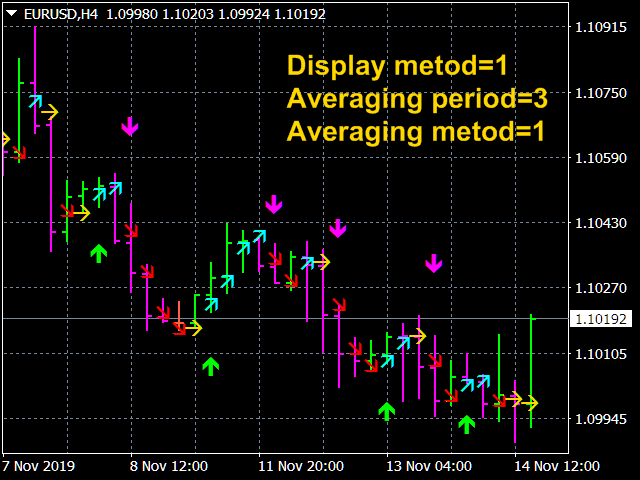
箭头也指示了价格走势发生变化的可能时刻。
指标设置。
- Price type -价格类型。参数值: Close price, Open price (默认情况下), High price, Low price, Median price ((high + low)/2), Typical price ((high + low + close)/3), Weighted price ((high + low + 2*close)/4).
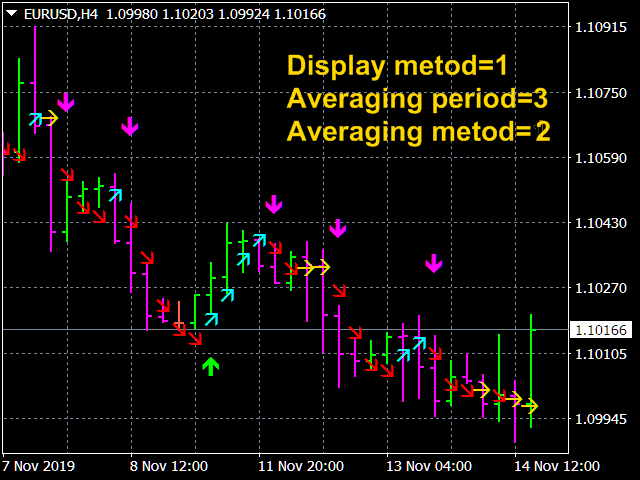
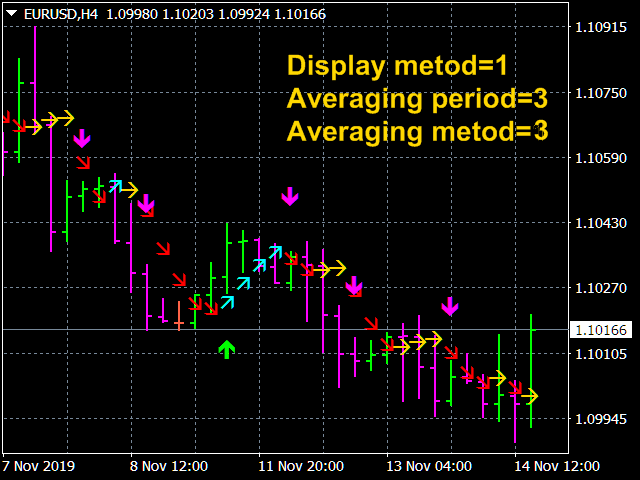
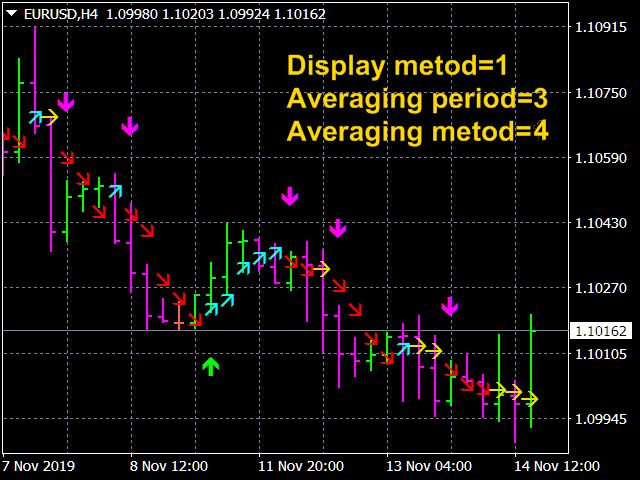
- The averaging method - 平均法. 参数值: XC=XF - XS + SMMA, XF=<x/SMMA>*SMMA, XS=<x*SMMA>/SMMA, XM=<Max({x})+Min({x})>/2 (默认情况下), SMAWL, EMAWL, SSMAWL, LWMAWL.
- The averaging period - 平均期. 参数值任何整数(3默认情况下).
- The display method - 显示信息的方法。价值观: Show only arrows (默认情况下), Show lines and arrows, Show only lines.
- Line (arrows) thickness. 线的粗细(箭头)。任何整数 (2默认情况下).
- Trend DOWN line color=Red - 线条或下降趋势箭头的颜色。
- Trend UP line color=Aqua - 线条或箭头的颜色,指示上升趋势。
- FLAT line color=Gold - 扁线或箭头的颜色。
- Trend DOWN arrow color=Magenta - 箭头是下降趋势的开始。
- Trend UP arrow color=Lime - 箭头是上升趋势的开始。
- The Signal method - 交易信号警报的类型. 参数值: No, Send alert, Print (in expert), Comment (in chart), Sound + Print, Sound + Comment, Sound, Push + Comment, Push, Mail + Comment, Mail.


This indicator is unique. I got 50% profit on my account during the day... I really thank you. You are wonderful