
- 概述
- 评论 (2)
- 评论
- 新特性
推荐产品


对于那些使用趋势线、矩形和文本等元素进行技术分析的人来说,VR 颜色级别是一个方便的工具。可以直接向图表添加文本并截取屏幕截图。 设置、设置文件、演示版本、说明、问题解决,可以从以下位置获取 [博客]
您可以在以下位置阅读或撰写评论 [关联]
版本为 [MetaTrader 4] 一键点击 即可使用该指标。为此,请单击带有线条的按钮,之后光标下方将出现一条趋势线。然后,通过移动光标,您可以选择 行位置 并通过再次单击来修复它。 该指标的特点 是,样式和颜色的所有更改都会自动保存,并随后应用于所有 新创建的 图形对象。 该指标配备了两个独立的按钮,用于设置不同样式的趋势线,两个独立的不同样式的矩形,一个具有自己风格的文本字段以及一个用于创建屏幕截图的按钮。 屏幕截图在 MetaTrader 终端目录的 Files 文件夹中创建,保存路径和文件名写入专家日志中。 大致路径:C:\Users\用户名\AppData\Roaming\MetaQuotes\Terminal\Character set\MQL5\Files\VR Color Levels 有大量类似于 VR Color
FREE

介绍适用于 MT5 的 NAS100 Auto SL 和 TP Maker: 有了我们的 NAS100 Auto SL 和 TP Maker,再也不会错过止损和止盈的设置,这是交易者在 MetaTrader 5 上浏览纳斯达克 100 市场时不可或缺的助手。该工具专为寻求自动管理止损和止盈水平的无缝解决方案的用户而设计。
主要功能
轻松实现自动化:
自动监控无止损和/或止盈的纳斯达克 100 指数交易。 根据用户配置设置动态调整水平。 订单类型的多样性:
兼容纳斯达克 100 指数的市价订单和挂单。 支持 MetaTrader 5 中的各种订单类型。 定制配置:
用户友好的参数设置允许自定义跟踪偏好和止损/止盈水平。 范围灵活:
可选择为其运行的特定 NAS100 工具或所有交易工具设置止损和止盈。 快速执行:
确保快速设置所需的 StopLoss 和/或 TakeProfit 值,无需等待新的 tick 即可迅速响应。 MetaTrader 5 兼容性:
与 MetaTrader 5 中的所有订单类型兼容,实现无缝集成。 使用 NAS100 Auto
FREE

风险交易面板是为手动交易而设计的. 这是发送订单的另一种方式。
面板的第一个特点是使用控制线方便地下订单。 第二个特征是在存在止损线的情况下计算给定风险的交易量。
使用热键设置控制行:
获利-默认情况下T键;
价格-默认情况下p键;
止损-默认情况下,S键;
您可以在交易面板的设置中自行配置密钥。
运算算法:
1)-我们把水平在所需的地方(这是没有必要把所有的水平);
2)-指定风险(可选);
3)-点击绿色发送订单按钮;
4)-我们正在等待下订单,或者会出现带有错误消息的警报;
5)-如果我们想关闭当前符号的所有订单,通过魔术链接到专家顾问,然后点击关闭订单按钮。
您不应该多次按下发送订单按钮。 一次就够了。 下单后,按钮将呈现"未按下"状态。
要发送带有风险计算的订单,需要设置止损线并在交易面板的"风险"字段中设置风险。 否则,订单将以当前交易工具的最低手数放置。
风险是从账户余额计算出来的. 由于经纪商对保证金交易细节的限制,不可能承担100%的风险。
在"风险"字段中允许小数(例如,您可
FREE

This simple visual expert advisor allows you to trade easily from the chart. It handles risk management for you and can perform several useful tasks with your existing trades, saving time and making risk-management for each individual trade easier. [ Installation Guide | Update Guide | Troubleshooting | FAQ | All Products ] Trade easily from the chart Trade with precise risk management, hassle free Trade pending order with drag and drop price selection Set SL and TP levels with drag and drop pr
FREE

Bonus when buying an indicator or an advisor from my list. Write to me in private messages to receive a bonus. Manual Assistant MT5 is a professional manual trading tool that will make your trading fast and comfortable. It is equipped with all the necessary functions that will allow you to open, maintain and close orders and positions with one click. It has a simple and intuitive interface and is suitable for both professionals and beginners.
The panel allows you to place buy and sell orders
FREE

Are you tired of drawing trendlines every time you're analyzing charts? Or perhaps you would like more consistency in your technical analysis. Then this is for you. This indicator will draw trend lines automatically when dropped on a chart. How it works Works similar to standard deviation channel found on mt4 and mt5. It has 2 parameters: 1. Starting Bar 2. Number of bars for calculation The starting bar is the bar which drawing of the trend lines will begin, while the number of bars for c
FREE

This indicator displays Pivot-Lines, preday high and low, preday close and the minimum and maximum of the previous hour. You just have to put this single indicator to the chart to have all these important lines, no need to setup many single indicators.
Why certain lines are important Preday high and low : These are watched by traders who trade in a daily chart. Very often, if price climbs over or falls under a preday low/high there is an acceleration in buying/selling. It is a breakout out of
FREE

Trading Utility for Forex Currency Pairs Only not for Gold Functions Auto Lot Calculation based on Risk Auto stoploss Auto TakeProfit Breakeven Auto Close Half % Close in percentage with respect to the PIPs Pending Orders BuyLimit Sell Limit with distances BuyStop Sell Stop with distances Trading Informations Risk in percentage For Multiple trades Combine Takeprofit and Combine Stoplosses
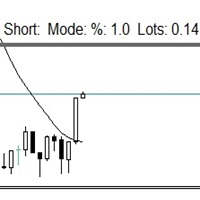
This little tool helps you to define your risk management with a simple line dragging on the chart. It shows you the actual lot size calculated on account % or fixed money amount directly at the line. All you have to do is activate the line by pressing the "t" key on your keyboard and drag the line to your stop loss point. Thats it. In the settings you can define the color and width of line and text, also space of text to line and the right and you can set the risk in percent of account or fixed
FREE
This utility keeps a watchful eye on your trading terminals and ensures that you are notified if any of them are disconnected. Simply attach the utility to a chart and connect to a monitoring service who can notify you.
We use UptimeRobot for both VPS and terminal monitoring; however, any service supporting heartbeat monitoring can be employed.
Many such services offer free plans and various notification methods, such as Cronitor.io
FREE

Account Info EA It is a tool that presents on the graph all the positions of the account, and specific information concerning the positions, but also the account. It enables the user to have an image of his account at a glance. Use like any expert advisor. You can't attach it in the same chart with other expert advisor. It does not have the ability to open or manage positions. You can attach it on any chart and any timeframe.
FREE
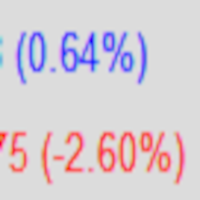
Equity monitor
This is a simple means change informer. I wrote it for myself, maybe someone will need it...
1. Displays the change in funds for the day. Every day, when the terminal is first launched, it remembers the current funds and monitors changes throughout the day.
2. The first day of the month, well remembers the money and, within months, to monitor changes.
3. Well, it displays the profit of the open position.
To work, you need to create 4 global variables: gvarEqityDay ,
FREE

This indicator obeys the popular maxim that: "THE TREND IS YOUR FRIEND" It paints a GREEN line for BUY and also paints a RED line for SELL. (you can change the colors). It gives alarms and alerts of all kinds. IT DOES NOT REPAINT and can be used for all currency pairs and timeframes. Yes, as easy and simple as that. Even a newbie can use it to make great and reliable trades. NB: For best results, get my other premium indicators for more powerful and reliable signals. Get them here: https://www.m
FREE

NS Financas Automatic Clear All Chart Indicators Script
Automatically remove all indicators from your chart offered for free by NS Financas! Don't waste any more time deleting the indicators one by one. With this script it is possible in one click to remove all indicators from the screen to adjust your new strategy while still using the settings of your graph, in addition to the possibility of configuring keyboard shortcuts for quick access to the script.
Take the opportunity to visit our
FREE

Minimalist and fully customizable info panel. It works on any chart and timeframe, with 2 - 4 digits brokers and with 3 - 5 digits ones. It can show: Current Spread in pips (1 decimal digit if you are on a 3 - 5 digits broker) ATR (Average True Range) in pips Current Server Time Current GMT Time Important Account Info: Current Leverage and Stop-out Level (%) Time left for the current bar. Very useful on 4 h charts All info labels have a tooltip with the same data Available customizations : En
FREE

The Penta-O is a 6-point retracement harmonacci pattern which usually precedes big market movements. Penta-O patterns can expand and repaint quite a bit. To make things easier this indicator implements a twist: it waits for a donchian breakout in the right direction before signaling the trade. The end result is an otherwise repainting indicator with a very reliable trading signal. The donchian breakout period is entered as an input. [ Installation Guide | Update Guide | Troubleshooting | FAQ | A
FREE

趋势捕捉器:
具有警示指标的趋势捕捉器策略是一种多功能的技术分析工具,可帮助交易员识别市场趋势和潜在的进出点。它采用动态趋势捕捉器策略,根据市场条件进行调整,清晰地呈现趋势方向。交易员可以自定义参数,以符合其偏好和风险容忍度。该指标有助于识别趋势,发出潜在的反转信号,充当跟踪止损机制,并提供实时警报,以便及时应对市场。
具有警示指标的趋势捕捉器策略是一种多功能的技术分析工具,可帮助交易员识别市场趋势和潜在的进出点。它采用动态趋势捕捉器策略,根据市场条件进行调整,清晰地呈现趋势方向。交易员可以自定义参数,以符合其偏好和风险容忍度。该指标有助于识别趋势,发出潜在的反转信号,充当跟踪止损机制,并提供实时警报,以便及时应对市场。
特点:
趋势识别:信号牛市趋势和熊市趋势。 趋势反转:当蜡烛颜色从牛市变为熊市,反之亦然时,提醒可能的反转。 实时警报:为新趋势识别生成警报。 建议:
货币和货币对:EURUSD,AUDUSD,XAUUSD... 时间框架:H1。 账户类型:任何ECN,低点差账户。
FREE
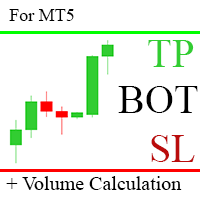
TP SL Bot - 新开立的 订单根据您的指示自动设置止损和止盈的工具。此外,还提供了一个计算器功能,可以计算在给定止损 / 止盈大小下,需要开立交易的数量来达到所需金 额。 有几种 选项来调整大小和参数: 1. 根据用 户指定的百分比来调整止损和止盈金额,作为账户余额的百分比。 2. 根據使用者指定的止盈和停損金額進行調整。 3. 根据开 仓价格的点数( tick )来 调整。 4. 根据开 仓价格的百分比来调整。 特点: 简单易用的界面 适用于市价 订单和挂单 适用于所有品种和 时间周期 多个工作模式 风险管理系统所需正确交易量的计算器 工作原理: !工具在 订单开仓后接收到第一个 tick 时更改订单参数。 模式 1 (存款百分比)。您 设置了存款百分比以计算止损和止盈金额。计算以点数 ( tick ) 为单位进行。 模式 2 ( 金 额 ) 。您设置了期望的止损和止盈金额。工具会自动计算点数 ( tick ) 大小。 注意 ! 前两种模式可能会有小 误差 , 因为指定的金额不一定是最小 tick 值的倍数。 模式 3 ( 点数 ) 。您 设置了止损和止盈的点数 ( tick

Утилита Горячие Клавиши. Работает только на неттинговых типах счетов. Позволяет совершать торговые операции без мыши. Удобно использовать для акций, фьючерсов, валютных пар, криптовалют. В совокупности со стаканом получается полноценный скальперский привод.
Реализованные команды : · покупка по рынку; · продажа по рынку; · выставление лимитного ордера на покупку с заданным отступом (может быть отрицательным) от цены Бид; · выставление лимитного ордера на прод
FREE
Total trade manager allows you to manage your trade to maximise your profits and minimise your losses. This is an essential for traders that are looking for consistency within their trading. The features: Partial Stop Loss: This feature allows you to close a partial percentage of your trade once it goes into negative. So if your stop loss is 20 pips, you could close 75% of your trade at 10 pips and let the remainder of the position to continue running. Auto Stop Loss: This means that once you p

This information indicator will be useful for those who always want to be aware of the current situation on the account.
- More useful indicators
The indicator displays data such as profit in points, percentage and currency, as well as the spread for the current pair and the time until the bar closes on the current timeframe. There are several options for placing the information line on the chart: - To the right of the price (runs behind the price); - As a comment (in the upper left corner
FREE

The Rayol Code Hour Interval Lines indicator was designed to assist your trading experience. It draws the range of hours chosen by the user directly on the chart, so that it enables traders to visualize price movements during their preferred trading hours, providing traders a more comprehensive view of price movements and market dynamics. This indicator allows the user to choose not only the Broker's time, but also the Local time. This way, the user no longer needs to calculate local time in
FREE

Description : Rainbow MT5 is a technical indicator based on Moving Average with period 34 and very easy to use. When price crosses above MA and MA changes color to green, then this is a signal to buy. When price crosses below MA and MA changes color to red, then this is a signal to sell. The Expert advisor ( Rainbow EA MT5 ) based on Rainbow MT5 indicator is now available here .
MT4 version is available here .
FREE

This indicator allows to know the remaining time before the closing of the candle. It works on every timeframe. It is very usefull when your trading strategy depend of the close or the open of a specific candle. So use it like you want. Don't forget to leave a comment or a request for a EA or an indicator. Also spread it to your friends and don't hesitate to visit my profile to see others tools.
FREE
This utility performs 2 simple functions. (On 1 Minute Timeframe*) Counts the number of Ticks - until reset by user defined value. Counts down on the M1 Timeframe - until the new candle forms. Users are able to change the below input values: User Settings: Show Tick Count Label [True/ False] Show Countdown Label [True/ False] Start Tick Counter (Trigger) [Immediate/ After Next Bullish Candle/ After Next Bearish Candle] Tick Count Reset Value Dynamic X & Y Axis Labels [True/ False] Font Size Show
FREE

Order Book, known also as Market Book, market depth, Level 2, - is a dynamically updated table with current volumes of orders to buy and to sell specific financial instument at price levels near Bid and Ask. MetaTrader 5 provides the means for receiving market book from your broker, but in real time only, without access to its history. The indicator OrderBook Cumulative Indicator accumulates market book data online and visualizes them on the chart. In addition, the indicator can show the market
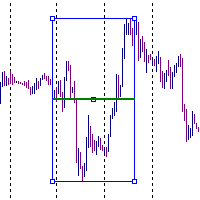
It is just an alternative fibo lines. mt4 have is a very strange drawing of fibo lines, this utilites was written for mt4, but for mt5 it may not be particularly useful. A simple Box (Rectangle) graphic element with adjustable levels binding: it is possible to specify up to 17 custom levels, all rectangles on the chart with the given prefix in their name are processed. Levels are specified in % of the height of the rectangle. A convenient graphical element for analyzing charts by growth-correct
FREE
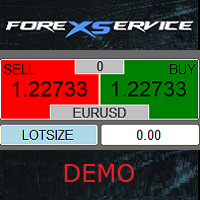
Important! Demo version will work only on EURGBP. One Click Trader is a tool designed for MetaTrader 4 platform, which enables you to take your trading to the next level. It enables you to open, manage and close your trades in simple an efficient way by just one click of your mouse button. "-" , "+" change OCT window size Up arrow minimizes the OCT panel Down arrow maximizes the OCT panel Right arrow displays the next panel with additional features Left arrow hides the panel with additiona
FREE
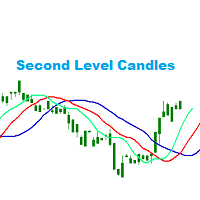
Second Level Candles And Alligator Indicators 每12秒产生一个K线,而且自带Alligator指标,对超短线选手交易非常有帮助。程序启动时可能不成功,是因为MT5 MqlTick 数据加载少的原因。可以通过修改显示的数据参数避免,比如display=100,程序正常之后再将参数调大 display=300 。如果数据不正常,也可以采用重新加载的方式解决。 如果您对这个指标有任何建议,请联系作者。 Second Level Candles And Alligator Indicators produced a candle per 12 seconds,include Alligator, it's helpful to Short-Term Trading。You'd better reload the indicator every start MT5 or change display parameter to reslove data bug. Please attach author when you had some su
FREE
该产品的买家也购买
它有助于计算每笔交易的风险,容易安装新的订单,具有部分关闭功能的订单管理, 7 种类型的追踪止损和其他有用的功能。 注意,该应用程序在策略测试器中不起作用。 您可以在描述页面下载演示版 Manual, Description, Download demo
线条功能 - 在图表上显示开仓线、止损线、止盈线。 有了这个功能,就可以很容易地设置一个新的订单,并在开仓前看到它的附加特性。 风险管理 - 风险计算功能在考虑到设定的风险和止损单的大小的情况下,计算新订单的成交量。它允许你设置任何大小的止损,同时观察设定的风险。 批量计算按钮 - 启用 / 禁用风险计算。 在 " 风险 " 一栏中设置必要的风险值,从 0 到 100 的百分比或存款的货币。 在 " 设置 " 选项卡上选择风险计算的变量: $ 货币, % 余额, % 资产, % 自由保证金, % 自定义, %AB 前一天, %AB 前一周, %AB 前一个月。 R/TP 和 R/SL - 设置止盈和止损的关系。 这允许你设置相对于损失的利润大小。 例如, 1 : 1 - 这决定了 TP = SL 的大小。 2 :

您认为在价格可以瞬间变化的市场中,下单应该尽可能简单吗? 在 Metatrader 中,每次您要开单时,您都必须打开一个窗口,您可以在其中输入开盘价、止损和止盈以及交易规模。 在金融市场交易中,资本管理对于维持您的初始存款并使其倍增至关重要。 因此,当您想下订单时,您可能想知道应该开多大的交易? 在这单笔交易中,您应该承担多少百分比的存款? 您可以从这笔交易中获利多少,利润风险比是多少? 在您设置交易规模之前,您需要进行必要的计算,以获得交易规模应该是多少的问题的答案。 想象一下,您有一个工具可以自动完成所有这些工作。 您打开图表,进行市场分析并用水平线标记入场点、防御点(止损)和目标(止盈),最后您定义风险水平,例如 作为可用资本的百分比,您可以在此交易中承担,此时程序提供: 定义风险和止损规模的可接受交易规模 以点数、点数和账户货币计的止损和获利值 风险回报率 现在剩下的就是点击面板上的相应按钮来打开交易。 如果您是黄牛,需要在不设置防御或目标的情况下快速打开和关闭交易,那么您可以在交易管理器面板中轻松掌握一切,您可以在其中定义固定订单参数并通过单击“购买”或 “卖出”按钮。 关闭

交易面板是一个多功能的交易助手。 该应用程序包含 50 多个专为手动交易而设计的功能。 允许您自动执行大多数交易操作。 注意! 该应用程序在策略测试器中不起作用。 您可以在演示帐户上测试该实用程序;为此,请在此处下载演示版本: 演示版本 。 应用程序的主要功能: 适用于任何交易工具(外汇、差价合约、期货及其他)。 通过一个终端窗口即可使用所有交易工具。 允许您创建最多四个交易工具工作列表。 允许您选择您最喜欢的交易工具。 允许您在所有(或选定的)终端图表上快速切换交易品种。 允许您使用多种方法来计算交易量。 自动计算每笔交易的风险。 根据止损的大小计算风险。 风险经理。 让您可以在图表上直观地看到新订单的交易水平。 允许您设置虚拟止损和获利。 允许您设置指定的止损和获利比率。 允许您在共同价格水平上为所有头寸设置止损或止盈。 允许您下 OCO 订单(一个订单取消另一个订单)。 允许您根据指定参数关闭订单和平仓。 允许您在达到指定的总利润或损失时平仓。 允许您在图表上设置任务线。 允许您反转“卖出转买入”和“买入转卖出”仓位。 允许您锁定仓位。 允许您设置追踪止损功能。 允许您设置盈亏平

通过 Local Trade Copier EA MT5 获得非常快速的交易复制体验。它的简单1分钟设置,使您可以在同一台Windows计算机或Windows VPS上在多个MetaTrader终端之间复制交易,具有闪电般快速的复制速度,低于0.5秒。
无论您是初学者还是专业交易者, Local Trade Copier EA MT5 都提供了广泛的选项,可根据您的特定需求进行自定义。对于任何希望增加利润潜力的人来说,这都是终极解决方案。 今天就尝试一下,看看为什么它是市场上最快、最简单的贸易复印机! 提示: 您可以在您的模拟账户中下载并试用 Local Trade Copier EA MT5 模拟版: 这里 将下载的免费演示文件粘贴到您的 MT5 >> 文件 >> 打开数据文件夹 >> MQL5 >> 专家文件夹并重新启动您的终端。 免费演示版本每次可在 4 小时内发挥全部功能,仅限演示帐户。 要重置试用期,请转至 MT5 >> 工具 >> 全局变量 >> Control + A >> 删除。 请仅在非关键模拟账户上执行此操作,不要在挑战道具公司账户中执行此操作。
Loc
交易管理器可帮助您快速进入和退出交易,同时自动计算风险。 包括帮助您防止过度交易、报复性交易和情绪化交易的功能。 交易可以自动管理,账户绩效指标可以在图表中可视化。 这些功能使该面板成为所有手动交易者的理想选择,并有助于增强 MetaTrader 5 平台。多语言支持。 MT4版本 | 用户指南+演示 交易经理在策略测试器中不起作用。 如需演示,请参阅用户指南 风险管理 根据%或$自动调整风险 可选择使用固定手数或根据交易量和点自动计算手数 使用 RR、点数或价格设置盈亏平衡止损 追踪止损设置 最大每日损失百分比,在达到目标时自动平仓所有交易。 保护账户免遭过多提款并阻止您过度交易 最大每日损失(以美元为单位)在达到目标时自动关闭所有交易。 保护账户免遭过多提款并阻止您过度交易 一键实现所有交易的盈亏平衡 自动计算从手机/电话发送的交易的风险 OCO 在设置中可用
交易和头寸管理 通过设置每月、每周、每天、每小时或每分钟的最大交易次数,停止过度交易和报复性交易。 高级挂单管理。 调整何时关闭挂单的规则 追踪挂单 支持市价订单和挂单 每日最大利润目标(以美元为单位)以确保头寸并停

The product will copy all telegram signal to MT5 ( which you are member) , also it can work as remote copier. Easy to set up, copy order instant, can work with almost signal formats, image signal, s upport to translate other language to English Work with all type of channel or group, even channel have "Restrict Saving Content", work with multi channel, multi MT5 Work as remote copier: with signal have ticket number, it will copy exactly via ticket number. Support to backtest signal. How to s

The added video will showcase all functionality, effectiveness, and uses of the trade manager. Drag and Drop Trade Manager. Draw your entry and have the tool calculate the rest. Advanced targeting and close portions of a trade directly available in tool (manage trades while you sleep). Market order or limit order on either side with factored spread. Just draw the entry, the tool does the rest. Hotkey setup to make it simple. Draw where you want to enter, and the stop loss, the tool calculates al

MT5 to Telegram Signal Provider 是一个易于使用且完全可自定义的工具,它允许向 Telegram 的聊天室、频道或群组发送 指定 的信号,将您的账户变为一个 信号提供商 。 与大多数竞争产品不同,它不使用 DLL 导入。 [ 演示 ] [ 手册 ] [ MT4 版本 ] [ Discord 版本 ] [ Telegram 频道 ]
设置
提供了逐步的 用户指南 。 不需要了解 Telegram API;开发者提供了您所需的一切。
关键特性 能够自定义发送给订阅者的订单详情 您可以创建分层的订阅模型,例如铜、银、金。其中金订阅获得所有信号等。
通过 id、符号或评论过滤订单
包括执行订单的图表截图 在发送的截图上绘制已关闭的订单,以便额外核实 延迟发送新订单消息的可能性,以便在发送前对位置进行调整
订单详情完全透明:
新的市场订单*带截图 订单修改(止损、获利) 已关闭的订单*带截图 部分关闭的订单** 新的挂单 修改的挂单(进场价格) 挂单激活(作为新的市场订单附加) 已删除的挂单 历史订单报告*** 可自定义的评论 注意: *

ADAM EA Special Version for FTMO Please use ShowInfo= false for backtesting ! Our 1st EA created using ChatGPT technology
Trade only GOOD and checked PROP FIRMS Default parameters for Challenge $100,000 Tested on EURUSD and GBPUSD only Use 15MIN Time Frame Close all deals and Auto-trading before Weekend at 12:00 GMT+3 Friday For Prop Firms MUST use special Protector https://www.mql5.com/en/market/product/94362 Signal using ADAM https://www.mql5.com/en/signals/2190554 --------------------

Trade Copier 是一种专业实用程序,旨在复制和同步交易账户之间的交易。 复制发生从供应商的帐户/终端到收件人的帐户/终端,安装在同一台计算机或 vps 上。 在购买之前,您可以在演示帐户上测试演示版本。 演示 这里 。 完整说明 这里 。 主要功能和优点: 支持复制MT5>MT5、MT4>MT5、MT5>MT4,包括МТ5 netting账户。 供应商和收件人模式在同一产品中实现。 简单直观的界面,允许您直接从图表中实时控制复制。 连接中断或终端重新启动时不会丢失设置和位置。 允许您选择要复制的符号,也可以替换接收者的符号,例如 EURUSD> USDJPY。 支持回拷贝。 能够仅复制某些订单。 允许您设置开仓交易价格的最大差异和最大时间延迟。 正确复制部分订单关闭的执行。 计算复制手数的几种方法。 同步止盈和止损。有几种方法可以计算它们的位置。 支持通过执行在“Market account”上工作,其中 SL / TP 仅在开仓后设置。 如何使用简单的设置复制交易 将供应商终端和接收终端安装在同一台计算机或 VPS 上。 在供应商终端上以“Master”模式安装复印机,然后

-25% discount ($199 -> $149) Advanced trading tool: One click smart orders that execute under your conditions Developed by trader for trading community: position size calculator (lot size), open position after price action, strategy builder, set and forget trading, mobile notifications...
Risk Management - Risk percentage position size calculator, gain percentage, target risk reward ratio, spread and commissions are included in calculations 7 Advanced order types - Set and forget trading w

Tired of complex order placement and manual calculations? Trade Dashboard is your solution. With its user-friendly interface, placing orders becomes effortless, by a single click, you can open trades, set stop loss and take profit levels, manage trade lot size, and calculate risk to reward ratios, allowing you to only focus on your strategy. Say goodbye to manual calculations and streamline your trading experience with Trade Dashboard. Download demo version right now.
You can find deta

介绍 OrderManager :MT5的革命性工具 使用全新的Order Manager实用程序,像专业人士一样管理您在MetaTrader 5上的交易。Order Manager设计简单,易于使用,可让您轻松定义和可视化每笔交易的风险,从而做出明智的决策并优化您的交易策略。有关OrderManager的更多信息,请参阅手册。 [ 手册 ] [ MT4版本 ] [ Telegram 频道 ]
主要功能: 风险管理:快速轻松地定义您交易的风险,让您做出更好的决策并提高交易性能。 视觉表示:图形化地查看您的交易和相关风险,以清晰简洁地了解您的开放头寸。 订单修改:只需几次点击即可轻松修改或关闭您的订单,简化您的交易过程,为您节省宝贵的时间。 掌握新闻:一键获取最新市场新闻。
不要错过这个MT5交易员的必备工具。用Order Manager提升您的交易体验,将您的交易游戏提升到新的水平。
OrderManager在startegyTester中 不 工作! OrderManager 仅与 Windows 兼容。
请考虑给这个产品一个5星级评价。您的优秀反馈将激励作者加快更新

The top-selling EAs on the market cost a lot and one day they are suddenly gone. This is because one strategy will not work in the forex market all the time. Our product is unique from all others in the MQL Marketplace because our EA comes with 34+ built-in indicators that allow develop strategies every time. You build your strategy and keep updating it. If one strategy does not work, simply build another all using only one EA. This is All-In-One EA in this market place. You can use as trade

UTM Manager 是一款直观且易于使用的工具,可提供快速高效的交易执行。其中一项突出的功能是“忽略价差”模式,该模式使您能够以蜡烛的价格进行交易,完全忽略价差(例如,允许在 LTF 上交易更高价差的货币对,避免因价差而退出交易)。 UTM Manager 的另一个关键方面是其独特的本地交易复印机,允许在每个经纪商中灵活地运行不同的交易策略和设置,例如不同的 TP、BE 和风险规则。
交易执行: 快速高效的交易执行:通过点击图表上的入场价格和止损价格或使用一键固定止损尺寸功能轻松进入交易。 自动手数计算:根据预定义的风险设置计算手数,当通过拖动修改仓位时会重新计算手数。 能够同时处理一个或多个职位。 止盈和盈亏平衡: 灵活的止盈设置:通过特定的风险回报 (RR) 比率设置灵活的部分止盈水平。 可配置的自动盈亏平衡功能:当达到一定的利润水平时,将止损移至盈亏平衡点。 用户友好的界面: 用户友好的图形界面 (GUI),可轻松保存和加载设置。 内置帮助工具提示来解释其他功能。 职位定制: 仓位定制和调整:经理将所有仓位绘制在图表上,通过拖动线条即可轻松定制和调整。 图表上的按钮: 图
将信号从您所属的任何渠道(包括私人和受限渠道)直接复制到您的 MT5。 该工具在设计时充分考虑了用户的需求,同时提供了管理和监控交易所需的许多功能。 该产品采用易于使用且具有视觉吸引力的图形界面。 自定义您的设置并在几分钟内开始使用该产品!
用户指南 + 演示 | MT4版本 | 不和谐版本 如果您想尝试演示,请参阅用户指南。 Telegram To MT5 接收器在策略测试器中不起作用!
Telegram 至 MT5 功能 一次复制多个通道的信号 从私人和受限频道复制信号 不需要机器人令牌或聊天 ID(如果出于某种原因需要,您仍然可以使用这些) 使用风险百分比或固定手数进行交易 排除特定符号 选择复制所有信号或自定义要复制的信号 配置单词和短语以识别所有信号(默认值应适用于 99% 的信号提供商) 配置时间和日期设置以仅在需要时复制信号 设置一次打开的最大交易量 交易和头寸管理 使用信号或自动设置的管理 通过设置每月、每周、每天、每小时或每分钟的最大交易次数,停止过度交易和报复性交易。 支持市价订单和挂单 每日最大利润目标(以美元为单位)以确保头寸并停止过度交易

Grid Manual是一个交易面板,用于处理订单网格。 该实用程序是通用的,具有灵活的设置和直观的界面。 它不仅可以在亏损方向上设置订单网格,还可以在盈利方向上设置订单网格。 交易者不需要创建和维护订单网格,实用程序会这样做。 打开一个订单就足够了,Grid manual会自动为它创建一个订单网格,并伴随它直到非常关闭。 该实用程序的主要特性和功能: 伴隨以任何方式打開的訂單,包括從移動終端打開的訂單。 適用於兩種類型的網格:“限制”和“停止”。 使用兩種方法計算網格間距:固定和動態(基於 ATR 指標)。 允許您更改未結訂單網格的設置。 顯示圖表上每個網格的盈虧平衡水平。 顯示每個網格的利潤率。 允許您一鍵關閉網格中的盈利訂單。 讓您一鍵關閉每個訂單網格。 允許您對訂單網格應用追踪止損功能。 允許您在訂單網格上應用將訂單網格的止損轉移到盈虧平衡水平的功能。 相對於訂單網格的盈虧平衡水平自動重新排列止盈(僅在限價網格模式下,距離取決於所選的計算類型:“保守”或“激進”)。 最多可管理 20 個訂單網格,每個網格最多可包含 100 個訂單。 計算初始手數時,要考慮入金的大小,不要讓大手

将信号从任何您是会员的渠道(无需机器人令牌或管理员权限)直接复制到您的 MT5。 它的设计以用户为中心,同时提供您需要的许多功能 该产品采用易于使用且具有视觉吸引力的图形界面。 自定义您的设置并在几分钟内开始使用该产品!
用户指南 + 演示 | MT4版本 | 电报版本 如果您想尝试演示,请参阅用户指南。 Discord To MT5 在策略测试器中不起作用。
Discord MT5 功能 从您是会员的任何频道复制。 无需机器人令牌或聊天 ID 使用风险百分比或固定手数进行交易 排除特定符号 选择复制所有信号或自定义要复制的信号 配置单词和短语以识别所有信号(默认值应适用于 99% 的信号提供商) 配置时间和日期设置以仅在需要时复制信号 设置一次打开的最大交易量 交易和头寸管理 使用信号或自动设置的管理 通过设置每月、每周、每天、每小时或每分钟的最大交易次数,停止过度交易和报复性交易。 支持市价订单和挂单 每日最大利润目标(以美元为单位)以确保头寸并停止过度交易 确保仓位的每日最大利润目标(%) 最大开放交易以限制风险和敞口。 使用 RR、点数或价格自动获取部分内容 使用固

-25% discount ($149 -> $111) Everything for chart Technical Analysis indicator mt5 in one tool Draw your supply demand zone with rectangle and support resistance with trendline and get alerts to mobile phone or email alert - Risk reward indicator mt5 Video tutorials, manuals, DEMO download here . Find contacts on my profile .
1. Extended rectangles and trendlines Object will be extended to the right edge of the chart when price will draw new candles on chart. This is rectangle extend

交易面板一键交易。 处理仓位和订单! 通过 图表 或 键盘 进行交易 。 使用我们的交易面板,您只需单击一下即可直接从图表中执行交易,执行交易操作的速度比使用标准 MetaTrader 控件快 30 倍。 参数和函数的自动计算使交易者的交易更加快捷、方便。 图形提示、信息标签和有关贸易交易的完整信息均位于图表 MetaTrader 上。 MT4版本
详细描述 +DEMO +PDF 如何购买
如何安装
如何获取日志文件 如何测试和优化 Expforex 的所有产品 打开和关闭、反转和锁定、部分关闭/Autolot。虚拟/真实止损/止盈/追踪止损/盈亏平衡,订单网格... МetaТrader 5 中主要订单的交易控制面板 :买入、卖出、buystop、buylimit、sellstop、selllimit、平仓、删除、修改、追踪止损、止损、获利。 有 5 个选项卡 可用:头寸、挂单、账户信息、信号和总利润。 Description on English VirtualTradePad在“ MQL5语言最佳图形面板 ”竞赛中 获得二等奖 。 注意

多功能工具:超过65个功能,其中包括:手数计算,价格行为,盈亏比,交易管理,供需区域。 演示版 | 用户手册 | MT5版 任何问题 / 改进意见 / 如果发生了故障或错误 都可以联系我 该实用程序在策略测试器中不起作用:您可以在此处下载 演示版来测 试产品。
Trading functions require permitted auto trading (including on the broker's side) 简化,加快并且自动化你的交易过程。利用这款工具的控制功能就能增强普通交易端的执行力。 建立一笔新的交易:手数 / 风险 / 盈亏计算 1. 手数计算工具 (基于风险规模的交易量计算)
2. 风险计算工具 (基于手数大小的风险额计算)
3. 盈亏比
4. 订单的激活和触发,买入或卖出限价/买入或卖出止损
5. 虚拟的止损/止盈 (隐藏的止损,止盈:交易商不可见)
6. 智能的止损/入场点:当价格柱在收盘时已超越了才入场 (避免无效触发)
7. 隐藏掉挂单 (虚拟的订单)
8. 预订挂单:在市场关闭的时候你也可以下挂单 (适合周末

This is exactly what the name says. Visual strategy builder . One of a kind. Turn your trading strategies and ideas into Expert Advisors without writing single line of code. Generate mql source code files with a few clicks and get your fully functional Expert Advisors, which are ready for live execution, strategy tester and cloud optimization.
There are very few options for those who have no programming skills and can not create their trading solutions in the MQL language. Now, with Bots Build

This service is designed to stream online cryptocurrency quotes from the Binance exchange to your MetaTrader 5 terminal. You will find it perfectly suitable if you want to see the quotes of cryptocurrencies in real time — in the Market watch window and on the MetaTrader 5 charts. After running the service, you will have fully featured and automatically updated cryptocurrency charts in your MetaTrader 5. You can apply templates, color schemes, technical indicators and any non-trading tools to

This EA Utility allows you to manage (with advanced filtering) unlimited open orders (manual or EA) with 16 trailing stop methods: fixed, percent, ATR Exit, Chandelier Exit, Moving Average, Candle High Low Exit, Bollinger Bands, Parabolic, Envelope, Fractal, Ichimoku Kijun-Sen, Alligator, Exit After X Minutes or Bars, RSI and Stochastic. The trailing stop can be either real or virtual, and you can exit fully or with a partial close percent on touch or bar close.
Moreover, you can add (overri

Auto Trade Copier 被设计成多的MT5账户/端子,绝对精度之间复制交易。
有了这个工具,你可以充当要么提供商(源)或接收(目的地) 。每一个交易行为将由提供商克隆到接收器,没有延迟。
以下是亮点功能:
在一个工具提供商或接收器之间转换角色。 一个供应商可以交易复制到多个接收者的账户。 绝对兼容MT5的顺序/位置管理规则,该规则允许与调整容积为每个符号只有一个位置。
自动识别和同步代理之间的符号后缀。 允许高达5特殊符号的设置(即: GOLD - > XAUUSD ,等等) 。 多lotsize设置选项。 允许过滤的订单类型将被复制。 关断端子或电源关闭后恢复以前的设置和状态。 实时控制面板。 使用方便,界面友好。
用法:
- 安装工具提供的MT5终端,并选择角色“提供者” ,然后启用它。
- 安装工具接收的MT5终端,并选择角色的“接收器” ,输入提供商的帐号,然后启用它(你可以有很多接收者的帐户,只要你想) 。
设置和参数:
特殊符号设置(菜单)

Trade Copier Agent 旨在复制多个 MetaTrader(4/5) 账户/终端之间的交易。 使用此工具,您可以充当提供者(源)或接收者(目的地)。所有交易行为都将立即从提供者复制到接收者。 该工具允许您在同一台计算机上的多个 MetaTrader 终端之间复制交易,复制速度快如闪电,不到 0.5 秒。 贸易复印机代理安装和输入指南 请在开始复制之前或没有订单时在提供商帐户上应用设置!
有订单时的任何更改都会影响收款人帐户。 例如:如果提供者账户应用买单然后禁用接收者账户上的所有买单将被关闭。
如果您想获得有关 EA 添加 URL ( http://autofxhub.com ) MT4 终端的通知(请参阅屏幕截图)。 MT5版本 https://www.mql5.com/en/market/product/77134 以下是亮点功能: 在 MT4 和 MT5 账户之间复制。 在一个工具内切换提供者或接收者。 每个账户既可以作为Provider又可以作为Receiver,因此账户之间可以通过2种传输方式相互复制。这就像一个贸易共享网络。 一个提供者可以将交

請務必在 www.Robertsfx.com 加入我們的 Discord 社區,您也可以在 robertsfx.com 購買 EA 無論價格向哪個方向移動,都能贏得勝利 無論價格向哪個方向移動,該機器人都會根據價格的移動方向改變方向,從而獲勝。這是迄今為止最自由的交易方式。
因此,無論它向哪個方向移動,您都會贏(當價格移動到屏幕截圖中的任何一條紅線時,它會以您設置的利潤目標獲勝)。
您面臨的唯一風險是價格是否正在整合(停留在一個地方)。
對沖忍者是一種半自動交易工具,您可以使用下面的對沖設置進行設置。當您告訴它進行交易時,購買或出售它,然後為您處理一切。
每次機器人改變方向時,它都會彌補你之前的損失,所以當你到達任何一條紅線時,你的利潤將是你決定的。
一個好的經驗法則是使用相當高的風險來獲得回報,但是你在這個鏈接上知道如何交易這個機器人的交易秘密。你想要的是價格移動,一旦它開始移動,你就直接走向你的利潤資金:)
設置
ADR / 平均點差 ADR 是平均每日範圍,顯示該工具在一天內通常平均移動多少點。很高興知道這一點,因為您不希望該機器人在點差變得更高

The most advanced news filter and drawdown limiter on MQL market NEW: Take a Break can be backtested against your account history! Check the " What's new " tab for details. Take a Break has evolved from a once simple news filter to a full-fledged account protection tool. It pauses any other EA during potentially unfavorable market conditions and will continue trading when the noise is over. Typical use cases: Stop trading during news/high volatility (+ close my trades before). Stop trading when

Drawdown Limiter EA You are in the right place if you were searching for Drawdown control, Drawdown limiter, Balance protection, Equity Protection or Daily Drawdown Limit related to Prop Firm, FTMO, or Funded account trading, or if you want to protect your trading account. Have you suffered from controlling your drawdown when trading funded accounts? This EA is meant for you. Prop firms usually set a rule called “Trader Daily Drawdown”, and if it is not respected, you are disqualified. I am an

ИДЕТ ЗАКРЫТЫЙ БЕТА ТЕСТ. Не покупайте сейчас, ждите анонса. Спасибо. Инструмент предназначен для автоматического набора позиций от заданных уровней к заданным целям. - Задай ключевые зоны интереса и цели, для всего остального есть HINN Lazy Trader! - Время — это единственный по настоящему ценный ресурс. HINN Lazy Trade r р азработан для минимизации времени, проводимым за чартом, максимизации охвата торговых идей без необходимости контролировать что-либо. - Призван стать идеальным инструментом
作者的更多信息

1. Why did I develop this series of indicators
I found that most traders need to use multiple time frame indicators. They usually switch time frame to see indicators. However, once the timeframe is switched, you cannot see the corresponding relationship between the price in the smaller timeframe and the indicator in the larger timeframe . For example: if your price chart is in H1 timeframe, you can see H4, D1 and W1 indicators in H1 timeframe Chart. This is more helpful for you to find t


Do you think it's a bit cumbersome when you need to switch symbols or timeframes with mouse click? 1. What is this? This is a program that can switch symbols and timeframes with direction keys. Fast switching, very convenient, no mouse click required. For traders, one symbol with multi-timeframe charts are usually added, you can change symbol on those charts easily. For multi-currency traders, different symbol charts are usually added, you can also change those timeframes easily. I wrote this p

This product can be used to synchronize multiple Charts, and each Chart can be set to a different sync mode. With this product you can better view and manipulate charts: different time frames for a single Symbol, the same time frame for multiple Symbols... and more. PS: The link below is the FreeDemo product, you can use it on EURUSD/XUAUSD/USDCNH symbol: https://www.mql5.com/en/market/product/38557
Feature: Chart settings can be synchronized, including : background, indentation, size, etc.

1.这是什么: 下载Market Watch中所有的Symbol数据到系统。PS:不是把数据输出到文档。 2.为什么要用这个: 如果系统中没有数据:网络链接不好的时候,用MT5看一个Symbol需要等待很长时间;在不同Symbol或不同TimeFrame切换,如果系统没有数据也需要等待很久;如果进行长时间回测,系统没有数据,需要下载很长时间。 所以提前把历史数据下载到系统中,能提高工作效率。 3.怎么使用: parameters: input bool bool_usualtimeframe=true; //true-系统默认TimeFrames; || false-所有的TimeFrames. input bool bool_allSymbol=true; //true-Market Watch中所有品种; || false-根据你的输入 input string input_Symbol=NULL; //上面参数为false时,输入你的Symbol名称 input datetime time_Start=D'2017.01.01'; //默认数据下载开始时间 input int s

1.这是什么 上涨波动和下降波动是不一样的,无论是学术研究还是实际检验都说明了这一点。 原始的ATR指标是把上涨波动和下降波动放在一起进行计算。本指标则是把上涨波动和下降波动分开进行计算,这样能更好的帮助你研究市场。
2.指标说明 本指标的计算有两种模式,如下表所示: 0 1 2 3 4 5 波动方向 + - + + - + TR 15 20 17 5 16 8 原始ATR (15+20+17+5+16+8)/6=13.5 模式1 不以0填充位置,周期数改变 模式1上涨TR 15 17 5 8 模式1下跌TR 20 16 模式1上涨ATR (15+17+5+8)/4=11.25 模式1下跌ATR (20+16)/2=18 模式2 以0填充位置,周期数不变 模式2上涨TR 15 0 17 5 0 8 模式2下跌TR 0 20 0 0 16 0 模式2上涨ATR (15+0+17+5+0+8)/6=7.5 模式2下跌ATR (0+20+0+0+16+0)/6=6
如上表。比如周期为6的序列中,有4个上涨2个下跌。模式


Do you think it's a bit cumbersome when you need to switch symbols or timeframes with mouse click? 1. What is this? This is a program that can switch symbols and timeframes with direction keys. Fast switching, very convenient, no mouse click required. For traders, one symbol with multi-timeframe charts are usually added, you can change symbol on those charts easily . For multi-currency traders, different symbol charts are usually added, you can also change those timeframes easily. I wrote thi

According to trading experience: Some symbols are easy to reverse on certain days, such as Monday, or afternoon, and so on. So comparing the current price with the corresponding historical moment price is valuable. If the price coordinate system uses a logarithmic price, you will get a lot of valuable information. 1. What is this?
This program can convert the symbol price and add it to your Chart. You can compare it with your major chart. The DEMO version Link: https://www.mql5.com/en/market/p

What is this: Violent trading: means sending a large number of orders to your brokerage server, it can conduct a stress test of the trading. In this program you can run a variety of trading tests. Now you can trade at high speed, For example 1000 orders in an instant. The Demo version's link: https://www.mql5.com/en/market/product/38431/ Why to use: Whether manual trading or EA trading, the status of the broker server is very important. So it is beneficial to conduct a trading stress test on

1. Why did I develop this series of indicators
I found that most traders need to use multiple time frame indicators. They usually switch time frame to see indicators. However, once the timeframe is switched, you cannot see the corresponding relationship between the price in the smaller timeframe and the indicator in the larger timeframe . For example: if your price chart is in H1 timeframe, you can see H4, D1 and W1 indicators in H1 timeframe Chart. This is more helpful for you to find t
筛选:
版本 1.11
2021.10.23
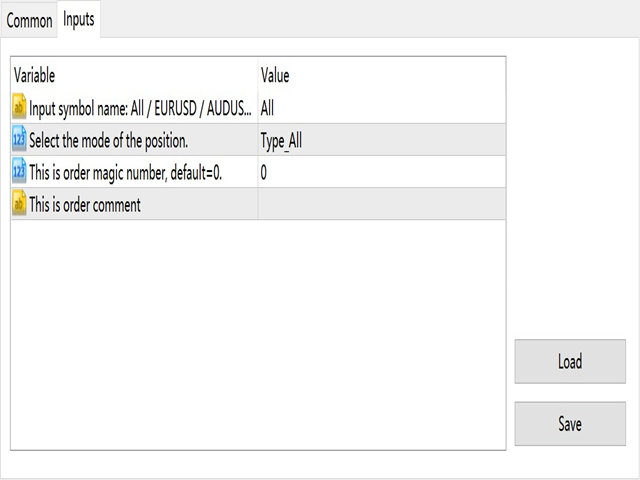
magic number: default 0 means all.
comment: default "" means all.
comment: default "" means all.
版本 1.10
2020.12.01
Now you can close position tickets at high speed, for example 1000 position tickets can be closed instantaneously.
版本 1.7
2020.06.06
recompiled for MT5 update.
版本 1.6
2019.05.07
Add to print the total time of closing all position.
版本 1.2
2019.02.14
1.01Fix some bugs.
1.02Add alert when you have the wrong operation.
1.02Add alert when you have the wrong operation.
您错过了交易机会:
- 免费交易应用程序
- 8,000+信号可供复制
- 探索金融市场的经济新闻
注册
登录
用户没有留下任何评级信息