
很遗憾,"Disconnection Report mt4"不可用
您可以检查Jinsong Zhang的其他产品:
Reverse TradeCopier for Followers can copy trades from an account that is running Reverse TradeCopier Source . Features: Copies trades from one source (master) account to multiple following (slave) accounts. Allows investor (read only) password for source (master) account. There are no complicated settings and input parameters, everything is easy. Works with different brokers. Works with different quotes symbols (EURUSD_FX, eurusd_m, etc.). Can copy orders from 4-digit quotes platform to 5-dig

。。。。。。。。。。。。。。。。。。。。。。。。。。。。。。。。。。。。。。。。。。。 This indicator is based on Bollinger Bands indicator. It helps user clearly know the Band is expand or contract.
The method of use is the same as the traditional Brin channel index. Users can use different color areas to distribute forest channel indicators in expansion or contraction stage. -------------------------------------------------------------------------------------------
FREE
Reverse TradeCopier for Followers can copy trades from an account that is running Reverse TradeCopier for Source . Features: Copies trades from one source (master) account to multiple following (slave) accounts. Allow investor (read only) password for source (master) account. There are no complicated settings and input parameters, everything is easy. Works with different brokers. Works with different quotes symbols (EURUSD_FX, eurusd_m, etc.). Can copy orders from 4-digit quotes platform to 5-
FREE

The script shows statistics of trades for the specified period. For example, if you want to know the details of trades of the ATC2010 Winner ( bobsley ): Login with his account using the investor (read-only) password (MetaTrader5); Open the chart of his trading symbol (EURUSD); Run this script on the chart; Specify 2010.10.1 in "date from", and the diagram will be shown.
If you want something as below: Sell FOREX trading signal. Manage multiple accounts. Follow the trading from somebody. "TradeCopier_follow" and "TradeCopier_source" can help you! Features: Copying from one source (master) account to multiple follower (slave) accounts. Allow investor (read only) password for the source (master) account. There are no complicated settings and input parameters, everything is easy. Works with different Brokers. Works with different symbols (EURUSD_FX, eurusd_m, e
FREE
本产品可以方便用户比较不同图表的K线,还可以方便地查看同一商品在不同时间周期中的K线形态。
将脚本附加到一个图表上,移动K线,或者改变显示比例,所有打开的图表上的K线将与当前的图表上的K线按照时间对齐,并且同步移动。
如果不同图表上的K线的周期不同,将会根据K线的起始时间进行对齐。
使用前请确保相关的历史数据已经下载到本地。
欢迎提出宝贵建议或意见,请与我联系。
。。。。。。。。。。。。。。。。。。。。。。。。。。。。。。。。。。。。。。。。。。。。。。。。。。。。。。。。。。。。。。。。。。。。。。 。。。。。。。。。。。。。。。。。。。。。。。。。。。。。。。。。。。。。。。。。。。。。。。。。。。。。。。。。。。

。。。。。。。。。。。。。。。。。。。。。。。。。。。。。。。。。。。。。。。。。。。。。。。。。。。。。 本产品用于检测外汇行情历史数据。
质量好的历史数据对于交易者作行情分析或回测非常重要。但是各家外汇券商提供的历史数据的质量参差不齐,有时我们会留意到K线序列有缺失,但有时不易察觉。本产品帮助用户定位这些缺失位置。如果某图表上某个时段出现许多缺口,你就要小心历史数据是否可靠,也许要考虑换一个更好的行情服务器。
这个产品用编号标记K线上出现的缺口,并计算出缺口大小,以及其他相关参数。 。。。。。。。。。。。。。。。。。。。。。。。。。。。。。。。。。。。。。。。。。。。。。。。。。。。。。。。。。。。。。。。。

有的交易策略适合波动较小的、安静的行情,而有的策略适合波动较大、剧烈的行情。不管是哪种策略,交易者都应当对行情的冷热程度有清晰的量化标准。 本产品方便交易者对比不同交易品种的冷热程度,或者同一交易品种在不同时间段的交易热度。 你可以将它放在不同图表上,获得直观的感受。哪个品种热度更高,哪个交易更淡静,一目了然。 下方的颜色指示器显示瞬时的价格跳动情况,而左上角的数字显示的是一段时间内的温度累积均值。 。。。。。。。。。。。。。。。。。。。。。。。。。。。。。。。。。。。。。。。。。。。。。。。。。。。。。。 。。。。。。。。。。。。。。。。。。。。。。。。。。。。。。。。。。。。。。。。。。。。。。。。。。。
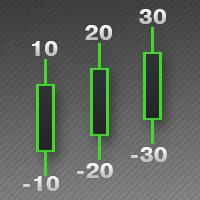
该指标用于指示K线的最高价与最低价之差,以及收盘价与开盘价之差的数值,这样交易者能直观地看到K线的长度。
上方的数字是High-Low的差值,下方数字是Close-Open的差值。
该指标提供过滤功能,用户可以只选出符合条件的K线,例如阳线或者阴线。
----------------------------------------------------------------
该指标用于指示K线的最高价与最低价之差,以及收盘价与开盘价之差的数值,这样交易者能直观地看到K线的长度。
上方的数字是High-Low的差值,下方数字是Close-Open的差值。
该指标提供过滤功能,用户可以只选出符合条件的K线,例如阳线或者阴线。
----------------------------------------------------------------
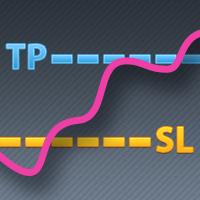
有些交易者不喜欢让他们头寸中的止盈/止损价格暴露出来,这个EA可以帮助他们。
把EA拖放在图表上,并设定止盈/止损点(0意味着忽略),如果图表上的商品有头寸,它会在图表上监察商品的价格,如果价格达到用户设定的止盈/止损水平,就关闭这个头寸。
这个工具可以有效隐藏用户的止盈/止损价格。止盈/止损价格由开仓价格与用户设定的止盈/止损点子所决定。
欢迎提出宝贵建议和意见。 。。。。。。。。。。。。。。。。。。。。。。。。。。。。。。。。。。。。。。。。。。。。。。。。。。。。。。。。。。。。。。。。。。。。。。。。。。 。。。。。。。。。。。。。。。。。。。。。。。。。。。。。。。。。。。。。。。。。。。。。。。。。

This script allows traders to easily close positions if their profit/loss reaches or exceeds a value specified in pips.
The script allows users to easily close positions if their profit/loss reaches or exceeds a value specified in pips.
Please set slippage value first. Sometimes some positions do not close due to high volatility of the market. Please set larger slippage or restart the script.
..............................................................................................

Script to Delete Pending Orders
Sometimes you placed many Pending Orders and then you want delete certain kind of these orders, this script can help you! Usage:
Download and drag and drop this script to the chart. Check "Allow AutoTrading" in "Common" tab and set input parameters in "Inputs" tab. Input Parameters: TypeOfPending: which type Order you would delete. mySymbol: which Symbol you would delete. The input format of the Symbol is such as "EURUSD" or "eurusd".

The script allows to easily watch the date and time of several cities selected by the user from more than 30 important cities all over the world. It also shows GMT, Server time and Local time. The cities on the screen are automatically sorted by the date and time. You can save your setting on the Inputs tab and use them in future. Notice: Daylight saving time is not considered.

有的交易策略适合波动较小的、安静的行情,而有的策略适合波动较大、剧烈的行情。不管是哪种策略,交易者都应当对行情的冷热程度有清晰的量化标准。 本产品方便交易者对比不同交易品种的冷热程度,或者同一交易品种在不同时间段的交易热度。 你可以将它放在不同图表上,获得直观的感受。哪个品种热度更高,哪个交易更淡静,一目了然。 下方的颜色指示器显示瞬时的价格跳动情况,而左上角的数字显示的是一段时间内的温度累积均值。 。。。。。。。。。。。。。。。。。。。。。。。。。。。。。。。。。。。。。。。。。。。。。。。。。。。 .......................................................................................................

Painting Deals on active chart. It allows analyzing trade history on an account to which you have an investor (read only) password. Type of the arrow displayed indicated the deal type: Right Arrow means In and In/Out deals Arrow Left Left means Out deals. Blue arrows are for Buy deals and Red arrows are for Sell deals. The indicator displays deals in the real time mode, it also displays their Stop Loss and Take Profit levels. Put the mouse over the arrows to see the details of deals including op
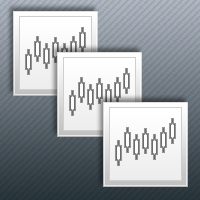
本产品可以方便用户比较不同图表的K线,还可以方便地查看同一商品在不同时间周期中的K线形态。 将脚本附加到一个图表上,移动K线,或者改变显示比例,所有打开的图表上的K线将与当前的图表上的K线按照时间对齐,并且同步移动。
如果不同图表上的K线的周期不同,将会根据K线的起始时间进行对齐。 使用前请确保相关的历史数据已经下载到本地。 欢迎提出宝贵建议或意见,请与我联系。 —————————————————————————————————————————————————————————————————————————————————————— 。。。。。。。。。。。。。。。。。。。。。。。。。。。。。。。。。。。。。。。。。。。。。。。。。。。。。。。。。。。。。。

该工具帮助用户轻松地一键平仓,当某个持仓头寸的损益达到或者超过用户设定的点子时。 使用时请先设置滑移值。 有时,由于市场的高度波动,一些头寸不能及时关闭,这时 请设置较大的滑移值,或重新按动平仓按键。 ...................................................................................................................................................... ===================================================================================================

This script notifies a user about different events by playing sounds, sending emails and text messages to a mobile device. The following events are supported: New deals (in/in out/out). Expiration of Pending orders. The terminal disconnected. The terminal or the script closed. Please set a notification type for each event separately. If you need notifications via Email, please make sure that the settings on the Email tab are correct. If you need to receive notifications on a mobile device, pleas

This script alerts a user via sounds and alert box at the end of a countdown. It is like an alarm clock. There are 2 ways to start counting down: Set a value of remaining minutes. Example: if you need an alert after 1 hour, set it to 60. Set countdown end time. If you like to use a custom sound for the alert, copy your sound files to "terminal_path\Sounds" folder and set the exact file name in the input parameters. The sound file must be in *.wav format.

本产品用于检测外汇行情历史数据。
质量好的历史数据对于交易者作行情分析或回测非常重要。但是各家外汇券商提供的历史数据的质量参差不齐,有时我们会留意到K线序列有缺失,但有时不易察觉。本产品帮助用户定位这些缺失位置。如果某图表上某个时段出现许多缺口,你就要小心历史数据是否可靠,也许要考虑换一个更好的行情服务器。
这个产品用编号标记K线上出现的缺口,并计算出缺口大小,以及其他相关参数。
。。。。。。。。。。。。。。。。。。。。。。。。。。。。。。。。。。。。。。。。。。。。。。。。。。。。。。。。。。。。。。。。。。。。。 ..................................................................................................

This is a trend indicator, as you can see here. When the white line is above the red, it means a bull market. Conversely, the white line below the red line is a bear market. This index is suitable for long - term trading and is suitable for most trading varieties. --------------------------------------------------------------------------------------------

This indicator let user clearly see Buy/Sell signals. When a bar is closed and conditions meet, arrow signal will come up at Close Price, up is Buy and down is Sell. It works on all Timeframes. And you can set sound alert when signals come up.

这个指标用于比较图表上的交易品种与其他几个所选交易品种之间的强弱相对关系。
根据每个交易品种基于相同基准日的价格走势进行比较,可以看到几条不同走向的趋势线,反映出几个不同交易品种之间的强弱关系,这样可以更清楚地了解市场的趋势。
例如,你可以在EURUSD图表上应用这个指标,将其与货币对EURJPY和EURGBP进行比较,看看哪个更强。
你需要为指标输入参数: 需要比较的几个交易品种的名称 您需要选择比较基准日期。
请注意,使用指标前应确保相关交易品种的历史数据已经下载。
免费模拟版本是: https://www.mql5.com/zh/market/product/63921 .............................................

.................................. This script is intended to help users to get information about ticks and spreads (e.g. ticks count, minimum/maximum/average spread). It can export reports in the CSV format with this information. Traders can see spread statistics in real time in the chart window It is useful for comparing spreads of different brokers. --------------------------------------------------------------------------

这是一款基于市场深度的可视化指标,它可工作于所有提供市场深度的品种。它显示每笔卖价/出价的交易量与总卖价/出价的交易量的比值,这样用户可以直观地判断买卖方向的瞬时强度。你可以同时在几个图表上应用这个指标,观察不同品种的买卖队列。 购买前请确认你的交易商有提供市场深度这个功能。 。。。。。。。。。。。。。。。。。。。。。。。。。。。。。。。。。。。。。。。。。。。。。。。。。。。。。。。。。。。。。。。。。。。。。。。。 。。。。。。。。。。。。。。。。。。。。。。。。。。。。。。。。。。。。。。。。。。。。。。。。。。。。。。。。。。。。。。。。。。。。。。。。。 。。。。。。。。。。。。。。。。。。。。。。。。。。。。。。。。。。。。。。。。。。。。。。。。。。。

这个指标用于比较图表上的交易品种与其他两个所选交易品种之间的强弱相对关系。
根据每个交易品种基于相同基准日的价格走势进行比较,可以看到三条不同走向的趋势线,反映出三个不同交易品种之间的强弱关系,这样可以更清楚地了解市场的趋势。
例如,你可以在EURUSD图表上应用这个指标,将其与货币对EURJPY和EURGBP进行比较,看看哪个更强。
你需要为指标输入参数:
您可以输入两个交易品种的名称 您需要选择比较基准日期。
请注意,使用指标前应确保相关交易品种的历史数据已经下载。 免费模拟版本是: https://www.mql5.com/zh/market/product/63888 .........................................

Most time the market is in a small oscillation amplitude. The Trade Area indicator helps users to recognize that time. There are 5 lines in this indicator: Area_high, Area_middle, Area_Low, SL_high and SL_low. Recommendations: When price is between Area_high and Area_Low, it's time to trade. Buy at Area_Low level and sell at Area_high level. The SL_high and SL_low lines are the levels for Stop Loss. Change the Deviations parameter to adjust SL_high and SL_low.

该指标用于指示K线的最高价与最低价之差,以及收盘价与开盘价之差的数值,这样交易者能直观地看到K线的长度。 上方的数字是High-Low的差值,下方数字是Close-Open的差值。 该指标提供过滤功能,用户可以只选出符合条件的K线,例如阳线或者阴线。 ---------------------------------------------------------------- 该指标用于指示K线的最高价与最低价之差,以及收盘价与开盘价之差的数值,这样交易者能直观地看到K线的长度。 上方的数字是High-Low的差值,下方数字是Close-Open的差值。 该指标提供过滤功能,用户可以只选出符合条件的K线,例如阳线或者阴线。

这个脚本允许比较来自不同交易服务器或者不同经纪商的报价和价差,以识别出一个提供最好的买价/卖价和最小价差的服务器/经纪商。
一次可与最多6个不同的服务器或经纪商进行比较,通过分数很容易就能找到最好的报价提供商。
用法:打开最多6个MetaTrader 客户端终端,分别登入不同的服务器/经纪商,然后在每个终端的图表上启动脚本。
。。。。。。。。。。。。。。。。。。。。。。。。。。。。。。。。。。。。。。。。。。。。。。。。。。。。。。。。。
。。。。。。。。。。。。。。。。。。。。。。。。。。。。。。。。。。。。。。。。。。。。。。。。。。。。。。。
。。。。。。。。。。。。。。。。。。。。。。。。。。。。。。。。。。。。。。。。。。。。。。。。。。。

这是一个多货币配对交易系统。具体原理我就不详细解释了,用户需要关心的是它的实际表现。
强烈建议阁下下载此产品,并对它进行充分的检验,包括以历史数据进行回测、在模拟账户进行实测。
由于此EA交易多个货币对,在首次对其进行历史回测时,将会自动下载相关的历史数据,数据量约为每个月6GB左右,下载时间约一小时(如果电脑配置高,而且网速快,会节省下载时间)。
数据下载完成后,你可以在策略测试器中对其进行充分的测试。测试一个月的历史数据需要大约10分钟。具体测试方法在本网站的文章中有介绍。
由于市场上有很多交易商,同一交易商有多个不同的服务器,各有不同特性,会让本产品的测试结果有较大影响,建议用户多开不同账户对产品进行测试,以获得较佳结果。关于交易商的服务器,用户可以参考我在MQL5社区上的相关博客。
可以确定的是,服务器的延时越少、滑点越小、点差越低、报价越稳定,则本EA盈利机会越多。交易者需要做的是找到这样的服务器。如果你找到了,祝贺你!你可以利用VPS,对产品作进一步的实时测试。
祝好运!