• 概述
  • 评论 (16)
  • 评论 (24)
  • 新特性

Weis Wave with Alert MT5

4.93


Rental/Lifetime Package Options and Privileges 

* For optimum results the yearly or lifetime package is suggested due to live training !

Rent Monthly Six Months   Yearly/Lifetime
Weis Wave with Speed with Alert+Speed Index
x
x
x
Manual 
x
x
x
Quick Set up Video
x
x
x
Blog
x
x
x
Lifetime Updates
x
x
x
Setup and Training Material
x
x
Free Rectangle Break Alert Tool     
x
Discord Access Channel "The SI traders"

x
2-hour live methodology training

x


How to trade with it:   http://www.tradethevolumewaves.com 

** If you purchase please contact me to setup your  : Two hour  webinar and  training Room and  complete manual access. 


Weis Wave with Alert MT5

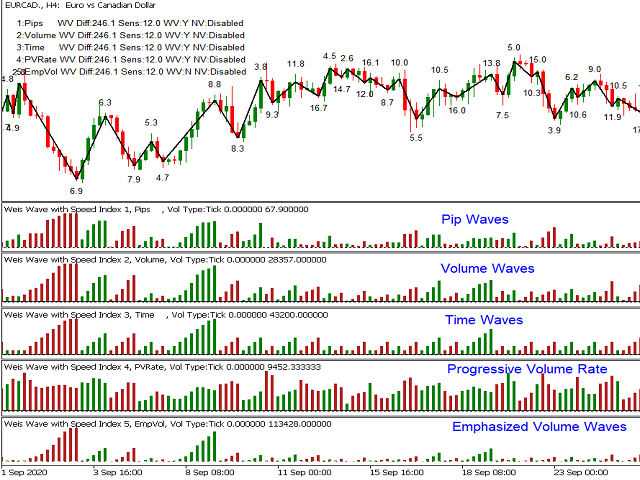
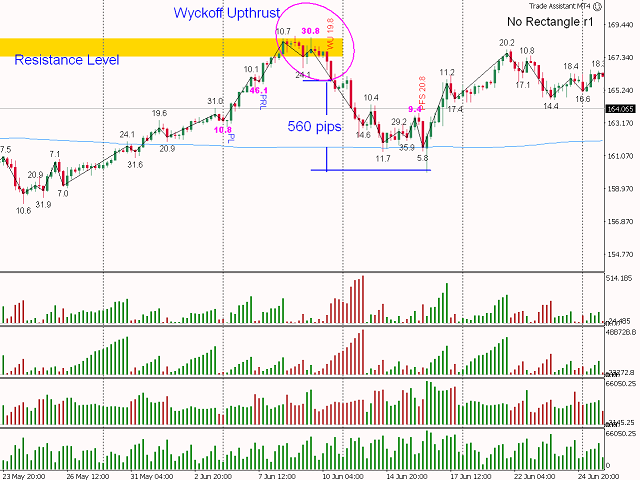
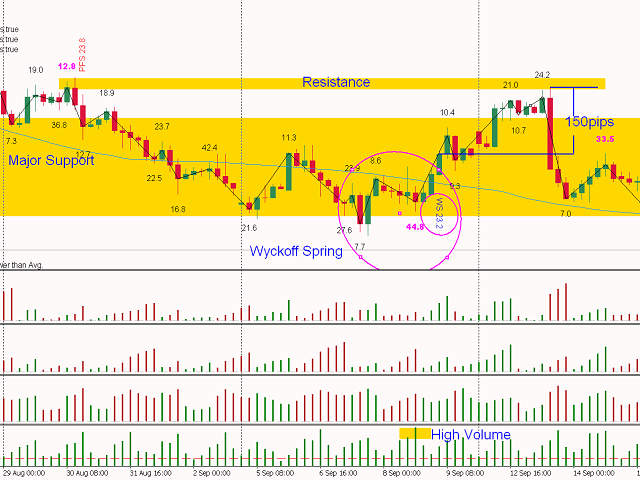
This is a Weis Wave indicator which is based on Richard D. Wyckoff theory. It works in all time periods, range bar and tick bar charts and it can be applied to any market.

This indicator is an evolution of Weis Wave because it offers the autowaves feature, five different wave types as well as the powerful Speed Index.  Each price wave is moving in a specific direction up or down until it reverses. In order for the indicator wave to reverse in the opposite direction, the price should exceed the number of points (pip*10) set in the parameters. Therefore, the last wave repaints but the theory behind this trading method is forecasting where the market will go by reading  the previous waves.


Trading Strategies: www.tradethevolumewaves.com Setup Parameters
  • Indicator Number: Multiple Indicators can be added on the same chart. Valid values "0 to 9" and "a-z"
  • Show Orders: display or not your orders
  • Load all Bars: true/false, if false Number of bars back will be loaded
  • Number of bars back: numbers of bars that the indicator will load
  • Wave Direction Change difference in Points: Number of points required for the current wave to reverse and form a new wave
  • AutoDifference: true/false - Neglects the Wave Direction difference  and adjusts the Difference automatically creating more accurate waves.
  • AutoSensitivity: The higher the number the higher the sensitivity and therefore more waves are formed.
  • Volumetype= true=Tick Volume, false=Real Volume
  • Weighted Volume: true/false - Weights volume of  different sessions taking into consideration that when London and US are operating at same time have the highest volume of all sessions occurs and adjusts the rest of the sessions. With this parameter it very easy visualize which volumes are significant even on Asian hours or non-significant on London-US hrs.
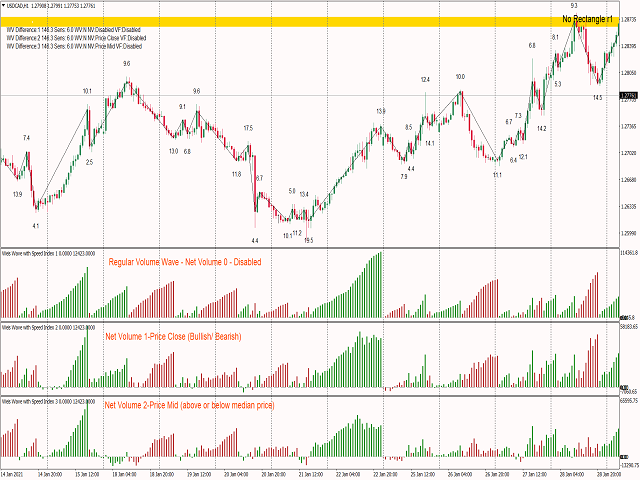
  • Net Volume: 0-Disabled, 1-Price Close, 2 Price Median
  • Wave Type: 0-Regular Volume, 1-Pips, 2-Progressive Volume Rate, 3-Time,4 Emphasized Volume Waves, 5 Inverse Progressive Pip Rate
Speed Index Display and Alert Parameters
  • SI Display: Show or not speed index on the chart 0-No Display, 1 Speed Index only, 2 Volume and Speed Index, 3 Speed Index and Average Speed Index, 4 Speed Index and Wave speed (Fast or SLow)
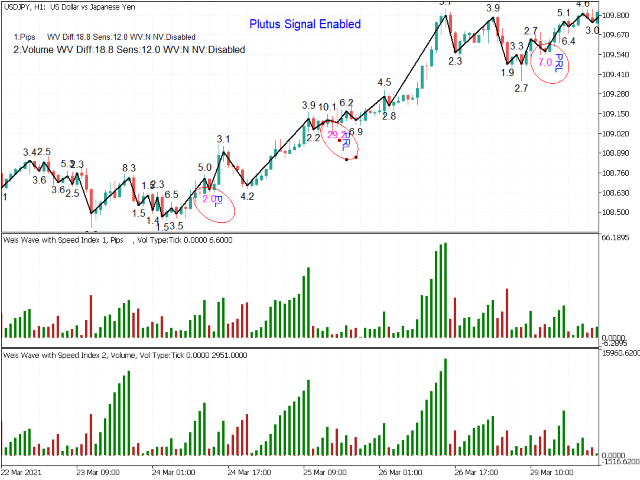
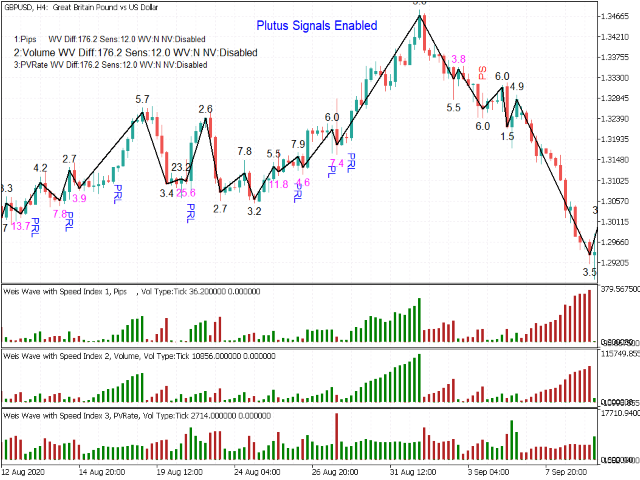
  • Show Plutus Patterns or Not
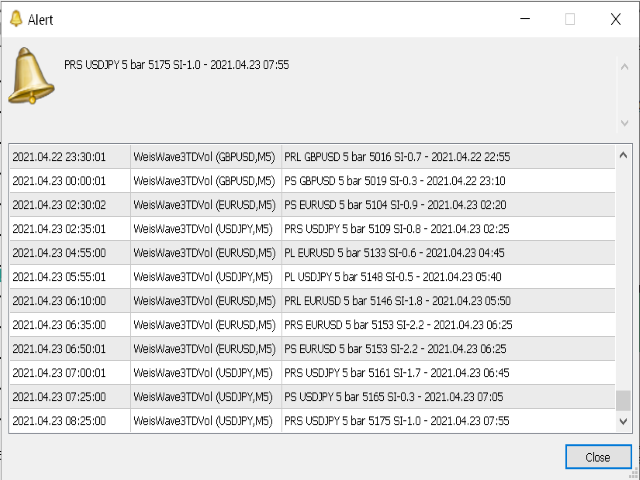
  • Alert on Plutus Patterns: Popup, Sound, Email, Push Notification
  • SpeedAlert: There are two ways that you can be notified for Extreme Speed Index numbers the Automatic and the Manual, please refer to the manual for explanations.
    • Alerts :Popup, Sound, Email, Push

Format Wave and Label
  • ShowLabels: Display or not the wave type the pips and the number of bars of each wave
  • What to Display:1-Volume,2-Pips, 3-Bars, 4-All, 5-Volume and Pips
  • ShowWaveLine: Draw the wave line or not on the price chart
  • Format: LabelShift, Font size, Color Up, Color Dn, wave color, wave width

Volume Alert The information displayed by the alert function are: the pair, the period, a message “High Down Volume” or “High Up Volume” and the time.
  • Volume Alert Above this limit: The value of cumulative volume that will be triggered if the alert is exceeded
  • Alerts: Popup, Sound, Email, Push
Format Numbers for better display parameters
  • VolDivBy: Volume divider in order to avoid big numbers on the display
  • PipDivBy: Pip distance  divider in order to avoid big numbers on the display
  • SI Multiplier: Speed Index Multiplier for better display
  • Reverse Style: inverts wave style


评论 16
Mr_Corazon
49
Mr_Corazon 2024.03.10 09:28 
 

I read a book by David Weis and watched a video of his, from there I found this product which has been developed by Takis. He is passionate about what he has created and he is generous with his offering of expertise and more importantly he is generous with his time. It looks very complicated but its quite simple in essence and time spent with the creator and programmer himself was a pleasure. Thank you for everything so far Takis. And here is to a plentiful 2024

TruthMV
49
TruthMV 2023.06.03 00:23 
 

I just want to say thank for sharing your experience in putting together the "Weis Wave with Speedy Index Indicator". Using the Wyckoff Method, David Weis's Wave theory with Forex all in one. I would say it's not really a indicator, it's a way to read the charts for your self and not dependent on a line crosses this line or candle crossed a MA. I've been searching for many years trying to find some sort of logical process and common denominator in trading, I've spent thousands on all sort of esoteric books, platforms, data feeds etc. and was almost ready to quit, thinking I'm not smart enough to figure all this out. I've been applying the, "Trade The Volume Wave Method" for only three months, but I've had more consistent results and the confidence in what I'm learning will work. Even though I've made mistakes, now I know why and learn from them. Also, thanks for offering a two hour training session for free, for now, to get me up and running and the Discord Channel where we can discuss potential trades. Thank you Panagiotis (Takis) for giving all of us retail traders peace of mind and hope. Mark USA

mistaeff
159
mistaeff 2023.01.05 22:15 
 

Throughout my time using the MQL5 platform, I have never come across anyone who is more devoted to the success of their customers. The developer is a great guy, he spends hours sharing his knowledge and is a successful professional trader in his own right. He has developed a personal trading system, along with a pretty unique indicator that will enable you to consistently profit in the forex markets. I would highly recommend this product, whether you are starting a brand new strategy or even adding additional verifications to an existing strategy.

推荐产品
Limitless MT5
Dmitriy Kashevich
Limitless MT5 is a universal indicator suitable for every beginner and experienced trader. works on all currency pairs, cryptocurrencies, raw stocks Limitless MT5 - already configured and does not require additional configuration And now the main thing Why Limitless MT5? 1 complete lack of redrawing 2 two years of testing by the best specialists in trading 3 the accuracy of correct signals exceeds 80% 4 performed well in trading during news releases Trading rules 1 buy signa
1 399 USD
WanaScalper
Isaac Wanasolo
1 (1)
A scalping indicator based on mathematical patterns, which on average gives signals with relatively small SL, and also occasionally helps to catch big moves in the markets (more information in the video) This indicator has three main types of notifications: The first type warns of a possible/upcoming signal on the next bar The second type indicates the presence of a ready signal to enter the market/open a position The third type is for SL and TP levels - you will be notified every time price r
1 350 USD
Value Chart Candlesticks
Flavio Javier Jarabeck
4.75 (8)
The idea of a Value Chart indicator was presented in the very good book I read back in 2020 , " Dynamic Trading Indicators: Winning with Value Charts and Price Action Profile ", from the authors Mark Helweg and David Stendahl. The idea is simple and the result is pure genius: Present candlestick Price analysis in a detrended way! HOW TO READ THIS INDICATOR Look for Overbought and Oversold levels. Of course, you will need to test the settings a lot to find the "correct" one for your approach.
FREE
QuantumAlert RSI Navigator is a free indicator available for MT4/MT5 platforms, its work is to provide "alerts" when the market is inside "overbought and oversold" regions in the form of "buy or sell" signals. This indicator comes with many customization options mentioned in the parameter section below, user can customise these parameters as needful. Join our MQL5 group , where we share important news and updates. You are also welcome to join our private channel as well, contact me for the priva
FREE
HLC bar MT5 Wyckoff
Eduardo Da Costa Custodio Santos
創建 MT5 的指標“HLC_bar_MT5 Wyckoff”是為了方便交易時的分析。 HLC Bar 由 Richard Wyckoff 使用,目前廣泛用於“VSA”操作。 Wyckoff 發現使用 High、Low 和 Close 使圖表更清晰、更易於分析。 指標“HLC_bar_MT5 Wyckoff”允許: # 改變條寬; # 保持條形相同的顏色; # 並突出顯示以相同價格開盤和收盤的柱。 顏色和寬度很容易在設置中修改 要使用該指標,只需將其拖到圖表上即可。 當與成交量一起使用時,威科夫將 HLC 圖表稱為條形圖。 他們試圖隱藏這些信息多年,但現在每個人都可以訪問這些信息,並可以使用此類圖表改進他們的操作。 HLC bar MT5 Wyckoff Chart 可用於任何市場和任何圖表時間,使操作員更加舒適。
30 USD
CSP eurusd Strategy
Francisco Tomas Moreno Garcia
CSP策略。 这个蜡烛图正如其名称所示,是基于蜡烛上的某种类型的图案(在1H时间框架上表现最好)。回测和优化是在外部历史数据上进行的,由于这个原因,在meta trader5上进行的回测不会显示同样好的结果,不过除了回测,我们还进行了从2023.03.27到2023.0330的一周的真实测试,结果在提供的图片中显示。 改善这个(和大多数)策略的提示。 正如你们中的一些人可能已经经历过的,我们已经经历了一个高波动的时期。 1.不建议在这种情况下进行交易,当然,除非你的策略完全基于此,如果不是这样的话,市场的不可预测性使得策略很难正常工作,价格的变动更加显著,虽然可能会出现问题,但通常会导致更容易达到止损点。 2.与此相关,我们必须避免在重大新闻发布期间进行交易,因为波动性会非常大(为了了解情况,请搜索外汇新闻日历)。 3.不要通宵交易,尽管该策略的配置方式是在晚上10点后不进行交易,但可能会出现交易在交易时段转换前没有达到TP或SL的情况,在这种情况下,我们建议手动关闭交易,因为在最初几个小时内,点差会大幅上升,仅这一点就可能导致SL被击中。 4. 4.每个策略都可以
200 USD
Smooth price for Monarch
Konstantin Gruzdev
5 (1)
The Smooth Price technical indicator is used for plotting a smoothed line as close to the price of the financial instrument as possible, and serves to eliminate its noise components. The indicator is part of the Monarch trading system, but here it is presented as an independent technical analysis tool. The indicator is based on the cluster digital filter , which, unlike the ClusterSMA , is applied directly to the price time series. Smooth Price does not redraw (except the very last, zero bar) an
999 USD
MarketMagnet
Kelly Adediran Raymond
Are you ready to take your trading journey to new heights? Look no further than MarketMagnet, this groundbreaking indicator designed to propel your trading success with excitement and accuracy. Powered by the convergence of Momentum and CCI (Commodity Channel Index), MarketMagnet equips traders with the ultimate tool to determine direction and entry prices for a wide range of recommended currency pairs and instruments. It is designed for traders seeking to scalp for a few pips on lower timeframe
499 USD
Owl Smart Levels MT5
Sergey Ermolov
4.47 (36)
MT4版本  |   FAQ Owl Smart Levels Indicator 是一個完整的交易系統,包含 Bill Williams 的高級分形、構建正確的市場波浪結構的 Valable ZigZag 以及標記準確入場水平的斐波那契水平等流行的市場分析工具 進入市場和地方獲利。 策略的详细说明 指示灯使用说明 顾问-贸易猫头鹰助手助理 私人用户聊天 ->购买后写信给我,我会将您添加到私人聊天中,您可以在那里下载所有奖金 力量在於簡單! Owl Smart Levels 交易系統非常易於使用,因此適合專業人士和剛開始研究市場並為自己選擇交易策略的人。 策略和指標中沒有隱藏的秘密公式和計算方法,所有策略指標都是公開的。 Owl Smart Levels 允許您快速查看進入交易的信號,突出顯示下訂單的水平並向您發送有關已出現信號的通知。 優點很明顯: 清楚地顯示主要和更高時間框架的趨勢方向。 指示儀器信號的出現。 標記開單、止損設置和固定利潤的水平。 沒有多餘的,只有必要的結構! ZigZag 表示全球趨勢的方向,因此也表示貿易方向。 市場反轉點的短線清楚地表明在什麼水平上構建斐波
97 USD
Divergence Detection: The indicator is designed to identify divergences between the price movement and the Stochastics oscillator. This can help traders spot potential trend reversals or trend continuation opportunities. Early Warning System: By capturing divergences, the Stochastics Divergence Indicator can provide an early warning of possible market turning points. This allows traders to take timely action and make informed decisions. Versatility: The indicator can be applied to various finan
390 USD
Segmented Volume MT5
Eduardo Da Costa Custodio Santos
30 USD
Hello There, Today I want to show you my new researchable fore BUY SELL indicator, it work all asset, and also work Derive Volatility asset! it work all time frame, but i recommend start 5 minute to H1 when you receive a signal just take trade and stay wait for your take profit asset All Major Pair And minor IT WORK ALSO XAUUSD Fantastic results,  for more info,,, message us thank you   
500 USD
Master OBV FX
Thalles Nascimento De Carvalho
5 (1)
The MasterOBV indicator is a powerful technical analysis tool that utilizes volume, positive correlation, and a Moving Average (MA) to enhance trend identification in financial markets. By incorporating assets with positive correlation through the indicator menu, MasterOBV provides a refined approach to assessing the strength and direction of trends. The inclusion of the Moving Average adds additional smoothing to price movements, aiding in a more accurate tracking of the underlying trend over
FREE
Reversal Composite Candles
MetaQuotes Ltd.
3.43 (23)
该系统的思路是通过计算复合蜡烛来识别反转形态。 反转形态类似日本蜡烛条分析的 "锤头" 和 "吊颈" 形态。但它使用符合蜡烛替代单一的蜡烛,并且不需要复合蜡烛的小实体来确认反转。 输入参数: Range - 最大柱线数量, 计算复合蜡烛时用。 Minimum - 最小复合蜡烛大小 (传统的点数)。 ShadowBig and ShadowSmall - 影线 (复合蜡烛单元)。 Limit, StopLoss and TakeProfit - 开盘价, 止损位和止盈位, 它们是相对于复合蜡烛的收盘价 (复合蜡烛单元)。 Expiration - 订单过期时间 (单位柱线), 用于挂单 (Limit!=0.0)。 反向蜡烛条形态的判别如下。 它计算复合蜡烛参数,其自最后的完整柱线 (索引为 1) 至由 Range 输入参数定义的柱线数量。如果复合蜡烛大小大于由 Minimum 输入参数指定的数值, 它分析复合蜡烛的影线检测反转条件。 空头能量的特征是复合蜡烛的上影线为零, 多头能量的特征是复合蜡烛的下影线为零。 为确认空头趋势反转 (且多头开始),需要以下检查: 下影线的大小 (多头能量
FREE
Your Trend Friend
Luigi Nunes Labigalini
The trend is your friend! Look at the color of the indicator and trade on that direction. It does not  repaint. After each candle is closed, that's the color of the trend. You can focus on shorter faster trends or major trends, just test what's most suitable for the symbol and timeframe you trade. Simply change the "Length" parameter and the indicator will automatically adapt. You can also change the color, thickness and style of the lines. Download and give it a try! There are big movements
99 USD
Follow The Line MT5
Oliver Gideon Amofa Appiah
4.38 (29)
This indicator obeys the popular maxim that: "THE TREND IS YOUR FRIEND" It paints a GREEN line for BUY and also paints a RED line for SELL. (you can change the colors). It gives alarms and alerts of all kinds. IT DOES NOT REPAINT and can be used for all currency pairs and timeframes. Yes, as easy and simple as that. Even a newbie can use it to make great and reliable trades. NB: For best results, get my other premium indicators for more powerful and reliable signals. Get them here: https://www.m
FREE
ADR ST Patterns Strategy
Vladimir Poltoratskiy
4.5 (4)
ADR ST Patterns Strategy  is a modification of the classical  ADR  indicator. This simple indicator corresponds to the parameters specified in the  ST Patterns Strategy ( https://stpatterns.com/ ) .  Structural Target Patterns represents the market consistently divided into components. No trend lines, geometric proportions of the model itself, trading volume, or open market interest are needed for the formation of  ST Patterns . They are easily recognized and built only on the basis of breaking
FREE
True Day
Aurthur Musendame
5 (1)
True Days is a tool designed specifically for the trader who wants to catch intraday volatility in price charts.  True day makes it easier for the trader to avoid trading in the dead zone - a period in time where markets are considered dead or non volatile. The trader can concentrate on finding opportunities only during periods of profound market movements. By default the indicator gives you a true day starting at 02:00 to 19:00 hours GMT+2. You can adjust according to your Time Zone. By deafult
FREE
ROMAN5 时间突破指标自动绘制日线的支撑和阻力突破箱体。它可帮助用户识别何处进行买入、卖出。当新信号出现时,它可发出提示和声音。它还具有发送邮件功能。您的邮件地址和 SMTP 服务器设置应该在 MetaTrader 5 的 "邮箱" 标栏里的设置窗口里指定。 蓝色向上箭头 = 买。 红色向下箭头 = 卖。 您可以使用一款我的移动止损产品,来自动移动止损,并包括设置盈亏平衡。 ROMAN5 分型移动止损   ROMAN5 抛物线SAR 移动止损 ROMAN5 布林带移动止损 ROMAN5 HeikenAshi 移动止损 ROMAN5 均线移动止损 ROMAN5 高级移动止损 如果您希望尝试 EA, 参见 ROMAN5 时间突破 EA 。 版本 1.2: 发送推送通知至移动终端。
FREE
Trend Fibonacci is a unique indicator that combines a power of Fibonacci sequences and ranges. How to read: - There are three zones --> red, gold and green - Red candlestick = downtrend - Green candlestick = uptrend   - Gold candlestick = no established trend Inputs: Per = number of bars used for calculations FirstRatio = first Fibonacci ratio (Or use any ratio you want) SecondRatio = second Fibonacci ratio (Or use any ratio you want) !! IF YOU PURCHASE THE INDICATOR, CONTACT ME FOR
FREE
Donchian Pro
Paulo Henrique Faquineli Garcia
5 (2)
The Donchian Channel Channels are among the most popular tools of technical analysis, as they visually convey to the analyst the limits within which most price movement tends to occur. Channel users know that valuable information can be obtained at any time, whether prices are in the central region of a band or close to one of the border lines. One of the best known techniques to explore these concepts is Bollinger Bands. However, John Bollinger was not the only one to research the applicatio
FREE
Binary Options Assistant (BOA) BOIL Signals Indicator provides signals based on Ana Trader Binary Options Strategy. Indicators: Stochastic Stop missing trades, stop jumping from chart to chart looking for trade set-ups and get all the signals on 1 chart! U se any of the BOA Signals Indicator with the  Binary Options Assistant (BOA) Multi Currency Dashboard .  All BOA Signal Indicator settings are adjustable to give you more strategy combinations. The signals can be seen visually and heard au
30 USD
Free automatic Fibonacci is an indicator that automatically plots a Fibonacci retracement based on the number of bars you select on the BarsToScan setting in the indicator. The Fibonacci is automatically updated in real time as new highest and lowest values appears amongst the selected bars. You can select which level values to be displayed in the indicator settings. You can also select the color of the levels thus enabling the trader to be able to attach the indicator several times with differe
FREE
SmartTrendMt5
Andrey Spiridonov
The SmartTrendMt5 trend indicator generates signals based on the principle of combined analysis of calculated reference points within the Keltner channel. The indicator plots the Keltner channel in a separate window (by default, red lines and a blue line - the middle of the channel), and also draws the histogram of calculated reference points for each candle (by default, the histogram bars are yellow). The should be attached to a chart of any timeframe and any trading symbol in the usual way.
450 USD
Spike Catch Pro
Amani Fungo
4 (5)
Spike Catch Pro 22:03 release updates Advanced engine for searching trade entries in all Boom and Crash pairs (300,500 and 1000) Programmed strategies improvements Mx_Spikes (to combine Mxd,Mxc and Mxe), Tx_Spikes,   RegularSpikes,   Litho_System,   Dx_System,   Md_System,   MaCross,   Omx_Entry(OP),  Atx1_Spikes(OP),   Oxc_Retracement (AT),M_PullBack(AT) we have added an arrow on strategy identification, this will help also in the visual manual backtesting of the included strategies and see h
FREE
Binary Options Assistant (BOA) BURN Signals Indicator provides signals based on Ana Trader Binary Options Strategy. Indicators: MACD & Stochastic Stop missing trades, stop jumping from chart to chart looking for trade set-ups and get all the signals on 1 chart! U se any of the BOA Signals Indicator with the  Binary Options Assistant (BOA) Multi Currency Dashboard .  All BOA Signal Indicator settings are adjustable to give you more strategy combinations. The signals can be seen visually and hea
30 USD
Universal Trend
Maryna Shulzhenko
The Universal Trend indicator was created to detect trends in price movement and allows you to quickly determine not only the direction of the trend, but also understand the levels of interaction between buyers and sellers. The indicator works on all timeframes and currency pairs. The indicator gives fairly accurate signals and it is customary to use it both in trending and flat markets. It is advisable to use the indicator in combination with other tools for more reliable signals and making a
111 USD
GoldTrader
Yashar Seyyedin
Please backtest with the exact balance of your live account before applying to real money. ==> If account balance is too low it may not trade at all! For MT4 version please contact via private message. martingale version is available here . Strategy description - Detect trend based on EMA18-EMA50-SMA200 alignment in three time frames: M15, H1, H4 - Trade in trend direction and exit when above alignment is broken. - The bot is tuned to trade XAUUSD(Gold). - The bot output is break even in rangi
FREE
Revolution martingale
Yaroslav Varankin
5 (2)
Revolution Martingale is an indicator designed for trading binary options on the M5 timeframe. Features: M5 Timeframe: It is recommended to use the indicator on the M5 timeframe for optimal trading. Trade Opening: Trades should only be opened when a signal appears on the 1st candle after opening and signal appearance. Signals: A blue rhombus indicates a potential upward purchase opportunity, while a red rhombus indicates a potential downward option purchase opportunity. Configured for Effective
FREE
Ultimate Retest
Nguyen Thanh Cong
3.67 (3)
Introduction The "Ultimate Retest" Indicator stands as the pinnacle of technical analysis made specially for support/resistance or supply/demand traders. By utilizing advanced mathematical computations, this indicator can swiftly and accurately identify the most powerful support and resistance levels where the big players are putting their huge orders and give traders a chance to enter the on the level retest with impeccable timing, thereby enhancing their decision-making and trading outcomes.
FREE
该产品的买家也购买
TrendMaestro5
Stefano Frisetti
note: this indicator is for METATRADER4, if you want the version for METATRADER5 this is the link:  https://www.mql5.com/it/market/product/108106 TRENDMAESTRO recognizes a new TREND in the bud, he never makes mistakes. The certainty of identifying a new TREND is priceless. DESCRIPTION TRENDMAESTRO identifies a new TREND in the bud, this indicator examines the volatility, volumes and momentum to identify the moment in which there is an explosion of one or more of these data and therefore the mome
777 USD
VTrende Pro
Andrii Diachenko
5 (1)
VTrende Pro - MTF indicator for trend trading with a display panel for MT5 *** Videos can be translated into any language using subtitles (video language - Russian) Although the signals of the VTrende Pro indicator can be used as signals of a full-fledged trading system, it is recommended to use them in conjunction with the Bill Williams TS. VTrende Pro is an extended version of the VTrende indicator. Difference between Pro version and VTrende: - Time zones - Signal V - signal 1-2 waves
697 USD
IVISTscalp5
Vadym Zhukovskyi
5 (2)
我们向您介绍iVISTscalp5指标,它不仅独特,而且在交易操作中也非常有效。该指标基于时间数据,是多年金融市场经验和深入分析的结果。iVISTscalp5指标是手动交易的优秀工具。便利性、简单性和可视化 - 所有的复杂性都隐藏在内部。我们将iVISTscalp5指标的设置和使用简化到了最大程度。该指标适用于MT5终端中您所拥有的所有金融工具。 操作时间为UTC+3的早上4点到晚上8点。 iVISTscalp5指标菜单(见截图1): History - 计算行情的周数 dT_min - 选择时间间隔的时间(分钟) TFline - 绘制水平成交量(时间帧) BARSline - 绘制水平成交量(条数) TFtrend1 - 绘制日线通道(时间帧) BARStrend1 - 绘制日线通道(条数) TFtrend2 - 绘制周线通道(时间帧) BARStrend2 - 绘制周线通道(条数) ALERT_TIMER - 设置闹钟 ALERT - 开启/关闭闹钟 Save - 开启/关闭将时间记录到文本文件。 图表上的红色和蓝色旗帜表示时间(VIST智能剃须系统的信号)。卖出信号为红旗,买入
800 USD
Tatino Super Signals is Non Repaint Indicator for Binary Option trading and Forex trading. Recommendations: Timeframe: All timeframes. For best results we recommend using it on M1, M5 and M15 timeframes. Currency pairs: All Pairs Account type: All Type Broker time: Any Brokers : Alls Binary Trading : Expired 1 Candle Buffer Buy=1, Sell=0, Entry Next Candle Recommended Forex trading stop loss : 15 pips Recommended  Forex tradingTake profit levels : 15 pips Specifications: Does not repaint  
1 499 USD
ZigZag de Suavizador
Cesar Juan Flores Navarro
Teniendo una entrada de precios suavizados, los cuales son procesador por un ZigZag en tiempo real, dando como resultado un suavizador ajustado a un ZigZag. Con valores de entrada (periodo) mayores se vuelve un poco lenta en M1,, Ideal para H1, H4, D1 Trabaja bien con otros suavizadores, ya que su intersección es ideal Al iniciar empiza con mayor precisión desde el momento de activación, siendo el historial (anterior) de referencia ----------------------------------------------------------------
600 USD
Recommended TimeFrame >= H1. 100% Non Repainted at any moment.  Use it carefully, only with Trend Direction. Trading Usage: 2 Variants: as Range System or as BreakOut System (Both Only With Trend Direction)::: (Always use StopLoss for minimise Risk); [1] as Range System: (Recommended) in UP TREND:  - BUY in Blue Line , then if price goes down by 50 points (on H1) open Second BUY.   Close in any Profit you wish: TrailingStop(45 points) or Close when Price touches upper Gold Line. in DOWN TR
5 500.95 USD
Ershov 38 parrots MT5
Aleksei Ershov
5 (1)
The indicator is designed to close positions on the market in time. For example: to take profits ahead of schedule if the price has not reached TakeProfit, and the market is turning around. The indicator analyzes the momentum, not the trend. He does not give any information about the trend. The indicator is well suited for finding divergence. The Ershov 38 Parrots indicator dynamically adjusts to the market and detects price movement impulses of medium and high amplitude. It almost does not rea
630 USD
Super Suavizador
Cesar Juan Flores Navarro
Indicador en MQL5 que obtiene el promedio de 10 EMAS que son alineadas y procesadas según Fibonacci luego el promedio es suavizado"  Se ingresa un número de 2 a N que multiplica los EMA-Fibonacci y por consiguiente aumenta los fibonacci, resultando un promedio.   Se ingresa un número que suaviza los EMA-Fibonacci. Considerando los números 1/1 seria la suavización minima. Considerando los números 3/5 seria la suavización media. Considerando los números 10/30 seria la suavización alta.....etc
1 000 USD
Entry Pro
Bartlomiej Tadeusz Tomaja
Entry Pro Indicator is a powerful multi-functional trading tool designed to increase your market entry accuracy. It combines the power of several key market trend indicators, including ATR Trailing Stop and both fast and slow EMA, to provide comprehensive market insight. It offers easy-to-interpret market entry signals represented by colored arrows. Also, it's fully customizable, allowing you to adjust ATR and EMA periods to suit your trading strategy. Trend filters and alerts can be toggled on
1 450 USD
Классификатор силы тренда. Показания на истории не меняет. Изменяется классификация только незакрытого бара. По идее подобен полной системе ASCTrend, сигнальный модуль которой, точнее его аппроксимация в несколько "урезанном" виде, есть в свободном доступе, а также в терминале как сигнальный индикатор SilverTrend . Точной копией системы ASCTrend не является. Работает на всех инструментах и всех временных диапазонах. Индикатор использует несколько некоррелируемых между собой алгоритмов для класси
6 250 USD
Pendiente de Precio
Cesar Juan Flores Navarro
Indicador en base a la pendiente de la linea de precio, dibuja una línea de color cuando sube a base de los precios que previamente has sido procesados o linealizados, y cuando baja la pendiente la linea linealizada toma otro color. En este caso se a considerado 6 lineas de diferentes procesos desde pendientes largas hacia las cortas, observándose que cuando coincidan las pendientes se produce un máximo o mínimo, lo que a simple vista nos permitirá hacer una COMPRA O VENTA.
1 000 USD
Индикатор Coefficient Of Determination (COD) представляет собой значение коэффициента детерминации или квадрат коэффициента корреляции между зависимой переменной — ценой и объясняющей переменной — тиковым объемом. Что это дает нам на практике? COD отлично распознает кульминацию трендовых движений, что позволяет подбирать оптимальные точки и ловить развороты рынка. Как использовать индикатор: Наиболее популярная торговая стратегия строится совместно с трендовым индикатором Moving Average (MA), пе
600 USD
Fibonacci Multiple 12
Cesar Juan Flores Navarro
Fibonacci Múltiple 12, utiliza la serie fibonacci plasmado en el indicador fibonacci, aumentadolo 12 veces según su secuencia. El indicador fibonacci normalmente muestra una vez, el presente indicador se mostrara 12 veces empezando el numero que le indique siguiendo la secuencia. Se puede utilizar para ver la tendencia en periodos cortos y largos, de minutos a meses, solo aumentado el numero MULTIPLICA.
1 000 USD
Linea Horizontal Inteligente
Cesar Juan Flores Navarro
En base a cálculos matemáticos de determino una linea Horizontal que cruza a todas las señales de trading, mostrando los máximos y mínimos. La linea horizontal parte en dos las subidas y bajadas de las señales de trading, de tan manera que es fácil identificar los máximos y mínimos, y es inteligente por que es sensible a las subidas y bajadas, afín de no quedarse en un solo lado por siempre, trabaja excelentemente con otros indicadores suavizadores ya que les garantiza que en un intervalo de tie
1 000 USD
Spike Detector
Tete Adate Adjete
this indicator is a Spike detector indicator, it is specially designed to trade Boom 1000, Boom 500, Crash 1000 and Crash 500 We recommend using it on Deriv Boom and Crash indices only Its setting is intuitive, familiar, easy to use it has notification functions; audible notifications and push notifications. this tool is simple to use, easy to handle This update is based on different strategies for spikes
2 500 USD
Escalera Inteligente
Cesar Juan Flores Navarro
Indicador en MQL5, recibe la información del precio SUAVIZADO, lo procesa anulando los picos inteligentemente, y el resultado lo envía al desarrollo de la escalera que iniciara y subirá o bajara según el peldaño o INTERVALO ingresado Ingreso PERIODO = 50 (variar segun uso) Ingreso MULTIPLICA AL PERIODO = 1 (variar segun uso) Segun la configuración la escalera puede pegarse o separarse de los precios,, Se aplica toda la linea de tiempo, y a todas las divisas, etc.  
1 000 USD
Fibonacci Suavizado
Cesar Juan Flores Navarro
Indicador en MQL5, que obtiene el promedio de 10 EMAS, que son alineadas según Fibonacci, obteniendo un promedio, que sera suavizado.  Se puede ingresar un numero desde 2 a N, que multiplica a los EMA-Fibonacci. Funciona en cualquier criptomoneda, etc. etc... pudiendo calcular el futuro segun la tendencia de las EMAS. Funciona excelentemente en tramos largos, determinando exactamente el mejor inicio/salida. El precio inicial por apertura sera por un periodo de tiempo, luego aumentará.
1 000 USD
Seconds Charts
Aleksandr Goryachev
Micro  ******************* Секундные графики MT5 ********************** Более точного инструмента для входа в сделку вы не найдёте. Входные параметры: Timeframe, sek - период построения графика, секунды Displayed bars - отображаемые бары Step of price levels, pp, 0-off - шаг отрисовки ценовых уровней, пункты Scale points per bar, 0-off - масштаб в пунктах на бар Show lines - отображение текущих уровней Show comment - отображение комментария Standard color scheme - стандартная цветовая сх
1 500 USD
QuantXSTocks Trading Range Indicator for MT5: INSTRUCTIONS TO USE OUR INDICATOR:- User needs to take trade on Arrow or after an Arrow CandleStick, You can achieve up-to 35-125 pips target by this Indicator. Best Timeframes for Stocks and Indices are M30 and H1: AMAZON M30 (50 pips) TESLA M30 (50 pips) APPLE M30 (50 pips) ADOBE M30 (50 pips) NASDAQ100 H1 (125 pips) The above are the approximate amount of pips you can achieve by this Indicator, Green arrow appears to be buy arrow while the Red a
965 USD
Trend and Signals MT5  indicator scans  30 trading Instruments (Forex, Metals and Indices).     It uses special algorithm on the  current market   based on   Pure Price Action   and display the overall trend and signal on the dashboard. When signals are produced the indicator sends alert and notification. Strategy for Signals This indicator uses the daily timeframe to determine the direction of the trend. The hourly timeframe is used to identify possible entries. Main trend and is determined by
1 500 USD
Cycles Forecast
Pooriya Alirezaee
This indicator is based on a mathematical formula and an ANN combined, designed to make a model(using previous prices) of the most recent market condition (any chart*) in order to use the model as a forecasting tool. *This indicator can operate on any chart/timeframe, but it's suggested you use multiple timeframes for each trade because this method relies solely on the time factor, you can not use this indicator to predict price volatility, but if it's fit correctly it will show you when the nex
1 449 USD
Robos
Namu Makwembo
Big promotion on the Robos, Get yours now Robos Indicator The   ROBOS   indicator is a multi timeframe oscillator that targets the   overbought   and   oversold  regions of a price chart, a signal is indicated by the two lines crossing, compatible with all tradable instruments Latest Release The latest release is the version 4.0 #What's new in version 4.0 ? Features Extreme oversold and overbought levels ROBOS version  4.0  comes with cool new feature , the ability to target on
900 USD
OrderFlowWay
Jean Jacques Huve Ribeiro
Indicator tested for 7 years with excellent results when used correctly An order flow tracking indicator when used at support and residence points simply shows the direction of the Big Players, validating good opportunities seek optimal risk-adjusted returns on their investments. Use when Flow line crossing at signal line after candle closed , works with absolutely everything
600 USD
BC Scalper Aroow
Tete Adate Adjete
This indicator is based on the crossing of two Moving Average with the RSI It is intended for scalpers Specially designed for Boom and Crash syhtetic indices from Binary.com/Deriv.com It is easy to use and intuitive. We recommend its use on M1 and is equipped with three types of notification Email alert Sound notification Push notification these parameters can be activated and deactivated.
8 000 USD
该指标提供了一种基于'回归通道工具'概念的强大市场分析方法。通过利用此工具,交易员可以在图表上对回归通道获得出色的控制,从而使他们能够做出更明智的交易决策。 '回归通道工具'是交易员工具箱中的一个强大工具。它旨在为价格趋势和潜在支撑和阻力水平提供有价值的见解。该工具特别适用于在趋势内部可视化修正波动,提供了对价格动态的综合视图。 以下是更详细地了解使用此指标的关键功能和优势: 通道水平和支撑/阻力:   该指标的主要优势之一是其能够生成作为动态支撑和阻力区域的通道水平。这些水平在确定潜在的入场和出场点方面至关重要,增强了交易策略的精确性。 修正波动水平:   通过启用修正波动水平,交易员可以在更大的趋势内识别潜在的修正。这个功能有助于识别回撤,并帮助交易员利用有利的价格波动。 直接控制:   该指标的控制面板允许无缝地操纵回归通道。交易员可以微调填充和射线选项等设置,提供符合其分析风格的通道定制视图。 更高时间框架分析:   为了获得更广泛的视角,该指标具有从更高时间框架加载数据的功能。这个功能可以帮助交易员评估不同时间尺度上的趋势和通道,促进对市场动态的更全面了解。 如何使用: 设置
1 000 USD
Use with JUMP 25. However it can can with the volatility indices as well because it is a modified version. It is advisable to use create a healthy account management. Measure your risk and happy trading. Other experts to be loaded soon. These are modified in order to optimise profits. Ideal candidates are high risk, high returns individuals who hold trades at a maximum of 1 - 2 hours
1 000 USD
This indicator is a scalping indicator intended solely for the Boom and Crash indices of the Deriv Limited market It supports Boom 500, Boom 1000, Crash 500 and Crash 1000 Not repaint and no bug The settings are intuitive and easy to use The product activation number is 20 The Time Frame used depends on the user If you are an aggressive scalper then just use M1 For long trades use M15 If you are conservative use M5 Please contact me for more details of its use
2 500 USD
RadioMedia
Cesar Juan Flores Navarro
Indicador de MQL5 basado en 3 EMAs, en función del precio. El precio influye en las EMAs, de tal forma que los Máximos y Mínimos solo la alteran minimamente, este influjo lo llame radio. Considerando la influencia del radio como constante, por lo que no tiene valores de entrada. Ideal para todas las criptomonedas. Funciona en todos los tiempos. Se sugiere operar cuando el precio este abajo y en bajada.... o cuando el precio este encima y en subida.
1 000 USD
Super Suavizador Inteligente
Cesar Juan Flores Navarro
El Super Suavizador Inteligente es la culminación de la evolución de los suavizadores en funcion del precio, funciona en todos los pares de divisas, es fácil de usar, y puedes usarlo varias veces en un mismo par, afin de darte una idea de hacia donde va el precio, muy util para ver la tendencia a largo plazo. El SSI trata siempre de formar ondas de subidas y bajadas a fin de poder mostrar el máximo y/o mínimo de la tendencia del precio.
1 000 USD
作者的更多信息
Weis Wave with Alert
Trade The Volume Waves Single Member P.C.
4.79 (19)
Rental/Lifetime Package Options and Privileges' * For optimum results the yearly or lifetime package is suggested due to live training and Discord  channel trading with the  creator! Rent Monthly Six Months   Yearly/Lifetime Weis Wave with Speed with Alert+Speed Index x x x Manual  x x x Quick Set up Video x x x Blog x x x Lifetime Updates x x x Setup and Training Material x x Free Rectangle Break Alert Tool      x Discord Access Channel "The SI traders" x 2-hour live methodology traini
599 USD
No Demand No Supply
Trade The Volume Waves Single Member P.C.
4.5 (4)
This indicator identifies No Demand –No Supply candles  to your chart and plots volume bars colored according to the signal. It can be applied to all timeframes or to a specific one only. It can also be used as regular volume indicator but with exceptional future of WEIGHTED VOLUME. Furthermore is has an alert notification, sound and email when a signals occurs. The indicator does not repaint but the alert will come on two candles back due to the definition of No Demand No Supply. The VSA (Volum
80 USD
Anchored VWAP with Alert
Trade The Volume Waves Single Member P.C.
5 (4)
What is the Volume Weighted Average Price (VWAP)? The volume weighted average price (VWAP) is a trading benchmark used by traders that gives the average price an instrument has traded at throughout the day, based on both volume and price.  It is important because it provides traders with insight into both the trend and value of the instrument. What is the Difference between VWAP and AVWAP? While VWAP is having as starting point the beggining of the day,week,month etc. in the AVWAP you can pla
80 USD
TrendLines Cross with Alert
Trade The Volume Waves Single Member P.C.
5 (2)
Trend Lines Cross  This indicator will alert you on any cross of a Trendline. You can draw up to two trend lines and form a channel, a pennant , a triangle or a simple trend and when the price crosses either trend line the indicator  will provide you with alerts that you define plus an up or down arrow when the cross happened. How to:   Draw the 1st trendline and name it tl1.  Draw the 2nd trendline and name it tl2. Select which type of alerts you would like in the indicator properties and you a
FREE
Anchored VWAP with Alert MT5
Trade The Volume Waves Single Member P.C.
What is the Volume Weighted Average Price (VWAP)? The volume weighted average price (VWAP) is a trading benchmark used by traders that gives the average price an instrument has traded at throughout the day, based on both volume and price.  It is important because it provides traders with insight into both the trend and value of the instrument. What is the Difference between VWAP and AVWAP? While VWAP is having as starting point the beggining of the day,week,month etc. in the AVWAP you can p
80 USD
Wave Anatomy
Trade The Volume Waves Single Member P.C.
4.5 (2)
Wave Anatomy Visit:   http://www.tradethevolumewaves.com   for more information Construct your own 5 Waves and analyze the price movements stages: Easy Movement Hard time to move Fast move This indicator is based on Wyckoff’s, David’s Weis and my Speed Index Theory. This indicator will you help analyze what is happening in 5 Price Waves that you can construct yourself. This tool is designed for scalpers and swing traders and will help them to analyze any wave on any timeframe at the same tim
300 USD
No Demand No Supply MT5
Trade The Volume Waves Single Member P.C.
No Demand No Supply   This indicator identifies   No Demand –No Supply candles  to your chart and plots volume bars colored according to the signal. It can be applied to all timeframes or to a specific one only. It can also be used as regular volume indicator  with exceptional future of WEIGHTED VOLUME. Furthermore is has an alert notification, sound and email when a signals occurs. The indicator does not repaint but the alert will come on two candles back due to the definition of No Demand No S
80 USD
Wave Anatomy MT5
Trade The Volume Waves Single Member P.C.
Wave Anatomy Visit:  http://www.trafethevolumewaves.com  for more information Construct your own 5 Waves and analyze the price movements stages: Easy Movement Hard time to move Fast move This indicator is based on Wyckoff’s, David’s Weis and my Speed Index Theory. This indicator will you help analyze what is happening in 5 Price Waves that you can construct yourself. This tool is designed for scalpers and swing traders and will help them to analyze any wave on any timeframe at the same time. Fur
300 USD
筛选:
Mr_Corazon
49
Mr_Corazon 2024.03.10 09:28 
 

I read a book by David Weis and watched a video of his, from there I found this product which has been developed by Takis. He is passionate about what he has created and he is generous with his offering of expertise and more importantly he is generous with his time. It looks very complicated but its quite simple in essence and time spent with the creator and programmer himself was a pleasure. Thank you for everything so far Takis. And here is to a plentiful 2024

Trade The Volume Waves Single Member P.C.
5349
来自开发人员的回复 Panagiotis Diamantopoulos 2024.03.10 09:39
Thank you for your honest review and kind words.
TruthMV
49
TruthMV 2023.06.03 00:23 
 

I just want to say thank for sharing your experience in putting together the "Weis Wave with Speedy Index Indicator". Using the Wyckoff Method, David Weis's Wave theory with Forex all in one. I would say it's not really a indicator, it's a way to read the charts for your self and not dependent on a line crosses this line or candle crossed a MA. I've been searching for many years trying to find some sort of logical process and common denominator in trading, I've spent thousands on all sort of esoteric books, platforms, data feeds etc. and was almost ready to quit, thinking I'm not smart enough to figure all this out. I've been applying the, "Trade The Volume Wave Method" for only three months, but I've had more consistent results and the confidence in what I'm learning will work. Even though I've made mistakes, now I know why and learn from them. Also, thanks for offering a two hour training session for free, for now, to get me up and running and the Discord Channel where we can discuss potential trades. Thank you Panagiotis (Takis) for giving all of us retail traders peace of mind and hope. Mark USA

Trade The Volume Waves Single Member P.C.
5349
来自开发人员的回复 Panagiotis Diamantopoulos 2023.06.03 06:12
Thank you for your kind words Mark.
mistaeff
159
mistaeff 2023.01.05 22:15 
 

Throughout my time using the MQL5 platform, I have never come across anyone who is more devoted to the success of their customers. The developer is a great guy, he spends hours sharing his knowledge and is a successful professional trader in his own right. He has developed a personal trading system, along with a pretty unique indicator that will enable you to consistently profit in the forex markets. I would highly recommend this product, whether you are starting a brand new strategy or even adding additional verifications to an existing strategy.

Trade The Volume Waves Single Member P.C.
5349
来自开发人员的回复 Panagiotis Diamantopoulos 2023.01.05 22:18
Thank you for your honest review!
Mark Renier
33
Mark Renier 2022.11.27 07:57 
 

I wanted to have Weis wave indicator in my charts and I decided for this indicator because additional features that it offers. Actually I changed the platform just to get Weis wave indicator and I decided for MT5. MT5 has its flaws, so I would rather recommend others to choose MT4 if they have to made the same decision. Support for this indicator is exelent. Takis is always available for help and he is answering any questions. And personal private teaching from Takis is also very valuable. Beside that you get access to private discord group where trade opportunites are shared and also other discussions regarding Weis wave. I would like to thank Takis for his help and support.

Trade The Volume Waves Single Member P.C.
5349
来自开发人员的回复 Panagiotis Diamantopoulos 2022.11.27 09:54
Thank you Mark.
baszim
240
baszim 2022.06.21 17:22 
 

For me this was a Ahaa moment. The indicator helped me understand Wyckoff methodology in a better way. It provides you most of the times a early warning signal when analysing trading ranges on 1hr timeframe. The plutus signals are kickoff from phase D, the jump across the creek or the fall through the ice. Accompanied with the two hours teaching of Takis, his rectangle warning tool and the Discord group, you have another set of tools that gives you a better reward percentage in you trading. Make no mistake, this isn't a set and forget indicator with a signal! You have to read the background of the chart yourself and validate the signals and or tune the indicator sensitivity. This must be done for each currency pair. That takes practice and patients and time. Thanks for the tools Takis and the ongoing support and sharing on Discord!

Trade The Volume Waves Single Member P.C.
5349
来自开发人员的回复 Panagiotis Diamantopoulos 2022.06.21 17:58
Thank you for your review Bas. It is worth noting what you mentioned about this not being a signal indicator, if it was that easy I would have created a robot trading but markets change and you need to be able to read them and adjust accordingly. This is a tool that will help read the market and understand Wyckoff better as you already mentioned. Thanks again for the review!
Sh_Mikhail
226
Sh_Mikhail 2022.01.31 08:21 
 

Very pleased with the purchase. The two hours training with Takis are extremely valuable, and it does not stop at that. He is using a community App to share a lot of tips and to explain the rational behind some of the trades he takes. That means we are getting continuous education to improve our skills using the indicator. He also shares signals with us which he does not have to do. Highly recommended if you are serious about improving your manual trading. Thanks a lot Takis for all your efforts. Highly appreciated

Trade The Volume Waves Single Member P.C.
5349
来自开发人员的回复 Panagiotis Diamantopoulos 2022.01.31 08:25
Thank you for your kind words! Trying my best to educate retail traders because I have been there and know how it is. Thanks again.
Leguar
65
Leguar 2022.01.07 11:43 
 

The indicator is just the tip of the iceberg. The real value is the education you get for the price of the indicator. I highly recommend it and thank you!

Trade The Volume Waves Single Member P.C.
5349
来自开发人员的回复 Panagiotis Diamantopoulos 2022.01.07 13:45
Thank you Leguar. Exactly as you mention, the real value is the education behind it and it is worth much more than the indicator. Furthermore, I think it is worthwhile to mention that I am trading with the indicator myself, not just selling it. Thanks again.
Sumit Dubey
1274
Sumit Dubey 2021.12.13 05:09 
 

Excellent indicator and support. Best part is , knowledge to apply indicator and understand market move is free with indicator. Must say , price for education not indicator. Thanks a lot Mr. Panagiotis !

Trade The Volume Waves Single Member P.C.
5349
来自开发人员的回复 Panagiotis Diamantopoulos 2021.12.13 07:22
Thank you Sumit, I hope you make lots of pips with it.
Andre Gomes
2766
Andre Gomes 2021.10.14 20:30 
 

Excellent indicator and customer support. This tool really gives you an edge. Totally recommend it.

Trade The Volume Waves Single Member P.C.
5349
来自开发人员的回复 Panagiotis Diamantopoulos 2021.10.14 20:45
Thank you Andre!
Rutt Tungkiratichai
1233
Rutt Tungkiratichai 2021.09.13 05:43 
 

This is the price for education not only indicator.This indicator open new world for me.

Trade The Volume Waves Single Member P.C.
5349
来自开发人员的回复 Panagiotis Diamantopoulos 2021.09.13 06:54
Thank you Rutt!
adonis4ex
6278
adonis4ex 2021.07.29 11:49 
 

用户没有留下任何评级信息

Trade The Volume Waves Single Member P.C.
5349
来自开发人员的回复 Panagiotis Diamantopoulos 2021.07.29 12:21
Thank you for your kind words Adonis4ex
satish vangipuram
33
satish vangipuram 2020.12.26 17:06 
 

this product and the methods taught by takis are geared towards practical trading purposes. there are not a lot of products out there about which this can be said. the personal mentoring and help by takis is high quality. he will work with you to develop a trading strategy. no bullshit. well worth the money.

SamitR
1231
SamitR 2020.06.23 00:13 
 

If there was a way I could give someone 100 stars , then this would be it !!!!! I have never had anyone like Panagiotis during all my time in the field of trading He literally held my hand and went through all the steps of how to use his fabulous indicators He is a true gentleman..God Bless

malmegrin
59
malmegrin 2019.12.04 18:27 
 

The Best Weis Wave indicator available!!!! Blazing fast and full of features. And the tech support is Awesome!!!!!! Thx a lot for the Work Mr. Panagiotis.

Eduardo Silva Vian
308
Eduardo Silva Vian 2019.11.30 05:00 
 

Excelente indicador. De todos weis wave, sem dúvida esse é o melhor. O speed index é muito efetivo para antecipar grandes movimentos, sem dúvida, o melhor indicador para rastrear o "smart money". Recomento. Um investimento que você não vai se arrepender.

Excellent indicator. Of all weis wave, no doubt this is the best. Speed index is very effective for anticipating large movements, arguably the best indicator for tracking smart money. I recommend it. An investment you will not regret.

Globex43
214
Globex43 2019.09.11 13:45 
 

Excellent!

回复评论
版本 10.0 2023.10.08
Added alerts for the two new signals PFBL and PFBS
版本 9.9 2023.10.08
Two more Fake Break Signals have been added:
PFBL - Plutus Fake Break Long
PFBS - Plutus Fake Break Short
版本 9.8 2023.07.17
New Wave Type added IPPR: Inverse Progressive Pip Rate. Please refer to the manual for a detail explanation!
版本 9.7 2023.03.12
Added a double signal of WS+PRL or WU+PRS when both conditions are met
版本 9.6 2023.02.14
New Feature added making the indicator faster by calculating part of the code only on New Bar creation. Just set "Calc OnNewBar=true"
This feature is extremely useful when you are working with Custom charts such as Tick Charts, Renko, Range, etc which are very CPU intensive but also if you have lots of charts open.
版本 9.5 2023.01.16
Fixed Plutus signal moving to next bars
版本 9.4 2022.12.23
Rollback
版本 9.3 2022.12.23
Fixed displaying Pips instead of Points on Autowaves
版本 9.2 2022.12.16
Updated Autowaves Algorithm - AutoSensitivity adjustment might be necessary.
New Feature - Auto Fast and Slow Waves
Setting Speed Index Display to 4 the indicator will display next to Speed Index the letter F="Fast" or "S"=Slow to designate if the wave is fast or slow compared to the Average Speed Index.
You can set how fast or slow from the Extreme_Threshold parameter. For example., if you set the Extreme Threshold to 0.5 (50%) then if the wave's speed index is less than 50% of Average Speed Index it will be signified as F=Fast wave or if the wave's speed index is greater than 50% of the Average Speed Index it will be signified as S="Slow".
版本 9.1 2022.12.08
New Improved Autowaves Algorithm.
You might need to adjust your Autosensitivity setting.
版本 9.0 2022.11.25
Fixed out of range bug
版本 8.9 2022.11.24
Improved Plutus Signals Algorithm
版本 8.8 2022.11.18
Improved real volume loop calculations
版本 8.7 2022.10.19
Code Improvements
版本 8.6 2022.10.11
Improve Autowaves Algorithm
版本 8.5 2022.10.07
Code Improvements
版本 8.4 2022.10.06
Fixed disappearing labels.
版本 8.3 2022.10.06
1. Added weighted average of Speed Index AvgWSI
2. Added weighted average of Speed Index of up waves uWSI
3. Added weighted average of Speed Index of dn waves dWSI
4. Code improvements
版本 8.2 2022.09.23
Fix a small bug on High Volume Alert
版本 8.1 2022.09.22
New feature
Added Wyckoff and Fake Break Signals.
Option to Display Avg Speed Index next to Speed Index
Keyboard Z button to refresh chart (needed for tick charts)
版本 8.0 2022.06.17
Various Code Improvements
版本 7.9 2022.03.08
Improved Speed Index Algorithm
版本 7.8 2022.02.28
Fix deleting all objects when changing timeframe after last update.
版本 7.7 2022.02.23
Display/Calculate or not Average SI
版本 7.6 2022.02.23
Code optimization made it faster
Fixed Object delete
Fixed Array out of Range
版本 7.5 2022.02.15
1. New Feature: Automatic Extreme Speed Index Alert for Slow and Fast Waves
2. Added different color for Plutus SIs
版本 7.4 2021.11.18
empty array error fixed
版本 7.3 2021.09.18
Code improvements om Speed Index Display
版本 7.2 2021.05.13
Fixed an array issue
版本 7.1 2021.04.28
Fix issue with Signal Alert
Removed Show Individual Signals
版本 7.0 2021.04.23
Plutus Patterns Signals added.These signals offer high probability Long and Short trades. No need to scan your charts for Plutus Patterns, just setup the alert and you are ready to get notified.
Recomended setting:
Show Plutus Signal=true
SI Ratio =2.0 (Speed Index Ratio)
Min Wave Bars = This is the total number of bars of both waves forming the pattern. I recommend 4 when trading the 1HR, 3 when trading higher TFs. The smaller TF you are trading the higher number.
版本 6.0 2021.03.01
All In One
Choose what Wave Type you would like to display:
Regular Volume, Pips, Progressive Volume Rate, Time or Emphasized Volume Waves
版本 5.3 2021.02.06
Code Improvement
Weight Volumed Algorithm Adjustment
版本 5.2 2021.01.29
Multiple Indicators can be added to the same chart
Show your orders or not on the chart
New Net Volume wave calculation according to Price Median
New Volume Filter = Progressive Volume Rate
版本 5.1 2020.12.18
Added Net Volume Waves option. Bulish Candle is considered a +volume and bearish Candlet is considered a -Volume.
The Net Volume Wave= Absolute(+volume-volume)
版本 5.0 2020.09.23
Labelshift code improvement,you need to adjust your Labeshift start with value =0.5 or 1 ,
Added Volume and SI display together
Added SI Multiplier
Remove weighted volume on specific bars, weighted volume calculates all bars
版本 4.9 2020.09.10
Updated SI Algorithm & changed indicator name
版本 4.8 2020.09.07
Added Weighted Volume features!
版本 4.7 2020.08.16
Added the option to Load All Bars or Specific Number of Bars
Weighted volume under development
版本 4.6 2019.09.19
Adjusted Weighted Volume - added all bars weight-added DayLight Savings
版本 4.5 2019.08.13
Updated Speed Index, Volume divider and Pip Divider
版本 4.4 2019.07.18
Adjusted Autowaves
版本 4.3 2019.07.15
Adjusted Autowaves Algorithm
版本 4.1 2019.06.02
Added display of AutoSensitivity parameter on chart
版本 4.0 2019.05.28
1. ****NEW Auto Volume Waves ****

AutoDifference: true/false - Neglects the Wave Direction difference and adjusts the Difference automatically creating more accurate waves.
AutoSensitivity: The higher the number the higher the sensitivity and therefore more waves are formed.
Format Parameters for Auto Difference value displayed on chart as "WV Difference:xx" (Corner, Y offset, X offset, Font, Font Size)

2. Adjusted Label Shift

版本 3.2 2019.03.31
Added parameters for Speed Index color and Speed Index Alerts color
版本 3.1 2019.03.21
Pip display adjustment.
版本 3.0 2019.03.21
Added Advanced Volume Filter that emphasizes on significant volume waves.
版本 2.0 2019.02.03
Major Update:
New functions added to the indicator
1. PipDivBy: Pips divider in order to avoid big numbers on the display
2. Ability to choose which labels to display: 1 - Volume, 2 -Pips, 3 -Bars, 4- ALL, 5- Volume and Pips

New Speed Index Display and Alert
Speed Index= Wave Volume/Pip Distance - which means how much volume was needed to move 1 pip. The smaller the number is the faster the wave is. The larger the number is the slower the wave is.

Alert functionality has been added if speed index is above a certain value and/or below a certain value.


Push Notification has been added on both Volume and Speed Index