Sniper MACD
- 指标
- Yaroslav Varankin
- 版本: 1.0
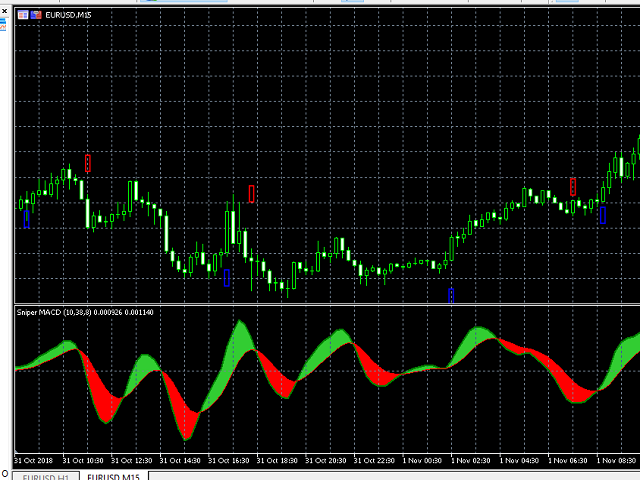
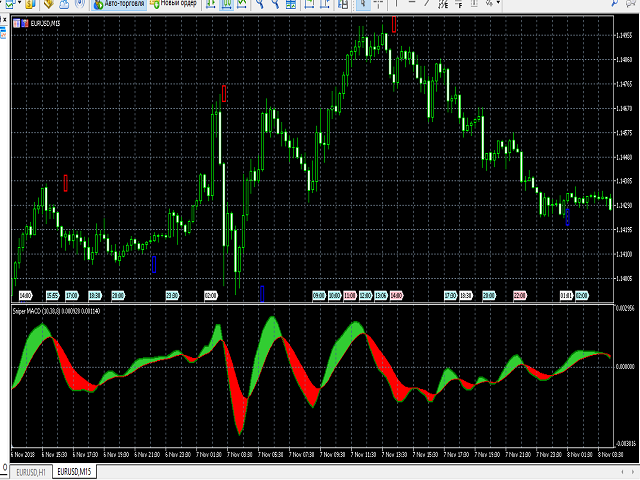
狙擊手MACD指標已通過多種方法得到改進。
還有一個額外的過濾器
它被平滑幾次以獲得最大的效果
還添加了一個音量指示器,以便更準確地顯示有關市場和當前價格狀況的信息
我建議您在m1到m30的時間範圍內使用該指標,因為它是針對短期時間幀配置的
我建議你用高度易變的貨幣對進行交易,例如eur.usd - eur.jpy
感謝您的關注和成功競標。
----------------------------------------------------
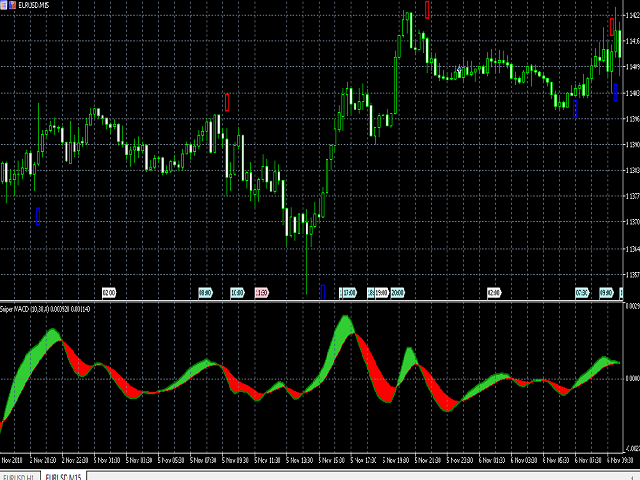
狙擊手MACD指標已通過多種方法得到改進。
還有一個額外的過濾器
它被平滑幾次以獲得最大的效果
還添加了一個音量指示器,以便更準確地顯示有關市場和當前價格狀況的信息
我建議您在m1到m30的時間範圍內使用該指標,因為它是針對短期時間幀配置的
我建議你用高度易變的貨幣對進行交易,例如eur.usd - eur.jpy
感謝您的關注和成功競標。


Gostei muito. Foi incluido no meu operacional.