Fibonacci Expansion and Retracement For 5
- 指标
- Jianyuan Huang
- 版本: 1.4
- 激活: 5
斐波那契折返和扩展画线工具
适用于MT5平台的斐波那契折返和扩展画线工具,非常适合于利用帝纳波利点位交易法和黄金分割交易的交易者
主要功能:
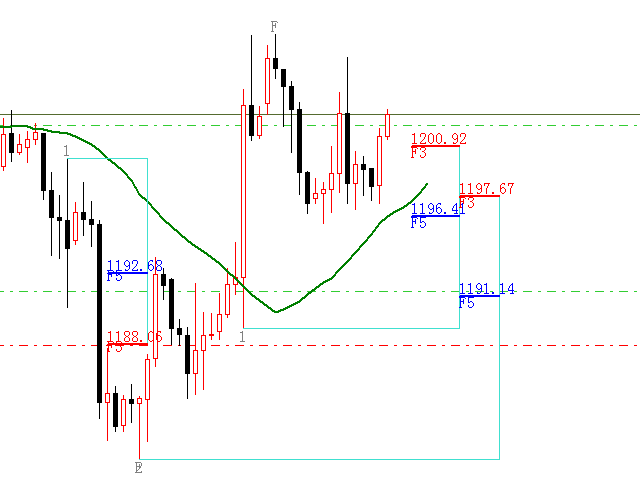
1.可以直接画线多组斐波那契折返,重要折返点之间的关系一目了然
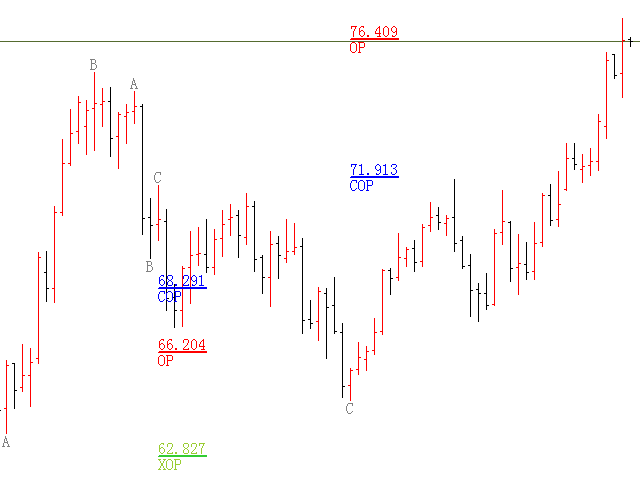
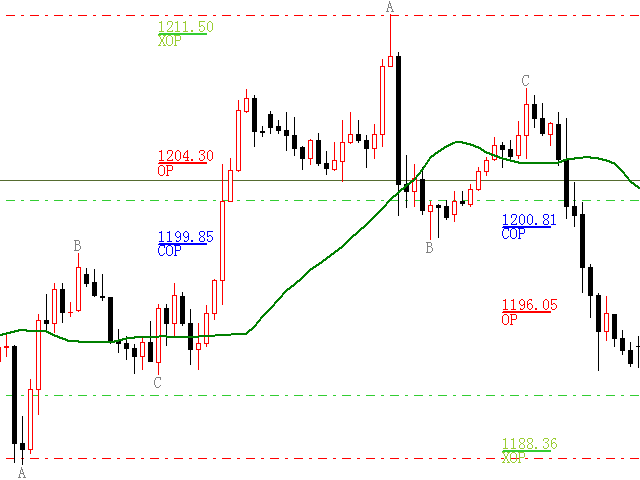
2.可以画出斐波那契扩展
3.画线的斐波那契折返和扩展均可左右移动方便观察,有数值显示
4.图表显示非常清爽
5.可通过数字键切换周期
功能键:
1.按 [ 画折返,按需画折返,最多可画8组
2.按 ] 画扩展
3.按 \ 删除当前周期下的所有扩展和折返
4.移动、删除折返和扩展
(1)点击第一组折返的F5线条,
点击1次(变成黄色),按键盘上的Delete可删除该焦点的折返。
点击2次(恢复颜色),可以移动折返到合适的位置
(2)点击COP的线条
点击1次(变成黄色),按键盘上的Delete可该组折返
点击2次(恢复颜色),可以移动扩展到合适的位置
5.修改折返和扩展:
(1)选择焦点F或反弹点数字(F或反弹点字体变大,变成黄色),移动鼠标。
(2)选择ABC三点中的某一个(字体变大,变成黄色),移动鼠标