• 概述
  • 评论
  • 评论 (2)

Renko Graph

Renko Graph


砖形图

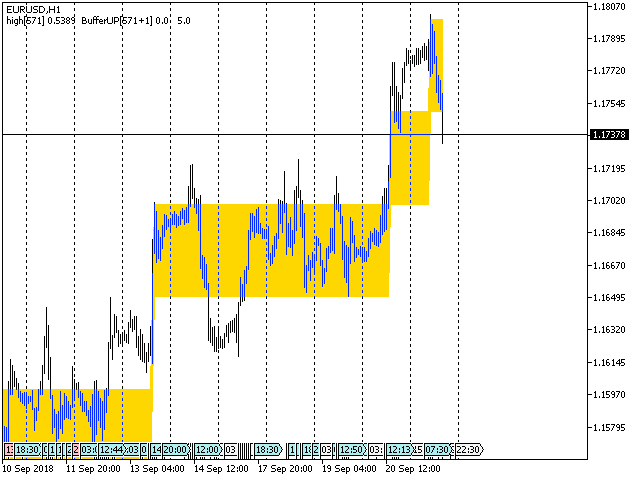
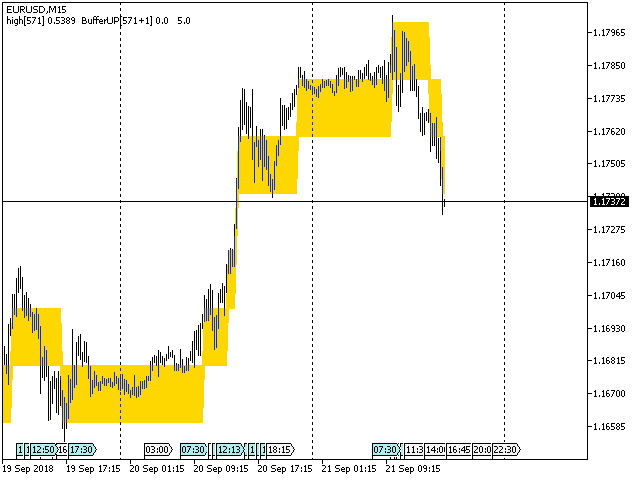
主图表窗口中当前价格位置的 Renko 指标。

该指标在常规报价图表的背景下以矩形(“砖块”)的形式显示价格变化。价格的向上移动(按设置中指定的点数)通过在前一个下一个矩形上方相加和向下移动 - 在前一个矩形下方相加来标记。

该指标旨在直观地识别主要趋势。用于确定关键支撑位和阻力位,因为它平均了潜在趋势。此视图不考虑小的价格波动(“噪音”),这使您可以专注于真正显着的变动。

仅当价格变动超过指定的阈值水平时,才会绘制高于或低于新的指标值。其大小在设置中设置并且始终相同。例如,如果基数为 10 点,而价格上涨了 20,则将绘制 2 个指标值。

该指标的优点是任何砖块都可以显示其形成时间的持续时间。如果价格在一定范围内波动,没有上涨和下跌的门槛值,那么砖将一直保持价格不变。

指标设置说明

  • 单元格 - 矩形(砖块)的阈值级别或高度,以磅为单位(例如,10 磅)。
  • RenkoPrice - 基于构建指标的价格,High_Low - 最大和最小价格值,_Close - 基于收盘价。

如果指标与价格图表重叠,请检查图表设置中前景值的图表。


推荐产品
Introduction to Smart Renko The main characteristics of Renko Charting concern price movement. To give you some idea on its working principle, Renko chart is constructed by placing a brick over or below when the price make the movement beyond a predefined range, called brick height. Therefore, naturally one can see clear price movement with less noise than other charting type. Renko charting can provide much clearer trend direction and it helps to identify important support and resistance level
Trend Direction ADX indicator for MT5
Renaud Herve Francois Candel
Trend Direction ADX indicator Trend Direction ADX is part of a serie of indicators used to characterize market conditions. Almost any strategy only work under certain market conditions. Therefore it is important to be able to characterize market conditions at any time: trend direction, trend strength, volatility, etc.. Trend Direction ADX is an indicator to be used to characterize trend direction: trending up trending down ranging Trend Direction ADX is based on ADX standard indicator.
Renko Plus
Eadvisors Software Inc.
With Renko Plus you can use the features in the Indicator functionality, just add it to the Metatrader5 chart.             The Renko chart is a type of chart, developed by the Japanese, that is constructed using price movement rather than standardized prices and time intervals like most charts. It is believed to be named after the Japanese word for bricks, "renga", as the graphic looks like a series of bricks.             A new brick is created when the price moves a specified p
Big Player Range
Thalles Nascimento De Carvalho
5 (2)
欢迎使用"BigPlayerRange"指标,这是一款技术分析工具,旨在识别市场中金融机构关注的重要区域。该指标提供了对大型市场参与者表现出相当活跃和关注的价格范围的精确分析。 主要特点: 1. 机构兴趣区域映射: "BigPlayerRange" 准确地突出显示金融机构表现出强烈活动的图表区域。这些点具有战略重要性,提供了对可能市场走势的见解。 2. 投影作为退出参考:除了识别关注区域,该指标还使用投影作为两个不同阶段可能退出的参考。这些投影帮助投资者基于未来可能的价格方向规划策略。 3. 返回到识别范围时的回撤概率: "BigPlayerRange" 的一个独特功能是当价格返回到关注范围时计算回撤概率。这有助于评估潜在的趋势反转。 如何使用 "BigPlayerRange": - 辨识关注区域:使用该指标辨识金融机构活动较多的区域。这些点可能对于预测重大波动至关重要。 - 投影作为退出参考:在计划市场退出时,使用投影作为参考。这些投影提供在关闭仓位时可能价格方向的见解。 - 评估回撤概率:在价格返回到已识别范围时注意回撤的概率。这有助
Reverso 1
Armand Gonto
Reverso 1.0 est un Indicateur Technique basé sur la tendance. Cet Indicateur intègre une formule exceptionnelle qui permet de décider au croisement du signal et du prix de clôture d'entrer dans le marché. Le timeframe indiqué est compris entre 2H et 1D. Les symboles que je conseille sont les suivants: BTCUSD-ETHUSD XAUGBP-XAUEUR-XAUAUD-XAGEUR-XAUUSD NZDJPY-GBPUSD-EURJPY-GBPJPY-USDJPY-CHFJPY-CADJPY-AUDJPY
Matreshka
Dimitr Trifonov
5 (1)
Matreshka self-testing and self-optimizing indicator: 1. Is an interpretation of the Elliott Wave Analysis Theory. 2. Based on the principle of the indicator type ZigZag, and the waves are based on the principle of interpretation of the theory of DeMark. 3. Filters waves in length and height. 4. Draws up to six levels of ZigZag at the same time, tracking waves of different orders. 5. Marks Pulsed and Recoil Waves. 6. Draws arrows to open positions 7. Draws three channels. 8. Notes support and re
Gino Renko
Stephane, Andr Valette
1 (1)
Another renko-based indicator. It returns different usable values ​​for an EA, and is directly displayed on the main chart. Its setting is very simple: The size of the renko The number of bars taken into account The falling color The color on the rise Returned values: Buffer 0 : Value of the middle Buffer 1 : Value of the Top Buffer 2 : Value of the Bottom Buffer 3 : Direction of renko (0.0 for top ; 1.0 for bottom) Buffer 4 : Ratio of the renko, for example, if it is twice, 3 times, ro more of
Trend Bands 5
Leonid Basis
Bands are a form of technical analysis that traders use to plot trend lines that are two standard deviations away from the simple moving average price of a security. The goal is to help a trader know when to enter or exit a position by identifying when an asset has been overbought or oversold. This indicator will show upper and lover bands. You can change input parameters nPeriod and  nMethod to calculate those bands for each timeframe. Aqua clouds represent up or down trends.
Trend Channel mt5
Tatiana Savkevych
Trend Channel is a Forex trend arrow indicator for identifying potential entry points. I like it, first of all, because it has a simple operating mechanism, adaptation to all time periods and trading tactics. Created based on a regression channel with filters. We display the signals of the Trend Channel indicator on the price function chart using a mathematical approach. How it works: when the price breaks through the overbought/oversold zone (channel levels), a buy or sell signal is generate
Basic Renko MT5
Mehran Sepah Mansoor
基本砖形指标在主图表上显示砖形框。 MT4版本 它的优点是您可以同时访问主图表和砖形图。 此外,您还可以了解形成每个砖形箱需要多少个砖块。 当发生逆转时,指标将通过弹出、推送和电子邮件警报通知您。 该指标没有复杂的设置,初学者和专业人士都可以轻松地在策略中使用它。 输入 Box Size :盒子的大小基于点 Upward Box Color :看涨盒子颜色 Downward Box Color :看跌框颜色 Box Opacity :不透明度量(0 到 100 之间的数字)透明度随着不透明度的减小而增加 Text Color :计算每个框中条形数量的数字的颜色 Font Size :数字文字大小 Max Bars :指标将执行计算的最大柱数[零表示所有可用柱] Pop-up alert :发生反转时向MT5终端发出提醒 Push Notification :发生逆转时向手机发出警报 Email :发生撤销时发送电子邮件
FREE
All about time and price by ICT. This indicator provides a comprehensive view of ICT killzones, Silver Bullet times, and ICT Macros, enhancing your trading experience.  In those time windows price either seeks liquidity or imbalances and you often find the most energetic price moves and turning points. Features: Automatic Adaptation: The ICT killzones intelligently adapt to the specific chart you are using. For Forex charts, it follows the ICT Forex times: In EST timezone: Session: Asia: 20h00-0
Advanced 4xZeovo MT5 Indicator (MetaTrader 5)   Product Description  4xZeovo is a powerful trading indicator system monitoring 24/7 financial markets. Metatrader5 tool designed to find the best buying/selling opportunities and notifies the user.    Making life easy for traders in helping with the two most difficult decisions with the use of advanced innovate trading indicators aiming to encourage users to hold the winning positions and take profit at the best times.    Equipped with a unique tra
Very special indicator of Joe Dinapoli which is a derivative from traditional MACD indicator. It shows the precise price, at which MACD will show line crossing and trend shifting. Also, this level is known one period ahead of time.You can constantly reassess your current position by looking at this studying a variety of timeframes. When you are in a trade, you have a feel for how much time you have for the trade to go your way by looking at the distance between the MACD Predictor line and the
Heiken Ashi Smoothed Strategy is a very simple but powerful system to get forex market trend direction. This indicator is actually 2 indicators in 1 pack, Heiken Ashi and Heiken Ashi Smoothed Moving Average both included. Because HA (Heiken Ashi) and HAS (Heiken Ashi Smoothed) are calculated in the same one system event with necessary buffers and loop only, so it is the FAST, OPTIMIZED and EFFICIENT HA having the combined indicator of MetaTrader 5. You can choose to display HA and HAS in the sam
The indicator is designed to work on any trading platform. The program is based on proprietary algorithms and W.D.Ganna's mathematics, allowing you to calculate target levels of price movement based on three points with the highest degree of certainty. It is a great tool for stock trading. The indicator has three buttons: NEW - call up a triangle for calculation. DEL - delete the selected triangle. DELS - completely remove all constructions. The probability of achieving the goals is more than 80
Owl Smart Levels MT5
Sergey Ermolov
4.47 (36)
MT4版本  |   FAQ Owl Smart Levels Indicator 是一個完整的交易系統,包含 Bill Williams 的高級分形、構建正確的市場波浪結構的 Valable ZigZag 以及標記準確入場水平的斐波那契水平等流行的市場分析工具 進入市場和地方獲利。 策略的详细说明 指示灯使用说明 顾问-贸易猫头鹰助手助理 私人用户聊天 ->购买后写信给我,我会将您添加到私人聊天中,您可以在那里下载所有奖金 力量在於簡單! Owl Smart Levels 交易系統非常易於使用,因此適合專業人士和剛開始研究市場並為自己選擇交易策略的人。 策略和指標中沒有隱藏的秘密公式和計算方法,所有策略指標都是公開的。 Owl Smart Levels 允許您快速查看進入交易的信號,突出顯示下訂單的水平並向您發送有關已出現信號的通知。 優點很明顯: 清楚地顯示主要和更高時間框架的趨勢方向。 指示儀器信號的出現。 標記開單、止損設置和固定利潤的水平。 沒有多餘的,只有必要的結構! ZigZag 表示全球趨勢的方向,因此也表示貿易方向。 市場反轉點的短線清楚地表明在什麼水平上構建斐波
LevelPAttern MT5 is a technical indicator based on the daily levels and Price Action patterns. The indicator is based on the standard ZigZag indicator + reversal candlestick pattens, such as Star, Hammer (also knows as Pin bar), Engulfing and others. The indicator generates audio and text notifications when a pattern is formed and a level is touched. It also supports sending email and push notifications. Indicator operation features It is suitable for working with any CFD and FOREX trading ins
Heiken Ashi EA MT5
Juvenille Emperor Limited
4.93 (15)
Heiken Ashi EA MΤ5   是一款全自动 EA 交易程序,用于以全新的方式交易经典或平滑 Heiken Ashi 蜡烛。   Heiken Ashi EA MT5   在第一根不同颜色的蜡烛收盘后打开单笔交易,并在每次 Heiken Ashi 颜色变化时打开相反的交易。 可以选择使用此 EA,方法是在第一根不同颜色的 Heiken Ashi 蜡烛关闭后打开第一笔交易,然后在每根蜡烛上打开新的同向交易,只要 Heiken Ashi 蜡烛的颜色保持不变。 一系列独特的设置使这款 EA 具有极高的通用性,例如选择第一笔交易将打开的 Heiken Ashi 蜡烛数量的选项(从第 2 笔到第 10 笔)以及限制相同方向交易之间的距离以避免太多相似水平交易的选项。 Heiken Ashi 蜡烛追踪设置将帮助您通过将交易止损置于任何过去的 Heiken Ashi 蜡烛来适应缓慢或快速变化的市场。 此 EA 带有许多符号/工具的新设置文件,专门针对 ECN 原始点差 ICMarkets 账户(基于纽约的 GMT+3 时区服务器)进行了优化。 可以使用其他经纪人或账户类型,但您可能需要进
Robust median Renko style indicator for creating custom charts resembling Median Renko, Mean Renko, Turbo Renko and Better Renko candles as well as vanilla Renko with wicks plus Point-O charts. This all in one package provides all of the signals needed by day traders, scalpers, and even long-term traders. Main characteristics The indicator is an overlay on the main chart so it is possible to utilize one-click trading and order manipulation directly on the custom charts. Visual order placement
RenkoFromRealTicks DEMO
Stanislav Korotky
1 (1)
This non-trading expert utilizes so called   custom symbols   feature to build renko charts based on history of real ticks of selected standard symbol. RenkoFromRealTicks generates custom symbol quotes, thus you may open many charts to apply different EAs and indicators to the renko. It also transmits real ticks to update renko charts in real time. This is a functionally limited demo version of  RenkoFromRealTicks . RenkoFromRealTicks utility can not work in the tester because it uses CustomSym
FREE
Professional renko charting on a custom symbol chart accurate pricing to the tick  accurate timeline (no future date projections ) every renko variation in a single package very responsive charts optional display of live trade levels on the chart An Expert Advisor (EA) used to create custom Renko charts and provide real-time updates. This is an MT4 "offline" chart equivalent which is very simple to use. All historical renkos are constructed using real tick data from the broker's server.
One of the most famous phrases in the trading world is "The Trend Is Your Friend". Trading following the current trend is one of the most successful ways in terms of probability. The hard part of it is to recognize when the market is trending or not. that's the role of our indicator we called The Trend Is Your Friend Until It Is Not. Apart from its big name it is really easy to use and see when the market is trending or ranging. Through a little window of 3 colors you will identify if the ma
Modified Bollinger Bands
Gennadiy Stanilevych
The standard Bollinger Bands indicator has been improved by integrating additional indications from the Standard Deviation indicator (StdDev), which gives an additional filter for confirming trading signals. In addition, the color of the indicator's lines shows the beginning of a trend, its development and exhaustion. This indicator has a signal block that notifies the trader of the beginning of the trend on any time frame to which it is attached. Settings Type of messages - select the type of
Fibo Expertt
Ignacio Agustin Mene Franco
Fibo expert! It is an automatic fibonacci indicator. adapting to any temporality, to catch those rebounds, or the path of that trend, special to make longs in H1 or H4 clear the trend, but it also works for scalp in m1 up to m15 works for all forex pairs and for all pairs of synthetic indices, ideal for volatility 75 in synthetics no more to enjoy good profit World Investor.
O Alpha B3 Renko Trader  é um robô especialista para negociação no Bovespa B3  (miniíndice e minidólar) que une a análise de candlesticks do gráfico Renko (calculado internamente, sem imagens gráficas) com a estratégia Alpha B3 . O robô permite configurar, para os sinais de entrada, o tamanho do brick do gráfico Renko, bem como um número de candlesticks para análise. Além disso, você deve configurar os stops fixos, em pontos. O robô permite também a configuração de funções, tais como número de c
ZigZag Lines MTF for MT5
Taras Slobodyanik
5 (7)
Multi timeframe ZigZag indicator. It displays the support/resistance horizontal lines and their breakouts, as well as draws the current targets of the market. It can also display lines of the Fractals indicator and candles from other periods (up to Quarterly).  The indicator redraws the last (current) point, and in some cases can change the last 2-3 points. All lines are drawn as objects (not indicator buffers, but there is a possibility to receive the data for the EA ). When used in an Exp
Madx Cobra MT5
Santi Dankamjad
Madx Cobra   Madx Cobra Indicator. Create to traders both experienced and inexperienced to use it because it is a basic indicator How to use : Setting Indicator 1. MA Fast  : Moving Average fast (10) 2. MA Slow :  Moving Average Slow control trend markets.(200) 3. ADX : Control trend(5) 4. For alert you can set to alert Next bar or instant bars.  When arrow sky blue show or arrow up, you can entry order "Buy" or "Long" and arrow red show or arrow down, you can entry order "Sell" or "Short"
Renko Chart
Marcin Konieczny
4.27 (11)
This indicator allows to display Renko charts in the indicator window. Renko charts show only price movements that are bigger than the specified box size. It helps to eliminate noise and allows to focus on main trends. Time is not a factor here. Only price movements are taken into account. That's why Renko chart is not synchronized with the main chart it is attached to. Indicator works in two modes: CLOSE - only close prices are taken into account while building the chart HIGH_LOW - only high/
FREE
Renko Profesional
Ignacio Agustin Mene Franco
Renko Professional, Safari pack indicator 2 . On this occasion it has the professional renko indicator, which has the strategy of support, resistance, bullish green line and bearish red line. It marks the entry points and accumulation points very well! It works for all seasons! For the forex markets and synthetic indices ! Works for all pairs! Good profit!
KT Renko Live Charts MT5
KEENBASE SOFTWARE SOLUTIONS
KT Renko Live Chart utility creates the Renko charts on MT5 that can be further used for speculation or live trading. The Renko chart created by this utility supports most of the custom indicators and automated Expert Advisors. Fully compatible with our Renko Patterns indicator and Renko Patterns EA . Features A simple and straightforward Renko utility that provides the Renko chart on MT5 without any complicated settings. It supports most of the custom indicators and Expert Advisors for 100%
该产品的买家也购买
Atomic Analyst MT5
Issam Kassas
3.64 (11)
首先值得强调的是,该交易指标是非重绘、非延迟的指标,这使其成为手动和机器人交易的理想选择。 Atomic Analyst是一种PA价格行动指标,利用价格的力量和动量来寻找市场上更好的机会。配备了高级过滤器,可帮助去除噪音和假信号,并提高交易潜力。使用多层复杂的指标,Atomic Analyst扫描图表,并将复杂的数学计算转化为任何初学者都能理解并用来做出一致交易决策的简单信号和颜色。 “Atomic Analyst”是专为新手和经验丰富的交易者量身定制的综合交易解决方案。它将高级指标和一流功能融合为一体的交易策略,使其成为所有类型交易者的多功能选择。 日内交易和剥头皮策略:专为快速准确的日内交易和短期交易而设计。 日内和摆动交易策略:可用作追求价格大幅波动的日内和摆动交易者的可靠工具。 多货币和市场:凭借其可靠的精度,在不同的工具和市场上运作。 多个时间框架:可在多个时间框架上使用,性能良好。 稳定性:所有指标均不重绘、不重绘和不滞后,确保可靠的信号。 信号清晰度:提供箭头信号,用于清晰的入场和出场点。 实时警报:通过交易入场、SL和TP警报通知交易者。 多个利润水平:使用
首先,值得强调的是,这个交易系统是一个非重绘、非重画和非滞后的指标,这使得它非常适合手动和机器人交易。 “智能趋势交易系统 MT5”是专为新手和经验丰富的交易者量身定制的综合交易解决方案。它结合了超过 10 个优质指标,具有 7 多个强大的交易策略,使其成为适用于各种市场条件的多功能选择。 趋势跟随策略:提供精确的入场和止损管理,以有效地跟随趋势。 反转策略:识别潜在的趋势反转,使交易者能够利用区域市场的机会。 剃头策略:专为快速准确的日内交易和短期交易而设计。 稳定性:所有指标都不会重绘、不会重画和不会滞后,确保可靠的信号。 定制:支持自定义策略,以满足个人交易偏好。超过 7 种策略和组合可帮助您找到最佳策略。 信号清晰度:提供箭头信号,以指示清晰的入场和退出点。 实时警报:通过交易进出警报使交易者保持了解。 深入分析:提供更高时间框架的趋势分析和实时交易监控。 自适应颜色编码:利用蜡烛颜色编码来显示成交量、趋势和反转蜡烛信号。通过蜡烛颜色分析市场方向。 “智能趋势交易系统 MT5”赋予交易者必要的工具,以便在各种市场条件下做出明智和战略性的交易决策。无论当前市场状态如何,都能够充满
Quantum Trend Sniper
Bogdan Ion Puscasu
5 (37)
介绍   量子趋势狙击指标 ,突破性的 MQL5 指标,正在改变您识别和交易趋势反转的方式!由拥有超过13年交易经验的资深交易员团队开发,     量子趋势狙击指标   旨在通过其创新的方式以极高的准确度识别趋势反转,将您的交易之旅推向新的高度。 ***购买量子趋势狙击指标,即可免费获得量子突破指标!*** 当量子突破指标识别出趋势反转时,它会向您发出警报和信号箭头,并建议您三个止盈水平。 它既适合新手交易者,也适合专业交易者。 量子 EA 通道:       点击这里 MT4版本:       点击这里 建议: 时间范围: 所有时间范围。为了获得最佳结果,我们建议在 M15、M30 和 H1 时间范围内使用它。 货币对:欧元兑美元、英镑兑美元、澳元兑美元、欧元兑英镑、, EURAUD,  XAUUSD 账户类型:ECN、Raw 或 Razor,点差极低 经纪时间:任意 经纪商:IC Markets、Pepperstone with Raw 和 Razor 的点差最低 建议止损:50 点 建议止盈水平:20 点、50 点和
FX Volume MT5
Daniel Stein
4.94 (17)
通过 mql5 和 Telegram 上 的 " 晨间简报 "获取每日市场更新,包括详细信息和屏幕截图 ! 外汇交易量(FX Volume)是第一个也是唯一一个从经纪商角度真正洞察市场情绪的交易量指标。 直接在您的图表上看到这些信息是真正改变游戏规则和突破性的交易解决方案。 受益于独特的市场数据洞察,如 比率(Ratios )显示货币多头和空头头寸的比率(百分比 比率变化 显示所选时间段内的多头比率及其百分比变化 总交易量 显示货币的总交易量(多头和空头),以手为单位 多头 交易量显示货币所有多头头寸的交易量 空头 交易量显示所有货币空头头寸的交易量 净多头 显示净多头交易量,即所有多头头寸减去所有空头头寸(以手为单位)。 净多头百分比 显示货币净多头交易量的变化 请阅读我们的基本教程 -> "如何使用外汇交易量进行交易 " 获取更多信息,如常见问题、交易技巧和教程视频,请访问我们的 外汇交易量公共信息频道 请 安装并运行 SI Connect 以建立与我们数据中心的持续连接 背景信息 我们都知道,外汇是一个分散的市场。这就是为什么我们必须打破常规思维,开发一个独
FX Power MT5 NG
Daniel Stein
5 (4)
通过 mql5 和 Telegram 上 的晨间简报获取每日市场更新,包括详细信息和屏幕截图 ! FX Power MT5 NG 是我们长期以来非常受欢迎的货币强度计算器 FX Power 的下一代产品。 这款下一代强度计算器能提供什么?您所喜爱的原版 FX Power 的所有功能 附加功能 黄金/XAU 强度分析 更精确的计算结果 可单独配置的分析周期 可自定义计算限制,以获得更好的性能 为希望查看更多信息的用户提供特殊的多实例设置 无尽的图形设置,可在每个图表中设置您最喜欢的颜色 无数的通知选项,让您再也不会错过任何重要信息 采用 Windows 11 和 macOS 风格的全新圆角设计 神奇的移动指标面板 FX Power 主要功能 所有主要货币的完整强势历史 所有时间框架内的货币强弱历史 所有经纪商和图表的计算结果完全相同 100% 可靠的实时计算 -> 无重绘 可通过下拉列表选择分析时段 通过自定义模式单独配置分析时段 可在一个图表中使用多个实例 可移动 FX Power 显示屏(通过拖放) 适用于高分辨率 QHD、UHD 和 4K 显示器 自动终端配置 针对平板电脑
Advanced Supply Demand MT5
Bernhard Schweigert
4.53 (15)
任何新手或专业交易者的最佳解决方案! 该指标是一款独特、高质量、且价格合理的交易工具,因为我们已经整合了许多专有功能和新公式。 依据此更新,您将能够显示双重时间帧区域。 您不仅可以显示一个较高的时间帧,还可以同时显示图表时间帧,加上更高的时间帧:显示嵌套时区。 供需双方所有交易者都会喜欢它。 :) 重要信息披露 高级供需的最大潜力,请访问 https://www.mql5.com/zh/blogs/post/720245   想象您的交易如何得以改善,是因为您能够精准定位入场或目标位吗? 构建于新的底层算法,它可以更轻松地识别出买卖双方之间的潜在失衡。 这是因为它以图形方式展示供需最强劲区域,及其过去的表现(显示旧区域)。 这些功能旨在帮助您更轻松地发现最佳入场区域和价位。 现在您可以针对您的交易品种和时间帧来优化和编辑区域强度! 高级供需指标适用于所有产品和时间帧。 它是一个新的公式,非常新的功能是两个区域强度函数可由用户输入进行调整! 这在交易中是一大优势。 当您学习如何使用专有功能,例如带有价格游离最小 X 因子的区域强度时,您能够判断该区域强劲与否。 供需区域用作警报触发器
RelicusRoad Pro MT5
Relicus LLC
4.81 (21)
现在$ 147(更新后增加到$ 499) - 无限帐户(PC或Mac) RelicusRoad 用户手册 + 培训视频 + 访问 Private Discord Group + VIP 身份 一种看待市场的新方式 RelicusRoad 是世界上最强大的外汇、期货、加密货币、股票和指数交易指标,为交易者提供保持盈利所需的所有信息和工具。我们提供技术分析和交易计划,帮助每一位交易者取得成功,从初学者到高级。它是一个关键的交易指标,可以提供足够的信息来预测未来的市场。我们相信一个完整的解决方案,而不是图表上几个没有意义的不同指标。这是一个多合一指标,显示无与伦比且非常准确的信号、箭头 + 价格行为信息。 RelicusRoad 基于强大的人工智能,提供缺失的信息和工具来教育您并使您成为交易专家,成为成功的交易者。 几乎所有技术指标都滞后,这意味着它们只能报告已经发生的事情。因此,他们只确认您过去可以看到的价格已经在哪里。我们相信领先指标可以预测未来价格,而无需重新绘制,也不要过度依赖可能改变并导致重新绘制的滞后指标。如果您根据滞后指标进行交易并建立头寸,您就知道您已
XQ Indicator MetaTrader 5
Marzena Maria Szmit
5 (1)
Step into the realm of Forex trading with confidence and precision using XQ, a cutting-edge Forex indicator designed to elevate your trading game to unprecedented heights. Whether you're a seasoned trader or just stepping into the world of currency exchange, XQ Forex Indicator empowers you with the insights and signals needed to make informed trading decisions. The signal conditions are a combination of three indicators, and XQ Forex Indicator only display  medium and long-term trends . The ind
Volume by Price MT5
Brian Collard
5 (3)
The Volume by Price Indicator for MetaTrader 5 features Volume Profile and Market Profile TPO (Time Price Opportunity). Get valuable insights out of currencies, equities and commodities data. Gain an edge trading financial markets. Volume and TPO histogram bar and line charts. Volume Footprint charts. TPO letter and block marker charts including split structures. Versatile segmentation and compositing methods. Static, dynamic and flexible ranges with relative and/or absolute visualizations. Lay
介绍     Quantum Breakout PRO   ,突破性的 MQL5 指标,正在改变您交易突破区域的方式!由拥有超过13年交易经验的资深交易员团队开发,     量子突破 PRO     旨在通过其创新和动态的突破区域策略将您的交易之旅推向新的高度。 量子突破指标将为您提供带有 5 个利润目标区域的突破区域的信号箭头,以及基于突破框的止损建议。 它既适合新手交易者,也适合专业交易者。 量子 EA 通道:       点击这里 重要的!购买后请私信我领取安装手册。 建议: 时间范围:M15 货币对:GBPJPY、EURJPY、USDJPY、NZDUSD、XAUUSD 账户类型:ECN、Raw 或 Razor,点差极低 经纪商时间:GMT +3 经纪商:IC Markets、Pepperstone with Raw 和 Razor 的点差最低 规格: 不重漆! 最多 5 个建议利润目标区域 建议止损水平 可定制的盒子。您可以设置自己的 Box Time Start 和 Box Time End。 接触 如果您有任何疑问或需要帮
Entry Points Pro for MT5
Yury Orlov
4.54 (157)
这款指标用于 MT5,可提供准确的入场交易信号,且无重绘。 它可应用在任何金融资产:外汇、加密货币、贵金属、股票、指数。 它将提供极其精准的评估,并告诉您何时开仓和平仓的最佳时机。 观看 视频 (6:22),其中包含一个仅处理单一信号的示例,该信号即可值回指标购价! 大多数交易者在 Entry Points Pro 指标的帮助下,在第一个交易周内即改善了他们的交易结果。 订阅我们的 Telegram 群 ! Entry Points Pro 指标的益处。 入场信号无重绘 如果信号出现,并得到确认,则它不会再消失;不像是重绘指标,它会导致重大的财产损失,因为它们可以在显示信号后再将其删除。 无差错开仓 指标算法可令您找到入场交易(买入或卖出资产)的理想时机,从而提高每位交易者的成功率。 Entry Points Pro 可操作任何资产 它允许您在 MT5 平台上交易任何经纪商的加密货币、股票、贵金属、指数、大宗商品和货币。 提供任何方向的信号 Entry Points Pro 指标提供针对任意价格走势的入场交易信号 - 上涨、下跌或横盘(横向)。
Blahtech Supply Demand MT5
Blahtech Limited
4.57 (14)
Was: $299  Now: $99   Supply Demand uses previous price action to identify potential imbalances between buyers and sellers. The key is to identify the better odds zones, not just the untouched ones. Blahtech Supply Demand indicator delivers functionality previously unavailable on any trading platform. This 4-in-1 indicator not only highlights the higher probability zones using a multi-criteria strength engine, but also combines it with multi-timeframe trend analysis, previously confirmed swings
ON Trade Gann Squares MT5
Abdullah Alrai
5 (1)
Gann 方块指标是一种强大的市场分析工具,基于 W.D. Gann 在其“市场预测数学公式”一文中介绍的数学概念。该指标融合了与平方数(如 144、90 和 52)有关的 Gann 技术,以及平方 9。此外,它还融入了  关于如何将平方 9 与通道和星形图案结合使用的方法。 用户手册和使用方式: 在使用该指标之前,我们建议您阅读用户手册,并与我们联系以获得任何澄清。您可以在我们的网站上找到完整的用户手册。 该指标提供了 MT5 的完整版本供购买,也提供了 MT4 的免费版本供测试。提供了两个版本的链接供您方便使用。 主要特点和功能: Gann 方块指标为您的交易环境提供了全套工具,使您能够基于几何图案和 Gann 的概念做出明智的决策。以下是主要特点: 平方 9 分析:   该指标可以绘制与平方 9 有关的各种元素,包括水平线、星形图案、网格、Gann 扇形等。这在您的图表上提供了 Gann 的几何概念的视觉表示。 Gann 方块:   该指标绘制了 Gann 方块 52、90 和 144,使您能够可视化和分析它们与价格走势的关系。 自由 Gann 星形图案:   该指标使您能够直接
TrendMaestro5
Stefano Frisetti
note: this indicator is for METATRADER4, if you want the version for METATRADER5 this is the link:  https://www.mql5.com/it/market/product/108106 TRENDMAESTRO recognizes a new TREND in the bud, he never makes mistakes. The certainty of identifying a new TREND is priceless. DESCRIPTION TRENDMAESTRO identifies a new TREND in the bud, this indicator examines the volatility, volumes and momentum to identify the moment in which there is an explosion of one or more of these data and therefore the mome
Gartley Hunter Multi
Siarhei Vashchylka
5 (5)
Gartley Hunter Multi - An indicator for searching for harmonic patterns simultaneously on dozens of trading instruments and on all classic timeframes: (m1, m5, m15, m30, H1, H4, D1, Wk, Mn). Manual (Be sure to read before purchasing) | Version for MT4 Advantages 1. Patterns: Gartley, Butterfly, Shark, Crab. Bat, Alternate Bat, Deep Crab, Cypher 2. Simultaneous search for patterns on dozens of trading instruments and on all classic timeframes 3. Search for patterns of all possible sizes. Fr
Blahtech Market Profile MT5
Blahtech Limited
5 (8)
Was: $249  Now: $99   Market Profile defines a number of day types that can help the trader to determine market behaviour. A key feature is the Value Area, representing the range of price action where 70% of trading took place. Understanding the Value Area can give traders valuable insight into market direction and establish the higher odds trade. It is an excellent addition to any system you may be using. Inspired by Jim Dalton’s book “Mind Over Markets”, this indicator is designed to suit the
Golden Spikes Detector
Batsirayi L Marango
5 (1)
Golden Spikes Detector This indicator is based on an advanced strategy primarily for trading spikes on Boom and Crash Indices. Complex algorithms were implemented to detect high probability entries only. It alerts on potential Buy and Sell entries. To trade spikes on the Deriv or Binary broker, only take Buy Boom and Sell Cash alerts. It was optimised to be loaded on 5-minute timeframe although multiple timeframe analysis is done in the background. Features ·             Desktop pop up and sound
Matrix Arrow Indicator MT5
Juvenille Emperor Limited
5 (14)
矩阵箭头指标 MT5   是一种独特的 10 合 1 趋势,遵循   100% 非重绘多时间框架指标 ,可用于所有符号/工具: 外汇 、 商品 、 加密货币 、 指数 、 股票 。 Matrix Arrow Indicator MT5 将在其早期阶段确定当前趋势,从多达 10 个标准指标中收集信息和数据,它们是: 平均定向运动指数 (ADX) 商品渠道指数 (CCI) 经典 Heiken Ashi 蜡烛 移动平均线 移动平均收敛散度 (MACD) 相对活力指数 (RVI) 相对强弱指数 (RSI) 抛物线SAR 随机振荡器 威廉姆斯的百分比范围 当所有指标给出有效的买入或卖出信号时,相应的箭头将打印在图表上,在下一根蜡烛/柱线开盘时,指示强劲的上升趋势/下降趋势。用户可以选择使用哪些指标,并可以单独调整每个指标的参数。 Matrix Arrow Indicator MT5 仅从选定的指标中收集信息,并仅根据其数据打印箭头。   Matrix Arrow Indicator MT5   还可以为所有新信号发送终端、推送通知或电子邮件警报。无论您是黄牛、日内交易者还是波段交易者, Mat
IX Power MT5
Daniel Stein
5 (2)
IX Power 终于将 FX Power 的无与伦比的精确性带到了非外汇交易符号中。 它能准确判断您喜爱的指数、股票、商品、ETF 甚至加密货币的短期、中期和长期趋势强度。 您可以 分析 终端提供的 一切 。试试吧,体验一下您在交易时如何把握 时机 。 IX Power 主要功能 100% 精确的非重绘计算结果 - 适用于您终端中的所有交易符号 下拉式选择预配置以及可单独配置的强度分析周期 通过电子邮件、消息和手机通知的无数种通知选项 可访问的 EA 请求缓冲区 可自定义计算限制,以获得更好的性能 为希望查看更多信息的用户提供特殊的多实例设置 无尽的图形设置,让您在每个图表中都能找到最喜欢的颜色 采用 Windows 11 和 macOS 风格的圆角新面板设计 神奇的移动指标面板,可在子窗口和主图表之间无缝移动 适用于高分辨率 QHD、UHD 和 4K 显示器,并针对平板电脑和触摸屏进行了优化 IX Power 参数 最重要的参数不言自明,但我们很快会在另一篇文章中为您提供所有 IX Power 参数的完整说明。 使用别名 "参数可为技术交易符号
Golden Gate Algo MT5
James David Lane
4 (6)
40% 圣诞优惠!价格将于1月1日涨至$250! 推出GoldenGate Entries:前沿交易解决方案! 发现与GoldenGate Entries(GGE)一同进行交易的革命性方法,这是一款设计用于提升您交易体验的先进指标。GGE提供了一套全面的功能,以赋予用户在交易决策中的精准和信心。 交易对:任意(外汇 - 商品 - 股票 - 股票 - 加密货币) 时间框架:15分钟至H1 主要特点: 买入和卖出箭头指示:接收伴随弹出警报的买入和卖出箭头指示,确保您随时保持了解。 GoldenGate_Algo:通过GoldenGate_Algo深入了解市场状况,这是一款强大的工具,用于评估市场是否处于“超卖”或“超买”状态。 当前趋势分析:通过访问您正在查看的时间框架上的当前趋势,保持领先地位,使您能够将交易与市场当前方向对齐。 内置枢轴点:使用内置的枢轴点轻松识别关键市场点,提供有价值的支撑和阻力水平。 蜡烛扫描器:分析蜡烛形态和图案,找到最佳的入场点并过滤掉低概率的入场。 完全定制:通过完整的定制选项,完全掌控您的交易体验,允许您个性化从
Bill Williams Advanced
Siarhei Vashchylka
5 (3)
Bill Williams Advanced is designed for automatic chart analysis using Bill Williams' "Profitunity" system. The indicator analyzes four timeframes at once. Manual (Be sure to read before purchasing) Advantages 1. Automatically analyzes the chart using the "Profitunity" system of Bill Williams. The found signals are placed in a table in the corner of the screen. 2. Equipped with a trend filter based on the Alligator indicator. Most of the system signals are recommended to be used only accordi
TPA True Price Action indicator reveals the true price action of the market makers through 100% non-repainting signals strictly at the close of a candle! TPA shows entries and re-entries, every time the bulls are definitely stronger than the bears and vice versa. Not to confuse with red/green candles. The shift of power gets confirmed at the earliest stage and is ONE exit strategy of several. There are available now two free parts of the TPA User Guide for our customers. The first "The Basics"
123模式 是最受欢迎,功能强大和灵活的图表模式之一。该模式由三个价格点组成:底部,峰值或谷值以及38.2%至71.8%之间的斐波纳契回撤位。当价格突破最后一个峰值或谷值时,该形态被认为是有效的,此时指标绘制箭头,发出警报并可以进行交易。 [ 安装指南 | 更新指南 | 故障排除 | 常见问题 | 所有产品 ] 清除交易信号 可自定义的颜色和尺寸 实施绩效统计 可定制的斐波那契回撤水平 显示适当的止损和获利水平 该指标可用于查找连续或反转形态 它是不可重涂和不可重涂的 它实现了电子邮件/声音/视觉警报 123模式 可以表现为连续或反转模式。为了简化操作,该指标使您可以选择要寻找哪种类型的形态,使其成为趋势或反转交易者的绝佳工具。 设置 将指标加载到任何图表时,将显示一组选项作为输入参数。如果您认为它们太多,请不要感到失望,因为参数被分组为不言自明的块。这就是每个参数块的作用。 幅度-幅度表示替代价格点之间的最小柱线量。要找到大图案,请增加幅度参数。要查找较小的模式,请减小幅度参数。 闵。回撤-形态中所需的最小斐波那契回撤。设置为零不对其进行评估。 最大。回撤-形态中可能
TrendDecoder Premium MT5
Christophe, Pa Trouillas
5 (1)
确定范围和下一步可能的走势    |     获得早期信号和趋势强度   |     在反转之前获得明确的退出   |     了解价格将测试哪些斐波水平   |  非重绘、非延迟指标 - 手动和自动交易的理想选择 - 适用于所有资产和所有时间单位 推出时为   69 美元 --然后恢复到 >>   149 美元 购买后,  请联系我的频道  获取推荐设置 MT4 版本: 点击此处 使用 BladeSCALPER 和 PowerZONES 获取我们的完整方法 它是什么? TrendDECODER 集多种创新于一身,使趋势监测变得简单易行。 投射趋势线(Projective TrendLine )--快速参考即将到来的趋势 实时趋势线(RealTime TrendLine) 与投射趋势线(Projective TrendLine)的对比 - 与之前的同方向走势相比,市场是加速还是放缓? 实时趋势线交叉 -   趋势正在偏离轨道 使用 GreyBox -   市场不再是趋势并进入新的过渡序列 使用 DecoderSignals 和 Blue/Orange Clouds
Quantum Heiken Ashi PRO MT5
Bogdan Ion Puscasu
4.5 (8)
Quantum Heiken Ashi PRO 简介 Heiken Ashi 蜡烛旨在提供对市场趋势的清晰洞察,以其过滤噪音和消除虚假信号的能力而闻名。告别令人困惑的价格波动,迎接更流畅、更可靠的图表表示。 Quantum Heiken Ashi PRO 的真正独特之处在于其创新公式,它将传统烛台数据转换为易于阅读的彩色条。红色和绿色条分别优雅地突出了看跌和看涨趋势,让您能够以非凡的精度发现潜在的进入和退出点。 量子 EA 通道:       点击这里 MT4版本:       点击这里 这一卓越的指标具有以下几个关键优势: 增强清晰度:通过平滑价格波动,Heiken Ashi 金条可以更清晰地反映市场趋势,使您更容易识别有利的交易机会。 减少噪音:告别经常导致错误信号的不稳定价格变动。 Quantum Heiken Ashi 指标可过滤噪音,使您能够做出更明智的交易决策 无缝集成:Heiken Ashi 指标专为 MetaTrader 开发,可无缝集成到您的交易平台中。它用户友好、高度可定制,并且与您的其他交易指标和过滤器兼容 无论您是寻求新优势的经验丰富的交易者,
Trades Assistant MT5
Martin Muriu Maina
Trade Assistant MetaTrader System  — a multi-timeframe system that is based on three standard indicators:   Stochastic oscillator ,   RSI   (Relative Strength Index), and   CCI   (Commodity Channel Index). It displays current trend directions for M1, M5, M15, M30, H1, H4, D1, W1, and MN1 timeframes. When you follow such an indicator you have a clear picture of the trends across all important timeframes. It doesn't matter which timeframe you attach this indicator to. Input parameters CheckCandl
Professional Scalping Tool on Deriv Attention! The indicator will be sold in limited quantities!!! Description: This trading indicator is designed for professional traders focused on scalping. Designed with the market in mind, it provides highly accurate spike trading signals. It works on the M1 timeframe and supports the following symbols: Boom 300 Index, Boom 500 Index, Boom 1000 Index, Crash 300 Index, Crash 500 Index, Crash 1000 Index. Functional Features: - Direction: - Trading is ca
TPSpro RFI Levels MT5
Roman Podpora
5 (5)
A key element in trading is zones or levels from which decisions to buy or sell a trading instrument are made. Despite attempts by major players to conceal their presence in the market, they inevitably leave traces. Our task was to learn how to identify these traces and interpret them correctly. Reversal First Impulse levels (RFI)   -  Version MT4                  INSTRUCTIONS                 RUS                 ENG                         R ecommended to use with an indicator   -  TREND PRO  
Gartley Hunter MT5
Siarhei Vashchylka
5 (13)
Gartley Hunter - An indicator for searching for harmonic patterns (Gartley patterns) and their projections. The indicator is equipped with a system of alerts and push notifications. Manual (Be sure to read before purchasing) | Version for MT4 Advantages 1. 12 harmonic patterns: 7 classical and 5 exotic. New patterns will be added as the indicator develops. 2. Constant automatic search for harmonic patterns. The indicator is capable of finding from the smallest to the largest patterns. 3. Autom
作者的更多信息
Line Profit
Iurii Tokman
5 (4)
Line Profit   存款货币的可视利润线指标。仅当市场上有安装指标的符号的未平仓头寸时才有效。您可以用鼠标移动线或启用自动跟踪买入价。 指标设置说明: colotLine - 线条颜色 WidthLine - 线宽 colotText - 文本颜色 FontSize - 文本的高度 Anchor - 文本的锚点方法 FollowBid - 跟随买入价 Line Profit   存款货币的可视利润线指标。仅当市场上有安装指标的符号的未平仓头寸时才有效。您可以用鼠标移动线或启用自动跟踪买入价。 指标设置说明: colotLine - 线条颜色 WidthLine - 线宽 colotText - 文本颜色 FontSize - 文本的高度 Anchor - 文本的锚点方法 FollowBid - 跟随买入价
FREE
ChannelRSI5
Iurii Tokman
5 (4)
ChannelRSI5   具有超买和超卖区域动态水平的相对强弱指数 (RSI) 指标。 动态水平随指标和价格的当前变化而变化和调整,代表一种通道。 指标设置 period_RSI - 计算 RSI 指数的平均周期。 Applied_RSI - 应用价格。它可以是任何价格常数:PRICE_CLOSE - 收盘价,PRICE_OPEN - 开盘价,PRICE_HIGH - 期间的最高价,PRICE_LOW - 期间的最低价,PRICE_MEDIAN - 中间价(高 + 低) / 2, PRICE_TYPICAL - 典型价格(最高价 + 最低价 + 收盘价)/ 3, PRICE_WEIGHTED - 加权平均价,(最高价 + 最低价 + 收盘价 + 收盘价)/ 4。 period_channel - 超买超卖区域动态通道的计算周期。
FREE
StopLevel
Iurii Tokman
5 (2)
StopLevel   仪表控制 STOPLEVEL 水平。当液位发生变化时,它会发出警报信号。 STOPLEVEL - 设置止损订单的当前收盘价的最小抵消点数,或允许的最小止损/止盈点数。 STOPLEVEL 的零值意味着没有限制止损/止盈的最小距离,或者交易服务器使用外部机制进行动态水平控制,无法传输到终端。在第二种情况下,STOPLEVEL 实际上是“浮动的”。 指标设置: color_ - 级别的区域颜色 draw_bars - 用于显示级别区域的条数 width_price - 价格标签的厚度   仪表控制 STOPLEVEL 水平。当液位发生变化时,它会发出警报信号。 STOPLEVEL - 设置止损订单的当前收盘价的最小抵消点数,或允许的最小止损/止盈点数。 STOPLEVEL 的零值意味着没有限制止损/止盈的最小距离,或者交易服务器使用外部机制进行动态水平控制,无法传输到终端。在第二种情况下,STOPLEVEL 实际上是“浮动的”。 指标设置: color_ - 级别的区域颜色 draw_bars - 用于显示级别区域的条数 width_price - 价格标签的厚度
FREE
Smart YTG
Iurii Tokman
4.67 (6)
Smart YTG   MT5 终端的顾问版本。   |   所有产品 Smart YTG 用于处理 GBPUSD 货币对,图表周期 H1。从本质上讲,该系统具有趋势并且在带有 STOP 订单的价格变动趋势部分完美运行,趋势是通过分析 内置于 EA 内部的价格通道 指标来确定的;无需额外安装该指标。在平盘区,当行情优柔寡断且行情进一步走势确定时,提现系统开始运行而不会亏损,如果市场上有与价格走势方向相反的头寸,则为价格变动方向与订单重叠,当达到总利润时平仓整个系列仓位,而Equity不下跌,保持平衡线,从测试结果可以看出。 代码中的大量计算,以及其中最大的一部分,恰好属于市场形成平台的时刻,您需要在没有回撤和亏损的情况下摆脱它进入趋势。为此,有一个用于动态平仓和静态平仓的块。 动态平仓 - 当强制平仓订单达到设定的总利润时平仓。 静态 - 计算价格水平,当达到该水平时,所有未平仓头寸将产生利润,并将所有未平仓头寸的止盈和止损修改为该水平。两个区块都有自己的设置,可以相互独立工作。使用 EA 交易时,可以同时使用这两个块,因为它们弥补了缺点并在工作中相互补充。 例如:假设由于各种原因,例
Robo T
Iurii Tokman
Robo T   Robo T Expert Advisor 是一个非指标交易系统。 顾问设置说明: Level_ord   - 与当前价格的距离,用于放置开始挂起的 Buy Stop 和 Sell Stop 订单,默认为 22。 Lot_1   - 一系列购买的初始手数,默认为 0.1。 Lot_2   - 一系列销售的初始手数,默认为 0.1。 TakeProfit   - 利润水平,默认为 30。 TSProfitOnly   - 仅拖网利润。禁用时,尾随也会出现在止损的负区域。默认值为真。 TStop.Buy   - 购买的尾随点数,默认为 13。 TStop.Sell   - 以点为单位的跟踪销售点数,默认为 13。 TrailingStep   - 以点为单位的尾随步长,默认为 2。 level_1   - 放置平均订单的回撤距离,默认为 40。 level_2   - 放置平均挂单的当前价格的距离,默认为 15。 сoef_lot_1   - 平均订单的手数倍增因子,默认为 1.5。 Lot_Digits   - 手数中小数点后的位数。如果最小手数 = 0.1,则 Lot
Firm
Iurii Tokman
Firm   EA 不使用指标,它一直在市场中。顾问的逻辑基于对市场上已打开订单的分析。 顾问设置说明: StopLoss_Percent - 损失水平,百分比 TakeProfit - 利润水平,以点为单位 风险 - 自动确定 EA 订单量的设置,适用于 LOT = 0 LOT - 固定数量的订单 Slippage - 最大允许的价格滑点 MagicNumber - 顾问订单的幻数 Show_Information - 启用或禁用信息板 color_background - 背景颜色 color_text - 文本颜色 color_negative - 负值的颜色 color_positive - 正值的颜色 EA 不使用指标,它一直在市场中。顾问的逻辑基于对市场上已打开订单的分析。
Bar Boss
Iurii Tokman
5 (1)
Bar Boss   Expert   Advisor 使用 FletBoxPush 指标来分析市场并确定交易信号。该指标内置于“EA 交易”中,不需要在图表上额外安装。交易发生在定义为平台边界的水平上。使用损失限制。 顾问设置说明 TimeFrames - 图表周期,指标设置 颜色 - 定义为平面的价格区域的颜色,为指标设置 矩形 - 显示定义为平坦的价格区域,为指标设置 手数 - 起始交易量 MagicNumber - 订单的幻数 Count_LOSS - 连续亏损交易的数量,之后将设置为零利润(退出为零) FlatPips - 以点为单位确定平台,设置指标 FlatBars - 用于确定平面的柱数限制,为指标设置 MinBarsClosedOutside - 收盘价固定在特定平面水平之上/之下的柱数 CoefficientLot - 亏损后后续交易手数的乘数 CoefficientTakeProfit - 根据确定的平台的通道宽度计算的利润乘数 PercentLoss - 损失百分比,如果顾问带来的总损失低于此值,交易停止,该值必须设置为负数,例如:-33.3 顾问如何工
Adaptive MA
Iurii Tokman
Adaptive MA   移动平均线。计算方法是柱形定义中使用的所有价格的平均值。 指标外部设置说明: MA_period   - 计算指标的平均周期。推荐值:5、13、21、34。 ma_method   - 平均方法。可以是任何移动平均法值。 0 - (SMA) 简单移动平均线。 1 - (EMA) 指数移动平均线。 SMMA 2 - (SMMA) 平滑移动平均线。 LWMA 3 - (LWMA) 线性加权移动平均线。   移动平均线。计算方法是柱形定义中使用的所有价格的平均值。 指标外部设置说明: MA_period   - 计算指标的平均周期。推荐值:5、13、21、34。 ma_method   - 平均方法。可以是任何移动平均法值。 0 - (SMA) 简单移动平均线。 1 - (EMA) 指数移动平均线。 SMMA 2 - (SMMA) 平滑移动平均线。 LWMA 3 - (LWMA) 线性加权移动平均线。
MovingInWL
Iurii Tokman
MovingInWL   Expert Advisor 旨在在达到某个预定利润水平时将未平仓头寸的止损移至无亏损。 顾问设置说明: MagicNumber - 订单标识符 LevelProfit - 位置必须达到的利润水平,以点为单位,以便将其止损移动到没有损失的水平。 LevelWLoss - 不亏损的点数水平,当其盈利达到 LevelProfit 点数 水平后,止损头寸将转移到该水平。 MovingInWL   Expert Advisor 旨在在达到某个预定利润水平时将未平仓头寸的止损移至无亏损。 顾问设置说明: MagicNumber - 订单标识符 LevelProfit - 位置必须达到的利润水平,以点为单位,以便将其止损移动到没有损失的水平。 LevelWLoss - 不亏损的点数水平,当其盈利达到 LevelProfit 点数 水平后,止损头寸将转移到该水平。
FREE
Shadow Height mt5   阴影指示器。 将烛台阴影的大小(以点为单位)显示为直方图。在两种模式下工作,用户可选择。 指标设置说明 Mode - 指标操作模式,两种模式:第一种高度 - 上下烛台阴影的显示模式;第二个区别是显示烛台阴影差异的模式,上下烛台阴影之间的差异。 Shadow Height mt5   阴影指示器。 将烛台阴影的大小(以点为单位)显示为直方图。在两种模式下工作,用户可选择。 指标设置说明 Mode - 指标操作模式,两种模式:第一种高度 - 上下烛台阴影的显示模式;第二个区别是显示烛台阴影差异的模式,上下烛台阴影之间的差异。   阴影指示器。 将烛台阴影的大小(以点为单位)显示为直方图。在两种模式下工作,用户可选择。 指标设置说明 Mode - 指标操作模式,两种模式:第一种高度 - 上下烛台阴影的显示模式;第二个区别是显示烛台阴影差异的模式,上下烛台阴影之间的差异。
FREE
Comb
Iurii Tokman
3.5 (2)
Comb   指示器显示蜂窝网格或正六边形。替代标准交易终端网格。 指标设置说明: color_comb - 网格颜色 width - 宽度,例如:22为1920*1080分辨率的屏幕,15为1366*768分辨率的屏幕等。 height - 高度,例如:6代表分辨率为1920*1080的屏幕,4代表分辨率为1366*768的屏幕等。   指示器显示蜂窝网格或正六边形。替代标准交易终端网格。 指标设置说明: color_comb - 网格颜色 width - 宽度,例如:22为1920*1080分辨率的屏幕,15为1366*768分辨率的屏幕等。 height - 高度,例如:6代表分辨率为1920*1080的屏幕,4代表分辨率为1366*768的屏幕等。
FREE
Hammering
Iurii Tokman
Hammering   Hammering 是一种自动交易系统,旨在处理任何货币对。交易时,使用多币种和单币种模式。 为了做出交易决策,EA 使用来自 斜率方向线 指标的信号。 设置说明。 Profit_Percent_AccountEquity = 0.4; - 利润水平占可用资金的百分比 Fix_AccountEquity = 0; - 免费资金的强制性水平 FIX_PROFIT = 1000; - 强制利润水平 周期 = 55; - 指标期。 过滤器编号 = 2; - 指标过滤器。 ma_method = 3; - 指标的平均方法。 应用价格 = 0;是指标的使用价格。 TF = 15; - 指标的图表周期。 PAIRS = "EURUSD, GBPUSD, USDCHF, USDJPY"; - 一组用于多货币交易的货币对。 幻数 = 6; - 顾问的订单标识符 TrailingStart = 9.5; - 以点为单位的利润水平。拖网的起始水平,在此之后进行拖网,即开启拖网。 追踪止损 = 0.5; - 以存款货币为单位的固定拖网规模 尾随步长 = 0.5; - 存款货币的尾随步
Robo Grid FX
Iurii Tokman
Robo Grid FX   ROBO GRID FX 是一个网格专家顾问。 专为活跃市场和快速货币对的日内交易而设计。它是一个具有封闭平均系统的网格顾问。在快速和激进的货币对出现存款减少的情况下,闭环平均系统是一种稳定的盈亏平衡策略。 EA 在两个方向放置一个挂单网格,如果出现负仓位,则在价格波动突破 40-60 点走廊时将其锁定。并且它开始显示在网格内部(无需在两个方向移除暴露的网格)以达到盈亏平衡。并且报价在哪个方向(向上或向下)中断通道并不重要。 EA 不会让市场头寸回撤超过 25-40 点,止损和止盈会根据情况和报价的方向或反转不断修改。随着强劲的趋势运动,机器人只是跟随趋势。 所有计算都是根据专家核心内部的预定算法执行的。因此,“EA 交易”具有最少的设置集,这使其更易于使用。 EA 还具有针对浮动点差的保护,这使其运行更加稳定,并确保在浮动点差快速变化的情况下正确放置网格。智能交易系统显示反弹、强劲趋势和重要经济新闻的最佳结果。 设置说明: 批量 - 数量。 步骤 - 订单之间的步骤。 Steps Sell - 第一个村庄和第一个购买之间的距离。 TakeProfit -
Crazy Scalper
Iurii Tokman
3.5 (4)
Crazy Scalper   Crazy Scalper 是一种非指标交易机器人,它使用剥头皮系统同时在两个方向进行交易(买入和卖出)。同时,多向仓位无法盈利,其中一个仓位必然会亏损。如果有亏损仓位,则使用锁(lock)。反过来,如果锁定头寸没有完成其作用并且报价反转,则根据平均系统,使用挂单无损失地使用提款。 MT5 终端 智能交易系统 设置说明 止盈 = 3;   - 以点为单位的利润水平; Lock_Level = 22;   - 下锁订单的距离,以点为单位; coef_l = 1.8;   - 大量锁定订单的乘数; 止盈_Av = 10;   - 所有未结订单的总利润水平; AV_Level = 50;   - 触发平均顺序的距离,以点为单位; OR_Level = 24;   - 从当前价格到放置平均挂单水平的距离; coef_av = 2.0;   - 很多平均订单的乘法系数; 手数 = 0;   - 订单量,如果= 0,MM有效; 风险 = 0.3;   - MM 工作的百分比水平; Choice_method = false;   - MM的工作方法,来自免费资金
Pyramid MA
Iurii Tokman
5 (1)
Pyramid MA   金字塔 MA   - 顾问特性:它使用移动平均线 (MA) 指标。当趋势逆转时更改订单网格。主要交易网格的订单量相对于平均仓位增加的指数。处理挂单 BUYSTOP 和 SELLSTOP。使用损失平均系统来控制未平仓交易的余额并使它们达到收支平衡。有关未完成和已完成交易的声音通知。您可以基于 PYRAMID MA Expert Advisor 轻松创建自己的交易策略。 顾问设置说明: koef_grid = 0.5 - 大量网格订单的倍增因子 指标设置: tf_grid = 0 - 下单时接收指标信号的图表周期。可以是图表上的期间之一。 0 表示当前图表的周期。 1分钟。 5 - 5 分钟。 15-15 分钟。 30 - 30 分钟。 60 - 1 小时240 - 4 小时。 1440 - 1 天。 10080 - 1 周。 43200 - 1 个月。 tf_lock = 60 - 锁定订单时从指标接收信号的图表周期 tf_aw = 60 - 平均订单时从指标接收信号的图表周期 shift = 1 - 从指标缓冲区接收值的索引(相对于当前柱移动指定的周期数)
Boom
Iurii Tokman
Boom   交易机器人基于指标分析。交易决策是根据移动平均线的读数做出的,指标可以使用外部变量进行配置: TF = 0 - 选择图表的工作周期。可以是图表上的期间之一。 0 表示当前图表的周期。 1分钟。 5 - 5 分钟。 15-15 分钟。 30 - 30 分钟。 60 - 1 小时240 - 4 小时。 1440 - 1 天。 10 080 - 1 周。 43,200 - 1 个月。 shift = 0 - 从指标缓冲区接收值的索引(相对于当前柱移动指定的周期数)。 period_fast = 5 - 快速移动平均线指标的周期。 period_slow = 12 - 缓慢移动平均线指标的周期。 mehod = 0 - 平均法。可以是任何移动平均法值。 0 - (SMA) 简单移动平均线。 1 - (EMA) 指数移动平均线。 SMMA 2 - (SMMA) 平滑移动平均线。 LWMA 3 - (LWMA) 线性加权移动平均线。 应用 = 0 - 应用价格。可以是任何价格常数。 0 - (CLOSE) 收盘价。 1 - (OPEN) 开盘价。 2 - (HIGH) 最高价。 3
Forex Jumper
Iurii Tokman
1 (1)
Forex Jumper   Forex Jumper   - 设计用于处理 EURJPY 货币对的智能交易系统。烛台形态分析是做出交易决策的信号。 EA 在交易时使用挂单 BUYSTOP 和 SELLSTOP。 设置: Lot = 0 - 手动设置已开订单的数量 Risk = 13 - MM 的风险百分比,适用于 Lot = 0 MagicNumber = 208 - 顾问的订单和仓位标识符,幻数 TP = 20 - 当市场上有一个单向未平仓头寸时的虚拟利润水平(以点为单位) TP2 = 20 - 当市场上有多个单向持仓时,以点为单位的虚拟利润水平 StopLoss = 500 - 以点为单位的损失水平,如果值为 0(零),则不设置该水平 count_BUY = 1 - 限制市场上同时存在的买单数量,0 时不下单 count_SELL = 1 - 限制市场中同时存在的卖单数量,0 时不下单 滑点 = 3 - 滑点水平,以点为单位 优化顾问外部设置的建议: Start Step Stop TP 1 1 300 TP2 1 1 300 StopLoss 10 2 1000 coun
Bands Jazz
Iurii Tokman
Bands Jazz   Bands Jazz   - EA 交易基于对 布林带 指标信号的分析。 Expert Advisor 的算法很简单,它使用 SL、TP 和未平仓头寸的拖网。 设置说明 TimeBeginHour   - 数字,设置交易开始时间的小时。值从 0 - 24。 TimeBeginMinute   - 数字,设置交易开始时间的分钟数。值从 0 - 60。 TimeEndHour   - 数字,设置交易结束的小时。值从 0 - 24。 TimeEndMinute   - 数字,设置交易结束时间的分钟数。值从 0 - 60。 period   - 计算布林带指标的平均周期。 偏差 - 布林带指标主线的标准偏差数。 band_shift   - 指标相对于布林带指标价格图表的移动。 Applied_price   - 布林带指标的应用价格。 shift   - 从指标缓冲区接收的值的索引(相对于当前柱向回移动指定的周期数),用于布林带指标。 SL   - 损失水平限制,以点为单位 TP   - 预期利润水平,以点为单位 MN   - 订购幻数。用作用户定义的标识符。
Eureka Lock
Iurii Tokman
Eureka Lock   Eureka Lock   - EA 确定相对于指定设置的价格变动的平坦区域。交易是通过从指定平面的边界挂单 BUY STOP 和 SELL STOP 进行的。使用增加的交易量锁定亏损头寸,而不是限制损失。还使用了虚拟利润水平。 设置说明: TF_flet = 15 - 将确定平台的图表周期 Bars_flet = 25 - 确定平盘的柱数 extern int Size_flet = 30 - 限制平面(高度)上下边界之间的距离,以磅为单位 otstyp = 5 - 用于放置挂单的平面边界的偏移量 手数 = 0.1 - 订单量 koef_lot = 2 - 锁定订单的乘数 TakeProfit = 100 - 为设置的手数设置计算虚拟利润水平,以点为单位 MagicNumber = 1975 - 订单的幻数 NumberOfTry = 5 - 经纪人重新报价的交易尝试次数 滑点 = 3 - 滑点水平,以点为单位
Orders Info
Iurii Tokman
Orders Info   该指标在一个图表窗口中显示摘要、一般信息。方便同时交易多个货币对。 该指标指示市场头寸和挂单总数。 单独表示未平仓头寸: 对于货币对, 对于该货币对的未平仓购买数量及其在存款货币中的总利润, 关于公开销售的数量及其总利润, 未平仓买入和卖出头寸的总利润。 对于挂单,表示: 对于货币对,挂单的名称及其编号。   该指标在一个图表窗口中显示摘要、一般信息。方便同时交易多个货币对。 该指标指示市场头寸和挂单总数。 单独表示未平仓头寸: 对于货币对, 对于该货币对的未平仓购买数量及其在存款货币中的总利润, 关于公开销售的数量及其总利润, 未平仓买入和卖出头寸的总利润。 对于挂单,表示: 对于货币对,挂单的名称及其编号。
Cardiogram Market   设置说明: MA_period_fast   - 用于计算快速移动平均线的平均周期。 MA_period_slow   - 计算慢速移动平均线的平均周期。 price   - 要使用的价格。可以是任何价格常数。 0 - (CLOSE) 收盘价。 1 - (OPEN) 开盘价。 2 - (HIGH) 高价。 3 -(低)最低价格。 4 - (MEDIAN) 平均价格,(高 + 低)/ 2。 5 -(典型)典型价格,(最高价 + 最低价 + 收盘价)/ 3。 6 - (加权)加权收盘价,(最高价 + 最低价 + 收盘价 + 收盘价)/ 4。 方法 - 平均方法。可以是任何移动平均法值。 0 - (SMA) 简单移动平均线。 1 - (EMA) 指数移动平均线。 SMMA 2 - (SMMA) 平滑移动平均线。 LWMA 3 - (LWMA) 线性加权移动平均线。
Piramida Grid
Iurii Tokman
Piramida Grid   Piramida Grid - 进入市场,顾问分析 斜率方向线 指标的读数。当市场反转时改变订单网格。处理挂单 BUYSTOP 和 SELLSTOP。使用损失平均系统来控制未平仓交易的余额及其无损失的输出。自动检测 6 位和 5 位数字。 顾问设置: 周期 = 32; - 斜坡方向线指示器的周期 过滤器编号 = 2; - 设置坡度方向线指示器的过滤器 ma_method = 3; - 平滑斜率方向线指标读数的方法 应用价格 = 0; - 用于计算斜率方向线指标的价格 TF = 15; - 斜率方向线指标的图表周期 止损 = 0; - 限制点数的损失水平 Order_Step = 20; - 以点为单位的网格订单之间的距离 Count_Order = 5; - 网格中的订单数量 Lock_Pips = 22; - 以点为单位打开平均订单的距离 克夫 = 2; - 乘以大量平均订单的系数 利润 = 10; - 以点为单位的利润水平 手数 = 0.1; - 起始手数 MN = 100; - 顾问订单的幻数 UseSound = True; - 启用或禁用顾
Martin Pristine
Iurii Tokman
5 (1)
Martin Pristine   Martin Pristine 是一个交易机器人,一个使用 价格通道中心 指标读数的分析作为做出交易决策的信号的顾问。不需要在图表上额外安装指标,指标内置于“EA 交易”内部。 每次亏损交易后,交易量乘以 2。 EA 自动检测货币对报价中的 5 位和 6 位数字。 一次只能在市场上持有一个头寸。 顾问设置说明: TF = 15;   - 为价格通道中心指标 选择图表周期 Bars_Count = 100;   - 价格通道中心指标 的分析柱数 止损 = 50; - 限制点数损失 止盈 = 50; - 以点数限制利润 手数 = 0.1; - 顾问订单的起始量 MN = 2808; - 顾问订单的幻数 UseSound = True; - 在顾问中启用或禁用事件的声音伴奏 市场观察 = 真; - 通过修改方法设置损益水平 滑点 = 30; - 最大允许价格滑点
Future Price
Iurii Tokman
Future Price   未来价格 - 该指标根据报价历史中的匹配搜索显示未来价格变动的预期选项。该指标以两种模式运行,第一种 - 枚举和显示指定数量的选项,第二种 - 指标显示一组选项。 设置说明 静态变量 = 0; - 设置要显示的所需选项,如果= 0,则选项的迭代有效 TOTAL_VARIANTS = 20; - 设置一组选项的数量,建议不要超过30 Time_Seconds_Show = 3; - 给定集合中一个选项的最小显示时间,最大时间受下一个报价到达时间的限制 Future_Bars = 50; - 未来显示的柱数,建议不超过60 History_Bars = 636; - 历史中分析柱的数量   未来价格 - 该指标根据报价历史中的匹配搜索显示未来价格变动的预期选项。该指标以两种模式运行,第一种 - 枚举和显示指定数量的选项,第二种 - 指标显示一组选项。
Reanimator
Iurii Tokman
Reanimator   半自动交易机器人。要打开/关闭头寸,请使用按钮。根据虚拟利润水平自动进行头寸的进一步跟踪。还使用了一种用减少/增加的手数来平均无利可图的头寸的系统。策略测试器中顾问的按钮控制不起作用;顾问只能在演示或真实账户上进行全面测试。在策略测试器中,可以使用特殊设置 OPEN_BUY 和 OPEN_SELL 来测试顾问程序。 设置 colorBUY - 购买方向的线条颜色 colorSELL - 销售方向的线条颜色 _width - 线宽 MagicNumber - 顾问订单的标识符。机器人只会处理只有这样一个数字的订单。 LOT - 固定手数。在 0 MM 工作(资金管理) Choice_method - MM 方法。 true - AccountBalance, false - AccountFreeMargin 风险 - MM 的利率风险。仅适用于 LOT = 0 drawdown_pip - 以增加/减少手数开仓的点数距离 koef_martingale - 许多平均位置的乘法因子 利润点 - 以点为单位的虚拟利润水平,相对于起始手数计算 Show_Sco
FletBoxPush
Iurii Tokman
FletBoxPush   该指标根据指定的参数确定价格变动的平坦区域。 设置: TimeFrames - 图表周期的选择。 FlatPips - 确定平面的点数限制 FlatBars - 用于确定平面的柱线数量限制 CountBars - 用于分析价格变动的历史柱数,在 0 时分析历史中的所有柱 颜色 - 定义为平面的价格段的颜色 PriceTag - 价格标签的附加绘图 警报 - 显示包含用户数据的对话框 文本 - 警报的自定义文本 Send_Mail - 向“邮件”选项卡上的设置窗口中指定的地址发送电子邮件 主题 - 电子邮件标题 Send_Notification - 向移动终端发送通知,其 MetaQuotes ID 在“通知”选项卡的设置窗口中指定。 该指标根据指定的参数确定价格变动的平坦区域。
BarKhan
Iurii Tokman
BarKhan   BarKhan - 该指标计算为三个数字移动平均线的差值之和。计算公式如下:数字移动平均线#1和#2的差值与数字移动平均线#2和#3的差值相加 指标设置说明: MA_Period1 - 第一个数字移动平均线的周期 MA_Period2 - 第二个数字移动平均线的周期 MA_Period3 - 第三个数字移动平均线的周期   BarKhan - 该指标计算为三个数字移动平均线的差值之和。计算公式如下:数字移动平均线#1和#2的差值与数字移动平均线#2和#3的差值相加 指标设置说明: MA_Period1 - 第一个数字移动平均线的周期 MA_Period2 - 第二个数字移动平均线的周期 MA_Period3 - 第三个数字移动平均线的周期
Octet
Iurii Tokman
Octet   该指标是多货币的,它同时分析 56 种货币对。重要的是,所有货币对都在市场概览中并为其加载报价。 该指标以一条线的形式显示某种货币相对于其他7种货币的涨跌。指标值以百分比表示。 指标设置说明 Type_Calculation - 计算货币增长或下跌百分比的三个选项 前缀 - 当货币对的名称中有前缀时使用,例如:EURUSD.fxp,则设置 Prefix = .fxp Show_AUD - 显示澳元货币相对于其他 7 种货币的总计算值 Show_EUR - 显示欧元货币相对于其他 7 种货币的总计算值 Show_GBP - 显示英镑货币相对于其他 7 种货币的总计算值 Show_NZD - 显示新西兰元货币相对于其他 7 种货币的总计算值 Show_CAD - 显示 CAD 货币相对于其他 7 种货币的总计算值 Show_CHF - 显示 CHF 货币相对于其他 7 种货币的总计算值 Show_JPY - 显示日元货币相对于其他 7 种货币的总计算值 Show_USD - 显示美元货币相对于其他 7 种货币的总计算值 Show_NAME - 显示指标线的货币名称 ca
Strong Weak
Iurii Tokman
Strong Weak   多货币指标同时分析 56 个货币对: AUD EUR GBP NZD CAD CHF JPY USD AUD SUMM EURAUD GBPAUD AUDNZD AUDCAD AUDCHF AUDJPY AUDUSD EUR EURAUD SUMM EURGBP EURNZD EURCAD EURCHF EURJPY EURUSD GBP GBPAUD EURGBP SUMM GBPNZD GBPCAD GBPCHF GBPJPY GBPUSD NZD AUDNZD EURNZD GBPNZD SUMM NZDCAD NZDCHF NZDJPY NZDUSD CAD AUDCAD EURCAD GBPCAD NZDCAD SUMM CADCHF CADJPY USDCAD CHF AUDCHF EURCHF GBPCHF NZDCHF CADCHF SUMM CHFJPY USDCHF JPY AUDJPY EURJPY GBPJPY NZDJPY CADJPY CHFJPY SUMM USDJPY USD AUDUSD EURUSD GBPUSD
Grid Flat
Iurii Tokman
Grid Flat   EA 以指定的步骤放置一个订单网格。对于所有相同类型的订单,订单具有网格步距的利润水平和一般亏损水平。交易仅在设置中指定的时间段内进行,在时间结束时删除所有挂单并强制关闭所有未平仓头寸。不建议将 EA 用作长期交易的全自动交易系统,仅用于在某些市场情况下工作,例如发布重要新闻或其他类似市场情况。 顾问设置说明 Open_BuyStop - 打开/不打开待处理的 Buy Stop 订单网格 Open_SellStop - 打开/不打开挂单的卖出止损订单网格 Open_BuyLimit - 打开/不打开待定买入限价订单网格 Open_SellLimit - 打开/不打开挂单的卖出限价订单网格 TIME_HOUR_START - 顾问开始工作的小时数,值从 0 到 23 TIME_MINUTE_START - 顾问开始工作的分钟数,值从 0 到 59 TIME_HOUR_STOP - EA 交易结束的小时数,值从 0 到 23 TIME_MINUTE_STOP - 顾问结束的分钟数,值从 0 到 59 Grid_levels - 网格中的级别数 Step_Grid
筛选:
无评论
回复评论