• 概述
  • 评论 (9)
  • 评论 (70)
  • 新特性

Volume Strength 28

3.75

Version 1.6 !

Volume Strength 28 is better , easier to use and more awesome ! Based on complaint we got from the reviews, we understood many don't know how to really use the time frame setting on the input menu thus they have complaints of volatility, thus we have designed an Automatic Time Frame selection system that is suitable for novice traders.! The design of the indicator has been changed along with some calculation metrics. Based on complaints of high volatility we have been getting ,we have designed this version around a stable market system with the ability to spot early trends and exit trends early. In addition to the trend line display, there is an easy view histogram display that is selectable so you can choose the display you want!

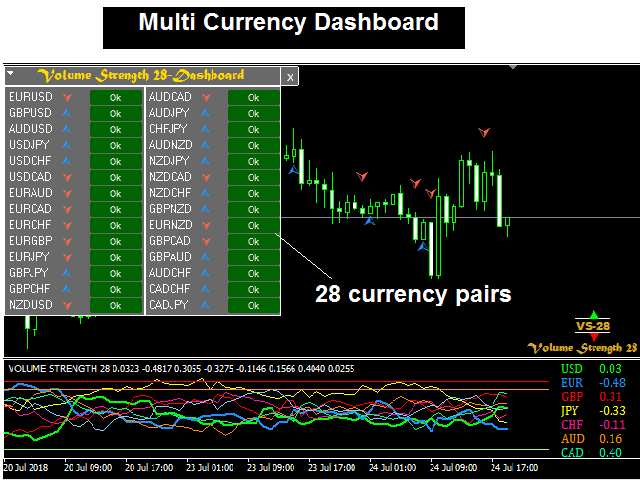
Volume always precedes price. Supply and Demand in forex is best defined by trade volumes and trends are formed by supply and demand. Thus if you want to see the move before it happens, take your eyes from the price and look at the volume. Volume Strength 28 is a currency meter that is different from any you’ve come across. Typical currency meters found in the forex markets/community uses price as bases of their analysis however this currency meter uses volume as the bases of its analysis.

Volume strength 28 analyses the trade volume of 28 currency pairs and defines the strength of a currency based on volume. With this logic you can easily spot both micro and macro moves in a currency pair even before they happen.


Applications

There are many applications of the Volume Strength 28 but we are just going to highlight a few we have been able to define with success. I encourage every user of this product not just to focus on these few applications but to study and discover it more because we are still yet to exhaust its applications.

  • Spot strong / weak currencies.
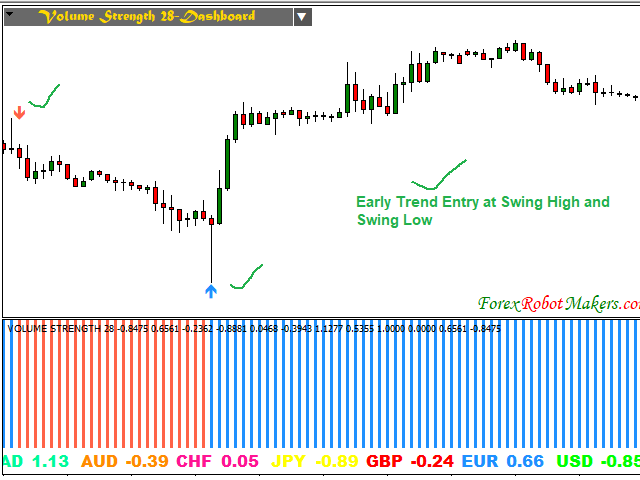
  • Spot trends at its earliest stage.
  • Know the stage of trend and the best time to enter trades.
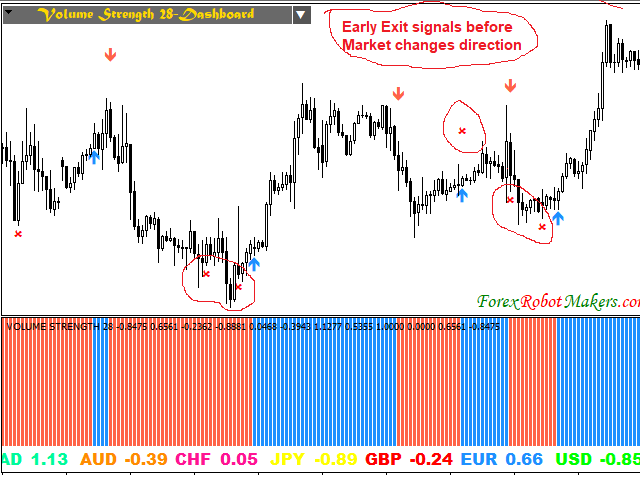
  • Spot the end of a trend.
  • Spot reversals at its early stage.
  • Spot pull backs at its earliest stage.


Features

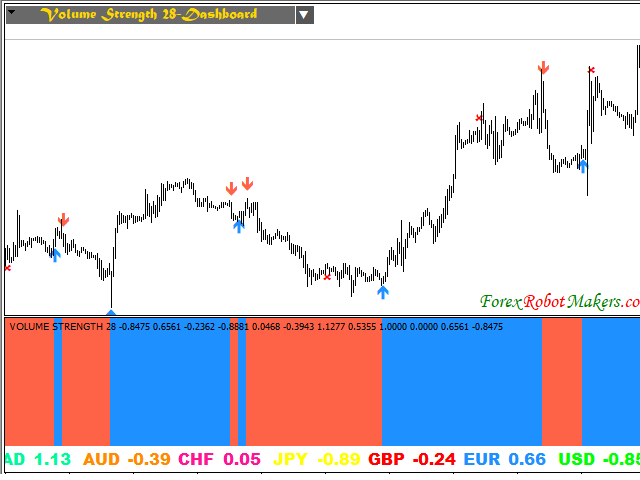
  • Trend Arrows: Has pair cross arrows to show trend change on charts
  • Trend Exit Arrows: Has trend exit arrows to identify the end of a trend and possible reversals/pull backs
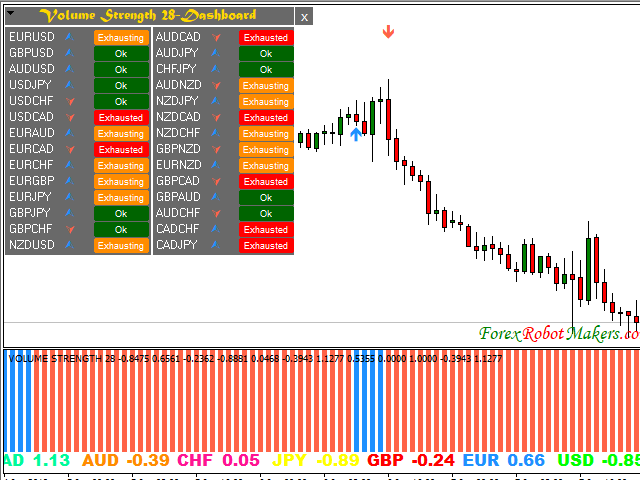
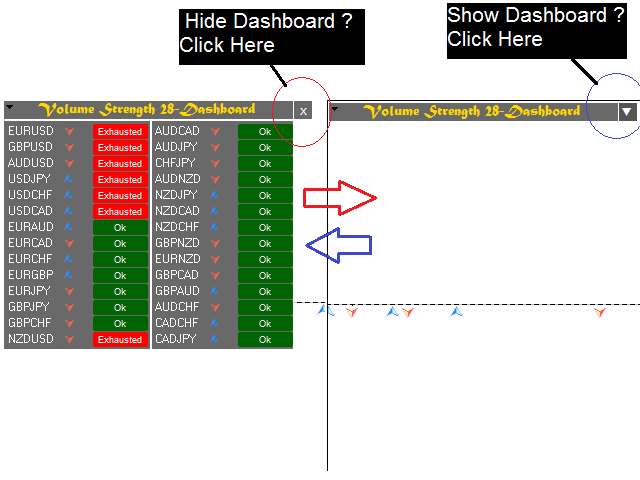
  • Multi-Currency Dashboard: It has multi-currency dashboard for display of trend direction and trend stage for 28 currency pairs.
  • Notification/ Alert: The indicator has pop up notification, email notification and push notification for trend change and trade zones.


How to Use

Make sure all data are loaded to get correct strength values. Incomplete data will be displayed on the screen. Incomplete might return wrong strength values thus they should be updated.


Time Frame: Can be used on any Time Frame , Best result H1 Time frame

Data Error: To get the correct volume strength values, it is compulsory that all 28 currency pair data must up to date.


Input menu

  • History: Historical Plotting Bars
  • Time Frame: Indicator Time Frame
  • Symbol Prefix: Prefix Settings for currency pairs with prefix
  • show_usd: Show USD signal and display USD pairs
  • show_eur: Show EUR signal and display EUR pairs
  • show_gbp: Show GBP signal and display GBP pairs
  • show_jpy: Show JPY signal and display JPY pairs
  • show_chf: Show CHF signal and display CHF pairs
  • show_cad: Show CAD signal and display CAD pairs
  • show_aud: Show AUD signal and display AUD pairs
  • show_nzd: Show NZD signal and display NZD pairs
  • Trend_Alert: Send Pair cross signal
  • Yellow_Zone_Alert: Send yellow zone Alert
  • Red_Zone_Alert: Send Red Zone Alert
  • Trend_Exit_Alert: Send Trend Exit Alert
  • Enable PopUp Alert: Enable Pop Up Notification
  • Enable Email: Enable Email Notification
  • Enable Push: Enable Push Notification
  • Display Multicurrency Dashboard: Multi Currency Dashboard Display
  • Show Trend Arrows: Enable/Disable Trend arrow display
  • Show Exit Arrows: Enable / Disable Exit arrow display.
  • Buy arrowColor: Arrow Color Settings
  • Sell arrowColor: Arrow Color Settings
  • Arrow Width: Arrow Width Settings


Note

  • Pair cross arrows and trend exit arrows might repaint on the current bar/candle as currency strength values changes
评论 9
danmar
1344
danmar 2023.02.21 08:51 
 

Hi the product is good but i wait a certain time to have a certain time for update

and it is why my first rate was 1 star but now it is done

and for me it is a great help in my daily use

Please put on your do list 2 things :

1) currency dashboard in main window left up , could you make it sorted by currency

2) the currency dashboard in sub window at the right of the lines :

please could you :

a) add a parameter space to be able to see it better

b) add a parameter to specify the number of sub windows

otherwise it could go not in the same windows of the indicator

c) sort the currency from weak to strong

any case the one very important you make it = Thank you a lot

Warmly

jmhuang
3107
jmhuang 2021.06.26 05:40 
 

a good CSM - would appreciate if the programmer could remove the logo from the window screen. Logos should be confined to pdf instruction and the default setting of the indicator. The programmer is responsive and provides good service. Would be good if there is a column ShowAuto so that the indicator can just show the lines of the two pairs instead of all pairs

katototo
614
katototo 2019.11.07 06:31 
 

Have been trying this for months side by side with all sorts Currency meters and I must say it gives better signals and on the automatic time frame selection it cuts out

a lot of the noise and gives very good buy and sell signals.

If it does not confirm your systems signal maybe you should not take it.

推荐产品
Market Profile
Artem Titarenko
5 (1)
The "Market Profile" indicator displays the profiles and volumes of periods – weekly, daily, session (8-hour), 4-hour, hour, summary. The VAH/VAL price area is automatically highlighted by a dotted line for each profile (except for the summary). The indicator includes chroma Delta, which colors the profile areas. The areas of prevailing Buys is colored in green, that of Sells - in red. The intensity histogram features blue/red respectively. In the filter mode, the indicator displays the volume a
Super volumes
Yerzhan Satov
4 (1)
外汇和二元期权的箭头指示器是基于蜱数量. 与许多交易量指标不同,"超级交易量"指标计算看涨和看跌交易量,并根据其中任何一个交易量的优势给出信号。 如果,比如说,目前在这个范围内有看涨的优势,那么信号将是买入。 或者,如果占主导地位的是看跌量,那么,相应地,信号将是卖出。 在"成交量"变量的指标设置中,您可以增加或减少信号的频率。 值越高,信号越少。 默认情况下,剩下"2"。 在"HistoryBars"变量中,您可以增加历史记录上的信号数量。 默认情况下留下500。 不建议留下超过这个数字。 因为更大的数字将加载终端。 那么,在设置的最后一部分中,您可以选择更改箭头与蜡烛的距离,箭头的厚度,代码和颜色。 信号和箭头根本不画!!! 即使在改变时间框架之后。 严格建议在固定图表上的箭头后使用指标信号进行交易。 信号蜡烛关闭后,它们被彻底固定.
Note : The slow loading of the indicator issue has been addressed . This new version loads fast and does not slow the platform. Version 1.3 : We have updated the indicator to include an historical bar scanning option . So instead of scanning all bars in the history (which can make the indicator slow sometimes ) , you can select the maximum number of bars it can scan which can increase the performance and make the indicator faster. This indicator scans the 1-3 Trendline pattern . The indic
Implement
Vitalii Zakharuk
5 (1)
Implement analyzes market dynamics for pivot points. If you want to learn how to spot the correct reversals for consistently likely profitable trading, buy this indicator. Shows favorable moments of entering the market in stripes. Ready-made trading system. The principle of operation of the indicator is to automatically determine the current state of the market when placed on a chart, analyze historical data based on historical data and display instructions for further actions on the trader's
Th3 BarPlay Signals Mt4
Nnamdi Kennedy Ifeorah
这是一种基于价格行为的策略,称为 3Bar_Play,它基于 3Bar 烛台形态。在弹出买入/卖出信号箭头之前,添加了额外的指标用于过滤和确认。它可以在上升趋势、下降趋势或横向市场中交易。 添加的指标包括: 随机 - 动量 Fisher - 趋势 ATR - 波动率也明确定义了信号箭头底部的止损位置(使用 ATR 止损方法)。 具有良好风险管理的风险回报比可以从 1:1 到 1:4 不等。 买入 - 当买入信号在 2 个看跌柱和 1 个看涨柱后弹出时。 卖出 - 当卖出信号在 2 个看涨柱和 1 个看跌柱后弹出时。 附加功能 用于在图表上打开/关闭信号但不发出警报的切换按钮。 设置面板上的可调参数(下载时的首选设置)。 启用电子邮件/推送通知,在您离开屏幕时提醒您注意信号。 一个非常简单易用的指标,适用于所有市场。灌输纪律并帮助交易者专注于流程。 适合在止损和获利安置中苦苦挣扎的新手/交易者。专业交易员也不例外。 24 小时支持。 注意事项 如果指标未能出现在您的图表屏幕上,您需要联系我并安装自定义鱼指标。
Middle Volume
Stefan Stoyanov
3.5 (2)
The indicator measures volumes on different charts and instruments. Its main advantage is the ability to compare separate brokers. The less Middle Volume and Tick / Second , the more reliable is the broker. There is a comment in the upper left corner Comment data: Tick/Second — number of ticks per second for a selected instrument Middle Volume — average volumes in the penultimate bar This indicator allows tracking a relative market activity for different timeframes. If the volumes are lower than
FREE
MT4 外汇指标“HTF 包络线” 使用适用于 MT4 的专业 HTF Envelopes 升级您的交易方法。 HTF 意味着 - 更高的时间范围 包络线是市场上最好的趋势指标之一 - 完美的交易工具 它用于帮助交易者识别极端超买和超卖情况以及交易范围。 HTF 包络线指标非常适合具有价格行为条目或与其他指标结合的多时间框架交易系统。 指标允许您将较高时间范围的包络线附加到当前图表。 ............................................................................................................. // 这里提供更多优秀的 EA 交易和指标: https://www.mql5.com/en/users/def1380/seller // 也欢迎您加入盈利、稳定、可靠的信号 https://www.mql5.com/en/signals/1887493
Rira VWAP Bands
Vitor Palmeira Abbehusen
VWAP Bands gives you the regular Volume-Weighted Average Price and also the deviation bands. Use this indicator to see the possible amount of market movement, find support and resistance lines, find good spots for entry and exit,  and the most important feature is to find possible pivot points. This indicator has been mathematically improved by Rira team. The calculation begins at the start of each trading day
Zig Zag reading structure
Maria Cristina Sabatini
'Zig Zag Percentage strenght'   This indicator is awesome. Why? It's able to show the percentage of the last leg, compared with the previous leg. In this way you have a better understanding of the forces in play in that moment.   In fact, for example, if you see that the up extensions are, in percentage, greater of the down legs, that means that there is more bullish pressure or maybe the market is starting to reverse from downtrend to uptrend.   Hope you will ind it useful !
Trend Suffer
Philip Effiong Philip
Alerts you on new trends, with ENTRY and EXIT points. INSTRUCTIONS  Select asset of choice, activate the indicator on the chart and just follow the signals from the arrows. ITS FREE, GIVE ME A GOOD RATING! Platform : Metatrader4 Asset : All Currencies, Gold, BTCUSD, NASDAQ PS : F or newbie and pro traders. Used by more 3,000 traders around the world. Send  a mail for further help and information...........
The  RSI Basket Currency Strenght  brings the RSI indicator to a new level.  Expanding the boundaries of TimeFrames and mono-currency analysis, the RSI Multi Time Frame Currency Strenght take the movements of each currency that composes the cross and confront them in the whole basket of 7 crosses.  The indicator works with any combination of  AUD, CAD, CHF, EUR, GBP, JPY, NZD, USD  pairs and with full automation takes in account every RSI value for the selected Time Frame.  After that, the indic
FREE
TrendRange
Olalekan Gisanrin
TrendRange   Indicator works on M1, M5, M15, M30, H1 and H4 timeframes. It indicates real market trend, support and resistance levels. In other words, it confirms trade directions. Scalpers especially,   Intraday, swing, intermediate and  long term traders will especially find this indicator useful. It uses customized show/hide buttons namely: "DRAW", "HILO", and "LEVEL" lines crossings and histograms ("AWOS" for Awesome Oscillator, "BUBE" for Bull Power and Bear Power & "GATO" for Gator Oscilla
What does this do? It shows you on the chart which stop belongs to which entry.  Have you ever had multiple positions or trades open on a single pair and were confused which stop loss goes with what entry? Even worse, the stop loss orders for buy and sells are the same color on the chart. Well, your problem has been solved! This indicator will show you which stop belongs to which entry.  It will place a vertical line and an arrow on the chart for each open trade. A yellow line connects the entry
Contact me for instruction, any questions! Introduction A flag can be used as an entry pattern for the continuation of an established trend. The formation usually occurs after a strong trending move. The pattern usually forms at the midpoint of a full swing and shows the start of moving. Bullish flags can form after an uptrend, bearish flags can form after a downtrend. Flag Pattern Scanner Indicator It is usually difficult for a trader to recognize classic patterns on a chart, as well as sear
NIGHTCrusher Lite FREE
Christian Opperskalski
4.5 (2)
NIGHTCRUSHER is a fully automated expert advisor, designed for scalping on quite market situation. The Lite - Version is limited to minimal Lot per Pair and dont has lot mulitplier and dynamic function you can also run different strategies like swing trading or grid different Trade Entry Signals different Exit Strategies included (MA Cut / Signal Change / Trailing TP) clever Risk & Money management - Balance based - Longrun trades tracking You can also use a Grid function or Lot multipier, if n
FREE
Delta AG
Yurij Kozhevnikov
The difference between the arithmetic and geometric means at the specified range. Since the greater is the difference between the values, the greater the resulting figure is, actually the indicator shows volatility fluctuations. The arithmetic mean of a certain number of values ​​is the sum of the values ​​divided by their number. The geometric mean is the root of the power of the number of values ​​extracted from the product of these values. If all values ​​are equal, the arithmetic mean and th
VWAPIndicator
Ahmet Metin Yilmaz
Volume-weighted average price In finance, volume-weighted average price (VWAP) is the ratio of the value traded to total volume traded over a particular time horizon (usually one day). It is a measure of the average price at which a stock is traded over the trading horizon. VWAP is calculated using the following formula: *It is shown second screenshot in the screenshots. trade that takes place over the defined period of time, excluding cross trades and basket cross trades. for more informatio
BoxProfile MT4
Evgeny Shevtsov
4.8 (15)
The indicator displays volume profiles based on the nesting principle. Profiles periods are pre-set so that each subsequent profile has a length twice as long as the length of the previous profile. In addition to profiles, the indicator displays volume clusters sorted by color, depending on the volume they contain. Indicator operation features The indicator works on typical timeframes from M5 to MN, but for calculations uses historical data from smaller timeframes: M1 - for timeframes from M5
FREE
BreakevenMarginCallPanel
Andrian Armand Gannery
This is indicator for checking your trades. Please see the pictures attachment, the indicator show info about: - Breakeven Level; - Margin Call Level; - Two volume info, past and current (With color exchange base on the past volume); - Spreads; - Swap Long and Swap Short (With color change, positive and negative swap); - Running Price; -Today High Low Pips; - Today Open to Current Running Price pips. This indicator not for trading entry, only to assist your trade management Regards
Ultimate Dynamic Levels
Hispraise Chinedum Abraham
4.73 (11)
目前正在进行节日折扣,价格为399美元! 未来价格可能会上涨。请阅读下面的描述!   介绍 Ultimate Dynamic Levels - Ultimate Sniper Dashboard的最佳入场指标! 极低风险的及时进场和高RR!! 在这里找到终极狙击手仪表板。 对于初学者和职业交易者来说,最重要的能力是准确判断市场最可能转向的位置和时间,以及如何安全进入并获利退出。 终极动态水平指标很容易告诉你市场转折的最高可能性在哪里,这样你就可以自信地进入一个极低风险的交易,同时保持你的图表干净和简单,同时赚取美元! 终极动态水平指标有一个独特而强大的算法,可以同时在多个时间框架上找到重要的隐藏水平。它实在是太神奇了,而且永远不会像其他典型的SR指标那样重绘或重新绘制水平线!  终极动态水平指标还在图表的右侧有一个水平强度简介,以显示该水平在最近的历史上是否强劲。一个强大的奖励组合!!!。 终极动态水平指标有3个非常重要的功能。 1. 帮助你进入趋势方向的低风险交易。 2. 2.使你保持在趋势中,只要移动仍在进行。 3. 3.作为追踪止损,保护你的收益,避免把钱留
Indicator is used for: defining price probability distributions. This allows for a detailed representation of the channel and its borders and forecast the probability of a price appearing at each segment of its fluctuations; defining the channel change moment.   Operation principles and features Indicator analyzes a quote history on lower timeframes and calculates a price probability distribution on higher ones. Forecast algorithms allow the indicator to calculate probability distributions and m
Contraction And Expansion FVG 4
Usiola Oluwadamilol Olagundoye
The Contraction/Expansion Breakout Indicator for MetaTrader 4 (MT4) is a powerful tool crafted to identify and signal the breakout of bullish and bearish contraction or expansion formations within financial markets. Utilizing advanced algorithmic calculations, this indicator assists traders in recognizing significant price movements that frequently accompany these formations, providing valuable insights for strategic trading decisions. Key Features: Contraction and Expansion Identification: The
FREE
Contraction And Expansion 4
Usiola Oluwadamilol Olagundoye
The Contraction/Expansion Breakout Indicator for MetaTrader 4 (MT4) is a powerful tool crafted to identify and signal the breakout of bullish and bearish contraction or expansion formations within financial markets. Utilizing advanced algorithmic calculations, this indicator assists traders in recognizing significant price movements that frequently accompany these formations, providing valuable insights for strategic trading decisions. Key Features: Contraction and Expansion Identification: The
FREE
FBO Impact
Abayomi Bello
FBO Impact  is a professional yet simple to use trend following system. It detects the prevailing trend and gives entry points after pullbacks to significant price levels. To determine the trend it uses a unique filtering algorithm. Suitable for defining entry points for scalping as well as for intra-day trading. Features Works with the prevailing market trend. Suitable for all currency pairs. Ideal for all time frames but higher time frames are recommended. Does not redraw/repaint the arrows on
Dynamic SR Trend Channel Dynamic SR Trend Channel is a simple indicator for trend detection as well as resistance/support levels on the current timeframe. It shows you areas where to expect possible change in trend direction and trend continuation. It works with any trading system (both price action and other trading system that use indicators) and is also very good for renko charting system as well. In an uptrend, the red line (main line) serves as the support and the blue line serves as the
Max Volume
Maksim Slovakov
Подкрашивает аномально большие тиковые объёмы в красный цвет. Имеет следующие настройки: "Процент" по умолчанию "70"  (Процент на который аномальный объём должен быть больше предыдущего) "Уровень" по умолчанию "500" (Количество тиков, больше которого будем брать во внимание аномальный объём) Внимание! Данный индикатор был разработан для мелких таймфреймов M1,M5,M15. Идея в том, что на таких Таймфреймах увеличение количества тиков говорит об увеличении количество сделок, увеличения интереса к цен
This indicator will give you entries as result of scalping strategy that will be applied on 14 symbols in same time and you are able to be notified with this entries  Note :   This indicator for scalping on 5 minutes timeframe only . How to use it : 1-Open chart and adjust settings (edit symbols names as your platform names , activate the alert system if you need it . 2-Wait for any signal you have it from this scanner you will have it as alert and as notification and you will see it on bo
Qv2 OBOS
Joao Marcilio
Qv² OBOS is an indicator that aims to identify overbought and oversold regions considering price standard deviation and volume analysis. Oversold signals are indicated by arrows pointing upwards. Overbought signals are indicated by arrows pointing downwards. Can be used in all timeframes. Can be used on all pairs. I use in H1 Important note, the histogram is displayed to improve the trader's analysis. But the signs of overbought and oversold are the arrows as mentioned above. Important no
GJPivots
David Jumbo
4 (1)
1.每月,每周和每日枢轴计算每个时期的开始和结束数据。 这在图表上提供了一条简单的线,用于识别枢轴的位置并减少计算误差。 3.即使您不了解如何计算枢轴,该指示器也将帮助非常快速地定义仪器的主要枢轴。 4.您还可以比较每周和每日的支点,以便您更好地了解价格的位置。 5该指标将帮助您更有效地交易,更接近阻力或支撑。 1. Měi yuè, měi zhōu hé měi rì shū zhóu jìsuàn měi gè shíqí de kāishǐ hé jiéshù shùjù. Zhè zài túbiǎo shàng tígōngle yītiáo jiǎndān de xiàn, yòng yú shìbié shū zhóu de wèizhì bìng jiǎnshǎo jìsuàn wùchā. 3. Jíshǐ nín bù liǎojiě rúhé jìsuàn shū zhóu, gāi zhǐshì qì yě jiāng bāngzhù fēicháng kuàisù de dìngyì yíqì de zhǔyào shū zhóu
FREE
Reversal Trend
Claus Dietrich
Arrows appear after Reversal-Pattern and when the confirmation-candle reaches its value, it won't disappear (no repaint). but with fix settings no additional settings necessary Entry : immediately after arrow Stop loss : a few pips above the high of the arrow - candle / below the low of the arrow - candle Take Profit : at least the next candle / move to break even after candle closed / trail the SL works on : Major Forex-pairs / M15 and higher time-frames The Value of the  confirmation-candle =>
该产品的买家也购买
Atomic Analyst
Issam Kassas
5 (1)
首先值得强调的是,该交易指标是非重绘、非延迟的指标,这使其成为手动和机器人交易的理想选择。 Atomic Analyst是一种PA价格行动指标,利用价格的力量和动量来寻找市场上更好的机会。配备了高级过滤器,可帮助去除噪音和假信号,并提高交易潜力。使用多层复杂的指标,Atomic Analyst扫描图表,并将复杂的数学计算转化为任何初学者都能理解并用来做出一致交易决策的简单信号和颜色。 “Atomic Analyst”是专为新手和经验丰富的交易者量身定制的综合交易解决方案。它将高级指标和一流功能融合为一体的交易策略,使其成为所有类型交易者的多功能选择。 日内交易和剥头皮策略:专为快速准确的日内交易和短期交易而设计。 日内和摆动交易策略:可用作追求价格大幅波动的日内和摆动交易者的可靠工具。 多货币和市场:凭借其可靠的精度,在不同的工具和市场上运作。 多个时间框架:可在多个时间框架上使用,性能良好。 稳定性:所有指标均不重绘、不重绘和不滞后,确保可靠的信号。 信号清晰度:提供箭头信号,用于清晰的入场和出场点。 实时警报:通过交易入场、SL和TP警报通知交易者。 多个利润水平:使用
TPSproTREND PrO
Roman Podpora
5 (15)
TPSpro TRENDPRO  - is a trend indicator that automatically analyzes the market and provides information about the trend and each of its changes, as well as giving signals for entering trades without redrawing! The indicator uses each candle, analyzing them separately. referring to different impulses - up or down impulse. Exact entry points into transactions for currencies, crypto, metals, stocks, indices!  -  Version MT5               DETAILED DESCRIPTION        /       TRADING SETUPS           
Quantum Trend Sniper Indicator MT4
Bogdan Ion Puscasu
4.59 (39)
介绍   量子趋势狙击指标 ,突破性的 MQL5 指标,正在改变您识别和交易趋势反转的方式!由拥有超过13年交易经验的资深交易员团队开发,     量子趋势狙击指标   旨在通过其创新的方式以极高的准确度识别趋势反转,将您的交易之旅推向新的高度。 ***购买量子趋势狙击指标,即可免费获得量子突破指标!*** 当量子突破指标识别出趋势反转时,它会向您发出警报和信号箭头,并建议您三个止盈水平。 它既适合新手交易者,也适合专业交易者。 量子 EA 通道:       点击这里 MT5版本:       点击这里 建议: 时间范围:  所有时间范围。为了获得最佳结果,我们建议在 M15、M30 和 H1 时间范围内使用它。 货币对:欧元兑美元、英镑兑美元、澳元兑美元、欧元兑英镑, EURAUD, XAUUSD 账户类型:ECN、Raw 或 Razor,点差极低 经纪时间:任意 经纪商:IC Markets、Pepperstone with Raw 和 Razor 的点差最低 建议止损:50 点 建议止盈水平:20 点、50 点和 1
TPSpro RFI Levels
Roman Podpora
5 (13)
A key element in trading is zones or levels from which decisions to buy or sell a trading instrument are made. Despite attempts by major players to conceal their presence in the market, they inevitably leave traces. Our task was to learn how to identify these traces and interpret them correctly. Reversal First Impulse levels (RFI)   -  Version MT5                INSTRUCTIONS                 RUS                 ENG                                       R ecommended to use with an indicator   -  
Advanced Currency Strength28 Indicator
Bernhard Schweigert
4.9 (662)
目前26%的折扣 任何新手或专家交易者的最佳解决方案! 这个指标是一个独特的、高质量的、可负担得起的交易工具,因为我们纳入了一些专有的功能和一个新的公式。只需一个图表,你就可以读出28个外汇对的货币强度!想象一下,你的交易将如何得到改善,因为你的交易是在你的手中进行的。想象一下,你的交易将如何改善,因为你能够准确地确定新趋势或剥头皮机会的触发点? 用户手册:点击这里  https://www.mql5.com/en/blogs/post/697384 这是第一本,原版的! 不要买一个毫无价值的崇拜者的克隆品。 特别的 子窗口中的箭头显示强劲的货币势头GAP将指导你的交易! 当基础货币或报价货币处于超卖/超买区域(外盘斐波那契水平)时,在个人图表的主窗口中出现警告信号。 当货币力量从外围区间回落时,回撤/反转警报。 十字星模式的特别警报 可选择多个时间框架,以快速查看趋势! 货币强度线在所有的时间框架中都非常平稳,当使用较高的时间框架来识别总体趋势,然后使用较短的时间框架来确定精确的入口时,效果非常好。你可以根据自己的意愿选择任何时间框架。每个时间框架都由其自身进
目前八折优惠! 对任何新手或专家交易者来说都是最好的解决方案! 这个仪表板软件适用于28种货币对。它基于我们的两个主要指标(高级货币强度28和高级货币冲动)。它对整个外汇市场提供了一个伟大的概述。它显示高级货币强度值,货币运动速度和28个外汇对在所有(9)时间段的信号。想象一下,当你可以使用图表上的单一指标观察整个市场,以确定趋势和或剥头皮的机会时,你的交易将得到改善 我们已经在这个指标中建立了一些功能,使你更容易识别强势和弱势货币,同时识别和确认潜在的交易。该指标以图形方式显示货币的强势或弱势是增加还是减少,以及它在所有时间段的表现。 增加的新功能是动态市场斐波那契水平,它适应当前的市场条件变化,这是一个已经在我们的高级货币强度28和高级货币冲动指标中使用的成熟的加分项。 在交易时,总是将弱势货币和强势货币配对,这个新指标将帮助你做到这一点。 用户手册:点击这里  https://www.mql5.com/en/blogs/post/708783 特点  显示每个时间段的ACS28和GAP-speed(冲动)的货币强度值。 列:颜色代码以7种颜色
Advanced Supply Demand
Bernhard Schweigert
4.92 (310)
现在优惠 33%! 任何新手或专业交易者的最佳解决方案! 该指标是一款独特、高质量、且价格合理的交易工具,因为我们已经整合了许多专有功能和新公式。 依据此更新,您将能够显示双重时间帧区域。 您不仅可以显示一个较高的时间帧,还可以同时显示图表时间帧,加上更高的时间帧:显示嵌套时区。 供需双方所有交易者都会喜欢它。 :) 重要信息披露 高级供需的最大潜力,请访问 https://www.mql5.com/zh/blogs/post/720245   想象您的交易如何得以改善,是因为您能够精准定位入场或目标位吗? 构建于新的底层算法,它可以更轻松地识别出买卖双方之间的潜在失衡。 这是因为它以图形方式展示供需最强劲区域,及其过去的表现(显示旧区域)。 这些功能旨在帮助您更轻松地发现最佳入场区域和价位。 现在您可以针对您的交易品种和时间帧来优化和编辑区域强度! 高级供需指标适用于所有产品和时间帧。 它是一个新的公式,非常新的功能是两个区域强度函数可由用户输入进行调整! 这在交易中是一大优势。 当您学习如何使用专有功能,例如带有价格游离最小 X 因子的区域强度时,您能够判断该区域强劲与否。 供
TrendMaestro
Stefano Frisetti
5 (2)
note: this indicator is for METATRADER4, if you want the version for METATRADER5 this is the link: TRENDMAESTRO recognizes a new TREND in the bud, he never makes mistakes. The certainty of identifying a new TREND is priceless. DESCRIPTION TRENDMAESTRO identifies a new TREND in the bud, this indicator examines the volatility, volumes and momentum to identify the moment in which there is an explosion of one or more of these data and therefore the moment in which prices have strong probability of f
引入神奇外汇指标:释放精准交易的力量 你是否厌倦了寻找在所有时间框架上都能取得出色结果的完美外汇指标?别再继续寻找了!神奇外汇指标已经来到,改变您的交易体验,将您的利润推向新的高度。 神奇外汇指标基于尖端技术和多年的精心开发,堪称外汇市场上的强大和精确的巅峰之作。这个卓越的工具旨在满足各个层次的交易者需求,在追求持续盈利性方面提供无与伦比的优势。 神奇外汇指标的独特之处在于其无与伦比的适应性。无论您是日内交易者、波段交易者还是更喜欢长期持仓,该指标都经过优化,能在所有时间框架上取得出色的结果。然而,当在1小时时间框架上使用时,它的准确性和捕捉市场复杂走势的能力得到真正展示。 准备好对神奇外汇指标的准确性和可靠性感到惊讶。其先进的算法无缝结合了强大的指标、统计分析和趋势识别,实时为您提供全面的市场视图。指标的智能和动态信号使您能够自信地做出明智的交易决策,最大限度地提高获胜交易的机会。 不再犹豫和迷茫。神奇外汇指标消除了交易的猜测,使您在市场参与者中具有独特的优势。其用户友好的界面和直观的设计使得无论是经验丰富的专业人士还是初学者都能轻松掌握这一卓越工具的力量。 有了神奇外汇指标的支持,
FX Power MT4 NG
Daniel Stein
5 (8)
通过 mql5 和 Telegram 上 的晨间简报获取每日市场更新,包括详细信息和屏幕截图 ! FX Power MT4 NG 是我们长期以来非常受欢迎的货币强度计算器 FX Power 的下一代产品。 这款下一代强度计算器能提供什么?您所喜爱的原版 FX Power 的所有功能 附加功能 黄金/XAU 强度分析 更精确的计算结果 可单独配置的分析周期 可自定义计算限制,以获得更好的性能 为希望查看更多信息的用户提供特殊的多实例设置 无尽的图形设置,可在每个图表中设置您最喜欢的颜色 无数的通知选项,让您再也不会错过任何重要信息 采用 Windows 11 和 macOS 风格的全新圆角设计 神奇的移动指标面板 FX Power 主要功能 所有主要货币的完整强势历史 所有时间框架内的货币强弱历史 所有经纪商和图表的计算结果完全相同 100% 可靠的实时计算 -> 无重绘 可通过下拉列表选择分析时段 通过自定义模式单独配置分析时段 可在一个图表中使用多个实例 可移动 FX Power 显示屏(通过拖放) 适用于高分辨率 QHD、UHD 和 4K 显示器 自动终端配置 针对平板电脑
Entry Points Pro
Yury Orlov
4.7 (224)
这是一款 MT4 的趋势指标,可提供准确的入场交易信号,且无重绘或延迟。 它可应用在任何金融资产:外汇、加密货币、贵金属、股票、指数。 最好的结果出现在 M15+ 的时间帧内。 指标的 MT5 版本 重要! 购买后请联系我,以便获取详细指南和奖励。 视频 (6:22) - 一个信号赢取的利润等于指标价格的三倍。 视频 (4:44) - 它如何在测试器中工作,我的提示和技巧。 视频 (1:44) - 有关它如何处理加密货币和指数的几句话。 大多数交易者在 Entry Points Pro 指标的帮助下,在第一个交易周内就改善了他们的交易结果。 Entry Points Pro 指标的益处 入场信号无重绘或延迟 如果信号出现,并得到确认(如果信号所在烛条已收盘),则它不会再消失;不像是重绘指标,它会导致重大的财产损失,因为它们可以在显示信号后再将其删除。 无差错开仓 指标算法可令您找到入场交易(买入或卖出资产)的理想时机,从而提高每位交易者的成功率。 Entry Points Pro 可操作任何资产 它允许您在 MT4 平台上交易任何经纪商提供的加密货币、股票、
Quantum Breakout Indicator PRO
Bogdan Ion Puscasu
4.96 (26)
介绍     Quantum Breakout PRO   ,突破性的 MQL5 指标,正在改变您交易突破区域的方式!   Quantum Breakout PRO 由拥有超过 13 年交易经验的经验丰富的交易者团队开发,旨在通过其创新和动态的突破区域策略将您的交易之旅推向新的高度。 量子突破指标将为您提供带有 5 个利润目标区域的突破区域的信号箭头,以及基于突破框的止损建议。 它既适合新手交易者,也适合专业交易者。 量子 EA 通道:       点击这里 MT5版本:   点击这里 重要的!购买后请私信我领取安装手册。 建议: 时间范围:M15 货币对:GBPJPY、EURJPY、USDJPY、NZDUSD、XAUUSD 账户类型:ECN、Raw 或 Razor,点差极低 经纪商时间:GMT +3 经纪商:IC Markets、Pepperstone with Raw 和 Razor 的点差最低 规格: 不重漆! 最多 5 个建议利润目标区域 建议止损水平 可定制的盒子。您可以设置自己的 Box Time Start 和 Box Time E
Scalper Inside PRO
Alexey Minkov
4.75 (55)
SALE NOW! Limited Time Offer! An exclusive indicator that utilizes an innovative algorithm to swiftly and accurately determine the market trend. The indicator automatically calculates opening, closing, and profit levels, providing detailed trading statistics. With these features, you can choose the most appropriate trading instrument for the current market conditions. Additionally, you can easily integrate your own arrow indicators into Scalper Inside Pro to quickly evaluate their statistics and
FX Volume
Daniel Stein
4.6 (35)
通过 mql5 和 Telegram 上 的 " 晨间简报 "获取每日市场更新,包括详细信息和屏幕截图 ! 外汇交易量(FX Volume)是第一个也是唯一一个从经纪商角度真正洞察市场情绪的交易量指标。 直接在您的图表上看到这些信息是真正改变游戏规则和突破性的交易解决方案。 受益于独特的市场数据洞察,如 比率(Ratios )显示货币多头和空头头寸的比率(百分比 比率变化 显示所选时间段内的多头比率及其百分比变化 总交易量 显示货币的总交易量(多头和空头),以手为单位 多头 交易量显示货币所有多头头寸的交易量 空头 交易量显示所有货币空头头寸的交易量 净多头 显示净多头交易量,即所有多头头寸减去所有空头头寸(以手为单位)。 净多头百分比 显示货币净多头交易量的变化 请阅读我们的基本教程 -> "如何使用外汇交易量进行交易 " 获取更多信息,如常见问题、交易技巧和教程视频,请访问我们的 外汇交易量公共信息频道 请 安装并运行 SI Connect 以建立与我们数据中心的持续连接 背景信息 我们都知道,外汇是一个分散的市场。这就是为什么我们必须打破常规思维,开发一个独
Cycle Sniper
Elmira Memish
4.41 (34)
NEW YEAR SALE PRICE FOR LIMITED TIME!!! Please contact us after your purchase and we will send you the complimentary indicators to complete the system Cycle Sniper is not a holy grail but when you use it in a system which is explained in the videos, you will feel the difference. If you are not willing to focus on the charts designed with Cycle Sniper and other free tools we provide, we recommend not buying this indicator. We recommend watching the videos about the indiactor and system before pu
Shepherd Harmonic Pattern
Abdullah Alrai
4.68 (59)
这个指标将检测手动和自动方法在图表上绘制的谐波模式。 您可以从此链接查看用户手册: 添加您的评论并联系我们以获得它 有一个免费版本可以在mt4上尝试此产品。 您可以使用它来检测Gartley和Nenstar模式: https://www.mql5.com/en/market/product/30181 您可以从以下链接购买完整的MT4版本: https://www.mql5.com/en/market/product/15212 注意 指标具有控制面板,并将保存每个(图表和时间框架)设置。 您可以将其最小化以在图表上获得更多空间,并且如果您更喜欢使用其他分析工具,则可以按关闭按钮隐藏所有指标数据 当您使用此指标并更改设置,添加诸如移动平均线或布林带之类的指标时,此指标将自动保存您的模板编辑,并且您可以随时加载它们。 如果您使用的是Windows 10,请右键单击MetaTrader图标>兼容性>更改高DPI设置>系统(增强)以获得最佳屏幕设置(应在高清设备中完成)。 指标只是谐波交易理论的解释,用于检测图表上的谐波模式。 如果您想学习它,可以搜索Scott Carney的书,名为“Ha
TakePropips Donchian Trend Pro
Eric John Pajarillaga Aldana
4.82 (17)
TakePropips Donchian Trend Pro   (MT4) 是一款功能强大且有效的工具,可使用 Donchian 通道自动检测趋势方向,并为您提供进场和退场交易信号! 这个多功能指标包括趋势扫描器、交易信号、统计面板、筛选器、交易时段和警报历史仪表板。它旨在为您提供交易信号并节省您分析图表的时间! 您可以在我们的博文中下载用户手册和安装指南:   https   :// www.mql5.com/en/blogs/post/751368 今天立减 50%!价格从 98 美元降到 49 美元! 您可以在 Strategy Tester 上测试该指标(启用可视模式)。如果您喜欢在实时图表上进行测试,也可以给我发消息以获取 7 天试用版。 视频教程也可在说明下方获得更多详细信息。 如果您有任何问题或需要任何帮助,请与我联系。 TakePropips Donchian Trend Pro 指标适用于所有外汇对、金属、商品、指数和加密货币。 主要特点 交易信号 - 检测多个时间范围内所有货币对的买卖机会。它将为您提供警报并在图表上绘制交易信号,最多 3 个止盈价和一个止
RelicusRoad Pro
Relicus LLC
4.78 (139)
现在$ 147(更新后增加到$ 499) - 无限帐户(PC或Mac) RelicusRoad 用户手册 + 培训视频 + 访问 Private Discord Group + VIP 身份 一种看待市场的新方式 RelicusRoad 是世界上最强大的外汇、期货、加密货币、股票和指数交易指标,为交易者提供保持盈利所需的所有信息和工具。我们提供技术分析和交易计划,帮助每一位交易者取得成功,从初学者到高级。它是一个关键的交易指标,可以提供足够的信息来预测未来的市场。我们相信一个完整的解决方案,而不是图表上几个没有意义的不同指标。这是一个多合一指标,显示无与伦比且非常准确的信号、箭头 + 价格行为信息。 RelicusRoad 基于强大的人工智能,提供缺失的信息和工具来教育您并使您成为交易专家,成为成功的交易者。 几乎所有技术指标都滞后,这意味着它们只能报告已经发生的事情。因此,他们只确认您过去可以看到的价格已经在哪里。我们相信领先指标可以预测未来价格,而无需重新绘制,也不要过度依赖可能改变并导致重新绘制的滞后指标。如果您根据滞后指标进行交易并建立头寸,您就知道您已
XQ Indicator MetaTrader 4
Marzena Maria Szmit
3 (2)
Step into the realm of Forex trading with confidence and precision using XQ, a cutting-edge Forex indicator designed to elevate your trading game to unprecedented heights. Whether you're a seasoned trader or just stepping into the world of currency exchange,   XQ Forex Indicator   empowers you with the insights and signals needed to make informed trading decisions. The signal conditions are a combination of three indicators, and XQ Forex Indicator only display  medium and long-term trends . The
Advanced Currency IMPULSE with ALERT
Bernhard Schweigert
4.91 (493)
目前31%的折扣!! 对任何新手或专家交易者来说都是最好的解决方案! 这个指标是一个独特的、高质量的、负担得起的交易工具,因为我们已经纳入了一些专有的功能和一个秘密的公式。只需一张图表,它就能给出所有28种货币对的警报。想象一下,你的交易将如何改善,因为你能够准确地确定新趋势或剥头皮机会的触发点 建立在新的基础算法上,它使识别和确认潜在交易变得更加容易。这是因为它以图形方式显示了一种货币的强势或弱势是否正在加速,并测量了这种加速的速度--把它想象成你汽车中的速度表。当你加速时,事情显然会发生得更快,这在外汇市场上也是一样的,即如果你配对的货币正在向相反的方向加速,你就会发现一个潜在的有利可图的交易。 货币动量的垂直线和箭头将指导你的交易! 动态的市场斐波那契23水平被用作警报触发器,将适应市场活动。如果冲动触及黄色触发线,您将在MetaTrader或您的电子邮件或推送警报中收到警报。然后你就知道作为一个交易员应该做什么。货币对和方向已经给出。只要点击警报按钮,就可以切换到该货币对或打开一个新的图表,以便进一步分析。警报级别可以通过用户输入来改变,可以选择3个敏感度级别
介绍 ON Trade Waves Patterns Harmonic Elliot Wolfe,这是一款高级指标,旨在使用手动和自动方法检测各种市场模式。以下是它的工作原理: 谐波模式: 该指标可以识别出现在您图表上的谐波模式。这些模式对于练习谐波交易理论的交易者非常重要,正如Scott Carney的书《谐波交易第1卷和第2卷》所描述的那样。无论您是手动绘制它们还是依赖自动检测,ON Trade Waves Patterns都可以胜任。 控制面板: 我们配备了一个用户友好的控制面板,它会保存您的图表和时间帧设置,使您可以轻松切换不同配置。您甚至可以最小化它以最大化图表空间。如果您更喜欢使用其他分析工具,只需单击关闭按钮即可隐藏所有指标数据。 模板保存: 当您自定义设置或添加其他指标,如移动平均线或布林带时,该指标会自动保存您的模板。这意味着您可以随时轻松加载您喜欢的设置。 优化显示: 对于Windows 10用户,我们建议调整您的DPI设置以获得高清设备上的最佳屏幕体验。右键单击MetaTrader图标,选择“兼容性”,然后选择“更改高DPI设置”,将其设置为“系统(增强)”。
Up down v6T
Guner Koca
5 (1)
Thise indicator is up down v6  comes with tradingwiev version. purchased people, after installed on terminal ,contact me on mql5  to get BONUS  TradingView version. up-down indicator is no repaint and works all pairs and lower than weekly time frames charts. it is suitable also 1 m charts for all pairs. and hold long way to signal. dont gives too many signals. when red histogram cross trigger line that is up signal.and price probably will down when blue histogram cross trigger line that is dow
Quantum Heiken Ashi PRO MT4
Bogdan Ion Puscasu
4.43 (7)
介绍     Quantum Heiken Ashi PRO 图表 Heiken Ashi 蜡烛旨在提供对市场趋势的清晰洞察,以其过滤噪音和消除虚假信号的能力而闻名。告别令人困惑的价格波动,迎接更流畅、更可靠的图表表示。 Quantum Heiken Ashi PRO 的真正独特之处在于其创新公式,它将传统烛台数据转换为易于阅读的彩色条。红色和绿色条分别优雅地突出了看跌和看涨趋势,让您能够以非凡的精度发现潜在的进入和退出点。 量子 EA 通道:       点击这里 MT5版本:       点击这里 这一卓越的指标具有以下几个关键优势: 增强清晰度:通过平滑价格波动,Heiken Ashi 金条可以更清晰地反映市场趋势,使您更容易识别有利的交易机会。 减少噪音:告别经常导致错误信号的不稳定价格变动。 Quantum Heiken Ashi 指标可过滤噪音,使您能够做出更明智的交易决策 无缝集成:Heiken Ashi 指标专为 MetaTrader 开发,可无缝集成到您的交易平台中。它用户友好、高度可定制,并且与您的其他交易指标和过滤器兼容 无论您是寻求新优势的经验
Currency Strength Exotics
Bernhard Schweigert
4.88 (33)
目前8折优惠! 对任何新手或专家交易者来说都是最好的解决方案! 这个指标是专门用来显示任何符号的货币强度,如异国货币对、商品、指数或期货。它是同类产品中的第一个,任何符号都可以添加到第9行,以显示黄金、白银、石油、DAX、US30、MXN、TRY、CNH等的真实货币强度。这是一个独特的、高质量的、负担得起的交易工具,因为我们已经纳入了一些专有的功能和一个新的公式。想象一下,你的交易将如何改善,因为你能够准确地确定新趋势或剥头皮机会的触发点? 用户手册:点击这里   https://www.mql5.com/en/blogs/post/708876 它适用于所有时间框架。你将很快能够看到TREND! 根据新的基础算法设计,它使识别和确认潜在交易变得更加容易。这是因为它以图形方式显示了8种主要货币和一种符号的强弱。 该指标显示了8种主要货币(澳元加元瑞士法郎欧元英镑日元新西兰美元)的强弱线,再加上一个符号! 该指标显示了符号的真实价值。例如:对于XAUUSD(黄金):价格以美元报价。如果黄金在上涨,你怎么能知道是黄金的强势还是美元的弱势?只有当黄金走强时,我们才会进行
首先值得强调的是,这个交易系统是一个不重绘、不重画和不滞后的指标,这使它非常适合专业交易。 “智能支撑和阻力交易系统”是专为新手和经验丰富的交易者量身定制的先进指标。它赋予交易者在外汇市场上精确和自信的能力。这个综合系统结合了7+种策略、10个指标和各种交易方法,包括日内交易策略、波段交易策略、支撑和阻力策略、蜡烛图模式策略、VWAP策略、多时间段趋势策略等。它提供箭头信号、入场和出场点、交易警报、更高时间框架的趋势分析、实时交易监控以及见解深刻的趋势和成交量蜡烛染色。通过自动支撑和阻力检测,这是一个多面手的指标,帮助交易者在不同的市场条件下做出明智的决策。 “智能支撑和阻力交易系统”是一个强大的技术分析方法,融合了一套高端和强大的指标和工具。在其核心,这个系统识别关键的支撑和阻力水平,这些水平作为潜在市场反转或延续的关键区域。该系统无缝集成了多时间框架趋势面板,增强了交易者在不同时间框架下评估当前趋势方向的能力。此外,蜡烛图模式检测器扫描价格图表以获取重要的蜡烛图模式,为潜在的市场走势提供宝贵的见解。此外,VWAP(成交量加权平均价格)的加入帮助交易者评估市场情绪和日内趋势
Th3Eng PipFinite Pro
Ahmed Farag
5 (2)
Th3Eng PipFinite PRO Indicator This product is distinct from the Th3Eng PipFinite Original, utilizing a different logic and algorithms. The Th3Eng PipFinite Pro indicator offers analysis of trend directions using custom algorithms. It provides indications of trend direction, entry points, a stop loss point, and three take profit points. The indicator also displays pivot points, dynamic support and resistance channels, and a side-box with detailed current signal information. How to Trade with
This Indicator does not repaint itself at all, it's identifies a new TREND in the bud, this indicator examines the volatility, volumes and momentum to identify the moment in which there is an explosion of one or more of these data and therefore the moment in which prices have strong probability of following a new TREND. CandleBarColorate never misses a beat, he always identifies a new TREND in the bud without error. This indicator facilitates the reading of charts on METATRADER; on a single wi
Ultimate Sniper Dashboard
Hispraise Chinedum Abraham
4.84 (25)
折扣价为299美元! 未来可能会涨价! 请阅读下面的描述! 终极狙击手仪表盘的最佳进入系统。终极动态水平。(请查看我的产品) 由于MT4多币种测试的限制,终极狙击手仪表盘只适用于实时市场。 介绍Ultimate-Sniper Dashboard! 我们最好的产品包括HA-狙击手、MA-狙击手和许多特殊模式。终极狙击手仪表盘是一个绝对的野兽! 对于任何新手或专家交易者来说,这是最好的解决方案! 永远不要再错过任何一个动作! 对于那些喜欢简单和点数的交易者,我们有一个特别的产品给你。本质上很简单,该仪表板根据多种自定义算法查看28种货币对,完成所有工作。只需一张图表,你就可以像专家一样阅读市场。试想一下,如果你能在任何外汇对开始移动时准确地确定其方向,你的交易会有多大的改善。   我们的系统是为了寻找高概率信号并实时向用户发送警报。没有滞后或错误的信号。 为了保持图表的清洁,你可以在不需要时隐藏Ultimate-Sniper。只需按下箭头按钮即可隐藏仪表板。 Ultimate-Sniper适用于从1分钟到月度的所有时间框架,因此你可以在你选择的任何时间框架上快速
Band trend indicator
lizhi fu
4.39 (23)
一款可以直观识别波段趋势的顶底指标,手工交易最佳选择,不重绘不漂移。 如何免费获得此指标: 了解更多信息 每间隔三天涨价$20元,涨价过程: 79--> 99 --> 119...... 涨到目标价 $ 1000为止。 适应任何新手和量化交易的朋友,可以把信号写入到EA中自由发挥,数组3和数组4,例:3>4为变绿,3<4为变红,如有不懂的请联系我。 参数简介: KQuantity  显示历史K线的数量 InpPeriod_3 指标获取范围参数 Popupalarm 弹窗报警开关 Mailalarm 邮件报警开关 AlarmTimeinterval  每报警一次的间隔时间 Upperhorizontalline 上方水平线参数 Lowerhorizontalline 下方水平线参数 ===================分析方法:===================== buy: 指标绿柱在下方水平线下,由红柱变成绿柱确定做buy。 sell:指标红柱在上方水平线上,由绿柱变成红柱确定做sell。
ON Trade Optuma Astro
Abdullah Alrai
5 (4)
当然可以!以下是您提供的文本的中文翻译: 引入 MT4 天文指标:您的终极天体交易伙伴 您准备好将交易体验提升到天文高度了吗?不用再寻找,就在我们的革命性 MT4 天文指标中。这个创新工具超越了传统的交易指标,利用复杂的算法提供无与伦比的天文洞察力和精确计算。 指尖上的宇宙信息: 瞻仰一个详尽的面板,展示了一宝藏般的天文数据。了解行星的地理/太阳心坐标,太阳/地球距离,亮度,伸长度,星座,黄道和赤道坐标,甚至是水平坐标——每个细节都经过精心计算并呈现得美轮美奂。指标生成的垂直线对应于时间值,为您的交易旅程提供了宇宙的视角。 行星线条与关系: 在您的图表上欣赏行星线条的魔力,具有可自定义的比例和角度。通过直观的控制面板轻松切换每个行星线条的可见性。通过连结、六分、四分、三分、对冲和逆行等指标,发现行星关系的艺术。在您选择的时间范围内探索这些宇宙构造,使您能够识别重要的交易机会。 揭示甘恩的智慧: 通过受甘恩启发的平方垂直线揭示潜在的反转时机。这种创新修改将甘恩历经考验的原则带入现实,帮助您提前了解市场的转向和趋势。 月亮引导: 在您的图表上优雅地导航月相,因为新月和满月点缀其间。月亮周期
作者的更多信息
CONGESTION BREAKOUT PRO This indicator scans the breakout of congestion zones . This indicator unlike any other congestion indicator you will find in the market right now,  it uses an advanced algorithm not peculiar to most traditional congestion indicators available today . The advanced algorithm used to define the congestions  is greatly responsible for the high rate real congestion zones and low rate fake congestion zones spotted by this product. UNDERSTANDING CONGESTION Congestion are
Good News ! Advanced Currency Meter is more awesome now ! If you have been a fan of the free version of Advanced Currency Meter then I will implore you not to be discourage because you will soon find that the new paid version is worth every dime. Unlike the free version the new paid version of Advanced Currency Meter now has a newly added panel called the “% Daily Range” . Why A Paid Version Now? We believe you like good things and many who has used Advanced Currency Meter over the years will te
Advanced Currency Meter MT5
Nesimeye Oswald
4.6 (5)
More About Advanced Currency Meter Every good forex system has the following basic components: Ability to recognize the trend direction. Ability to identify the strength of the trend and answer the basic question Is the market trending or is it in a range? Ability to identify safe entry points that will give a perfect risk to reward (RR) ratio on every position. How Advanced Currency Meter Helps you Achieve These Components Advanced Currency Meter is a tool that measures the strength between i
FREE
Swing Continuation
Nesimeye Oswald
2.33 (6)
The swing continuation pattern happens in a trend direction after a short reversal / pull back . As the name suggests , these patterns occurs along the swing high and swing lows of a trend , this makes the patterns very low risk patterns with potential high rewards . The swing continuation indicator also combines Currency Meter as a filter for its execution. The idea is to go with both the price trend flow and currency trend flow. Which means the price action must be supported by the currency st
M W Pattern Pro
Nesimeye Oswald
4.14 (7)
M & W Pattern Pro is an advanced scanner for M and W patters , it uses extra filters to ensure scanned patterns are profitable. The indicator can be used with all symbols and time frames. The indicator is a non repaint indicator with accurate statistics calculations. To use , simply scan the most profitable pair using the statistics dashboard accuracy , then enter trades on signal arrow and exit at the TP and SL levels. STATISTICS : Accuracy 1 : This is the percentage of the times price hit
Heiken Ashi RSI Oscillator
Nesimeye Oswald
4.88 (8)
This system is an Heiken Ashi system based on RSI calculations . The system is a free open source script originally published on TradingView by JayRogers . We have taken the liberty of converting the pine script to Mq4 indicator . We have also added a new feature which enables to filter signals and reduces noise on the arrow signals. Background HEIKEN ASHI The Heikin-Ashi technique is used by technical traders to identify a given trend more easily. Hollow white (or green) candles with no l
FREE
FRM Half Trend
Nesimeye Oswald
5 (1)
The system is a free open source pine script originally published on TradingView by everget   . It was converted to Mt4 by Forex Robot Makers   This system is a  popular trend indicator based on ATR ( Average True Range ) , Moving Averages and the Donchian channel . System BackGround ATR The average true range is an indicator of the price volatility of an asset. It is best used to determine how much an investment's price has been moving in the period being evaluated rather than an indicatio
FREE
Channel Vertex Pro
Nesimeye Oswald
5 (1)
Channel Vertex is a price action pattern formed by price Chanel and a triangle pattern . Price channels basically indicates possible support and resistance zones around a price movement and retracement    or breakout at these levels can indicate possible trend continuation or reversal .  Majority of the times price fluctuations forms triangle patterns defined by 3 vertexes , these triangle patterns most times defines a trend continuation.  A triangle pattern is a trend continuation pattern tha
Swing Continuation Pattern Free
Nesimeye Oswald
4.25 (4)
This free version can only be used for GBPUSD M15 chart . To use on all time frames and pairs , Get Pro Version The swing continuation pattern happens in a trend direction after a short reversal / pull back . As the name suggests , these patterns occurs along the swing high and swing lows of a trend , this makes the patterns very low risk patterns with potential high rewards . The swing continuation indicator also combines Currency Meter as a filter for its execution. The idea is to go with
FREE
High Volume Turns
Nesimeye Oswald
4.7 (10)
Most of the time, market reversals / pull backs usually follow volume and price spikes thus  these spikes could be the first indication of an exhaustion and possible reversal/pullback. High volume Turns is an indicator that scans the market for price and volume spikes around over-bought/over-sold market conditions. These spikes when spotted serves as the first indication of reversal/pullback. Note :  Though it seems ok now but this is a system that is still under development. We have made it p
FREE
M & W Pattern Pro is an advanced scanner for M and W patters , it uses extra filters to ensure scanned patterns are profitable. The indicator can be used with all symbols and time frames. The indicator is a non repaint indicator with accurate statistics calculations. To use , simply scan the most profitable pair using the statistics dashboard accuracy , then enter trades on signal arrow and exit at the TP and SL levels. STATISTICS : Accuracy 1 : This is the percentage of the times price hit
Volatility Ratio
Nesimeye Oswald
4.24 (21)
The Volatility Ratio was developed by Jack D. Schwager to identify trading range and signal potential breakouts. The volatility ratio is defined as the current day's true range divided by the true range over a certain number of days N (i.e. N periods). The following formula is used to calculate the volatility ratio: Volatility Ratio (VR) = Today's True Range/True Range over N number of days To calculate the volatility ratio, the true range is calculated using the following formula: Today's True
FREE
Daily Correlated Pairs
Nesimeye Oswald
4.8 (5)
The popular saying in forex  "The Trend is your friend"   has always stood the test of time because it is valid statement for every generation of traders and in every market. Most successful traders do not fight against the trend but lend to flow with it.  Sometimes finding the best pair to trade can be a daunting task even when you have a good strategy . Some strategies works well with trending markets and some don't . So the question is how can you easily spot trending pairs without any hass
FREE
This indicator scans the 1-3 Trendline pattern . The indicator is a 100 % non repaint low risk breakout system . The patterns are formed around swing high and swing lows which make them a low risk pattern with high reward. PATTERN BACKGROUND The 1-3 Trendline Breakout pattern is formed by four(4) points which are composed of three (3) primary points and the pattern neck. A trendline is always formed by the point 1 and the neck of the pattern . When price breaks out of the trendline formed ,
Wolfe Scanner Pro
Nesimeye Oswald
3.5 (2)
WOLFE WAVE PATTERNs First discovered by Bille Wolfe . The wolfe wave  is a 5 wave price action pattern that is formed by supply and demand in a market and the fight to reach equilibrium in the market . The entry spot of the pattern is defined by the breakout of the trend created by wave 1 and wave 3 . This pattern forms in any market where there is supply and demand thus it can also be used to trade commodities and stocks. Wolfe Waves are reversal patterns that usually carry a low risk margin. P
Flag Pattern pro is a   Price Action (PA)   analytical tool that scans the   continuation patterns   known as   "Flag and Pennant Patterns"   . Flag and Pennant patterns are continuation patterns characterized by a move in a previous trend direction after a shallow retracement usually below 50% of the original move . Deep retracements can however be sometimes found at the 61.8 % levels. The original move is know as the   flag pole   and the   retracement   is called the flag. Indicator Fun
Note : The slow loading of the indicator issue has been addressed . This new version loads fast and does not slow the platform. Version 1.3 : We have updated the indicator to include an historical bar scanning option . So instead of scanning all bars in the history (which can make the indicator slow sometimes ) , you can select the maximum number of bars it can scan which can increase the performance and make the indicator faster. This indicator scans the 1-3 Trendline pattern . The indic
This Currency Meter Calculates Strength Using a currency basket of 28 pairs? This Currency Meter uses a basket of 28 currency pair to define strength. This is very important because it gives an wholesome view of the strength of a currency by considering its reaction to all major currencies paired with it. This Currency Meter is Multi-timeframe!!! Majority of the currency strength indicators around the market today only has a single time frame view. Even with the so called multi-timeframe ver
Camarilla Pivots Historical
Nesimeye Oswald
4.57 (7)
Camarilla Pivots Historical plots the historical data of the camarilla pivot point levels on the chart. The Camarilla Pivot levels was originated in 1989 by Nick Scott. The levels are used as primary support and resistance levels by Intraday traders. The levels are calculated with the following formula: R4 = C + RANGE * 1.1/2 R3 = C + RANGE * 1.1/4 R2 = C + RANGE * 1.1/6 R1 = C + RANGE * 1.1/12 PP = (HIGH + LOW + CLOSE) / 3 S1 = C - RANGE * 1.1/12 S2 = C - RANGE * 1.1/6 S3 = C - RANGE * 1.1/4 S4
FREE
This Currency Meter Calculates Strength Using a currency basket of 28 pairs? This Currency Meter uses a basket of 28 currency pair to define strength. This is very important because it gives an wholesome view of the strength of a currency by considering its reaction to all major currencies paired with it. This Currency Meter is Multi-timeframe!!! Majority of the currency strength indicators around the market today only has a single time frame view. Even with the so called multi-timeframe versi
Mommentum Channel
Nesimeye Oswald
5 (1)
Momentum channel is a simple momentum based system yet with a great degree of accuracy in detecting turning points. The market momentum are defined by Average True Range Channels . When price breaks these channels most times , it is an indication of a shift in market momentum and thus a possible new trend formation. The system can be traded on any time frame and symbol and can also be used to trade commodities and stocks. INPUT MENU ATR_Period :  Average True Range Momentum Period ATRMultip :
FREE
Ask any successful forex traders the secret of their success and they will tell you that the first key to a successful forex trading is proper trade management. Trade management is what differentiates the rookie from the pro in Forex. While the rookie trades based on emotions and greed, the pro trades based on certain logic and rules . These logic and rules are all embodied in a successful Trade Management System. Advanced Trade Manager is a combination of different trade management systems desi
Pivots Dashboard
Nesimeye Oswald
5 (3)
Pivots Dashboard is the single most complete instruments set for Pivot Points trading currently available in the market. We have done a comprehensive research prior to the product design to make sure that this product meets every need of Pivot Point trading. Pivots Points are significant levels technical analysts can use to determine directional movement and potential support/resistance levels. Pivot Points are thus predictive or leading indicators. While the points were originally used by floor
Flag Pattern Pro
Nesimeye Oswald
5 (4)
Flag Pattern pro is a   Price Action (PA)   analytical tool that scans the   continuation patterns   known as   "Flag and Pennant Patterns"   . Flag and Pennant patterns are continuation patterns characterized by a move in a previous trend direction after a shallow retracement usually below 50% of the original move . Deep retracements can however be sometimes found at the 61.8 % levels. The original move is know as the   flag pole   and the   retracement   is called the flag.   Indicator Fun
筛选:
danmar
1344
danmar 2023.02.21 08:51 
 

Hi the product is good but i wait a certain time to have a certain time for update

and it is why my first rate was 1 star but now it is done

and for me it is a great help in my daily use

Please put on your do list 2 things :

1) currency dashboard in main window left up , could you make it sorted by currency

2) the currency dashboard in sub window at the right of the lines :

please could you :

a) add a parameter space to be able to see it better

b) add a parameter to specify the number of sub windows

otherwise it could go not in the same windows of the indicator

c) sort the currency from weak to strong

any case the one very important you make it = Thank you a lot

Warmly

Nesimeye Oswald
85083
来自开发人员的回复 Nesimeye Oswald 2023.03.12 03:14
Hello , we have just published version 2.2 . Please download and use the new version In this version We have made the following upgrades to the indicator . 1.) Line display Colors can be selected right from the input menu 2.) There is an option for the Text Size of the pair dashboard and also for the Text size of the currency dashboard 3.) The pairs on the main dashboard are filtered according to the currency you chose . E.g If you disable 'USD' , all 'USD' pairs disappear on the main dashboard Will look into your new request. Thanks
jmhuang
3107
jmhuang 2021.06.26 05:40 
 

a good CSM - would appreciate if the programmer could remove the logo from the window screen. Logos should be confined to pdf instruction and the default setting of the indicator. The programmer is responsive and provides good service. Would be good if there is a column ShowAuto so that the indicator can just show the lines of the two pairs instead of all pairs

Nesimeye Oswald
85083
来自开发人员的回复 Nesimeye Oswald 2023.03.05 03:40
Thank you sir, will attend to all your points in our chat . Please note that there is an option named 'LINE DISPLAY' on the input menu. You can chose to display all currency lines of just the two lines for the current pair
Gerardo Llanos
348
Gerardo Llanos 2019.12.09 07:16 
 

Repinta

Nesimeye Oswald
85083
来自开发人员的回复 Nesimeye Oswald 2023.03.05 03:42
Hello sir , please explain more what you experienced so i can help. This is a very good indicator that has helped many in their trading . Let me help you if you need more explanation on how to use it
katototo
614
katototo 2019.11.07 06:31 
 

Have been trying this for months side by side with all sorts Currency meters and I must say it gives better signals and on the automatic time frame selection it cuts out

a lot of the noise and gives very good buy and sell signals.

If it does not confirm your systems signal maybe you should not take it.

Smarter Objects, LLC
430
Rodney Jean Pierre 2019.10.25 21:27 
 

After suffix fix, I was actually able to use VS28. It paid for itself in one trade (even though I was 10 pips late on M5 entry)! Very promising, looking forward to Developer continued investment in VS28.

kennyschuble
133
kennyschuble 2019.07.18 18:37 
 

I have to say with the new updates to this it truly is a great volume strength meter ! So many ways to use it. With your current existing system its fabulous ! Having the volume strength of the market to confirm or backing of your current system ! The exiet Xs do work and are truly good exit signals. It's not a perfect indicator meter but one of the BEST ! I have added it to one or two other market meters for a market trading system and not just a pair system. Worth the buy !

Hassan
482
Hassan 2019.05.04 12:32 
 

Very volatile. Not accurate.

Update: I did not find something new in the update cursor became redraw when the signal comes to go to another frame. And when I go back to the frame that I received the signal disappear and appear elsewhere. I talked to the author of the index but he was unable to solve the problem I do not recommend buying this indicator.

Nesimeye Oswald
85083
来自开发人员的回复 Nesimeye Oswald 2021.06.26 11:37
Have you tried the new version ? Also there is an option for time frame change in the indicator, just in case the current time frame is too volatile for you , a higher time frame would be more stable
harrygift
59
harrygift 2019.05.02 19:42 
 

There is literally no support after purchase. i have called. sent whatsapp. emailed. the guy spoke with me briefly and that was it...i have been beging for a reply ever since..nada...not recommended/

Nesimeye Oswald
85083
来自开发人员的回复 Nesimeye Oswald 2023.03.05 03:43
Sorry about that . All issues resolved. Thanks
Max J
336
Max J 2018.10.24 18:54 
 

This is a good product. I have been using it and it helps me decide the right direction of price action.

回复评论
版本 2.2 2023.03.05
In this version We have made the following upgrades to the indicator .

1.) Line display Colors can be selected right from the input menu
2.) There is an option for the Text Size of the pair dashboard and also for the Text size of the currency dashboard
3.) The pairs on the main dashboard are filtered according to the currency you chose . E.g If you disable 'USD' , all 'USD' pairs disappear on the main dashboard

Good Luck and Happy Trading
版本 2.1 2021.06.30
We have removed the brand logo in this version based on a customer request.
Also we have added Line Display selection type. You can either display all currency lines or lines for current pair only
版本 2.0 2019.10.22
We have fixed bug with previous version. It now works with pairs having suffix
版本 1.60 2019.06.14
In addition to histogram display, we have also added the trend line display ! We have also addressed repaint problem, arrow signals no longer repaints
版本 1.50 2019.06.09
The design of the indicator has been changed along with some calculation metrics. Based on complaints of high volatility we have been getting ,we have designed this version around a stable market system with the ability to spot early trends and exit trends early.
版本 1.40 2019.05.05
Temporary version while indicator undergoes upgrade
版本 1.30 2019.03.21
Based on the request of customers we have added a new feature to the indicator. In the new version you can enable / disable display of currency values on the indicator window. Just enable/disable "Display Currency Value " on the input menu to use this option. This will enable for an option to have a clean and uncluttered chart.
版本 1.20 2018.10.28
We have fixed the bug with the notification system. The Yellow Zone Alert and The Trend Exit Alert gives recurring alerts on some occasions. This issue has been fixed. We have also re-enabled the trend arrows.
版本 1.10 2018.09.28
We have updated the chart trend arrows to show the exit signals only for clarity . Exit previous trend on exit signal.