• 概述
  • 评论
  • 评论

Vertical Histogram Volume

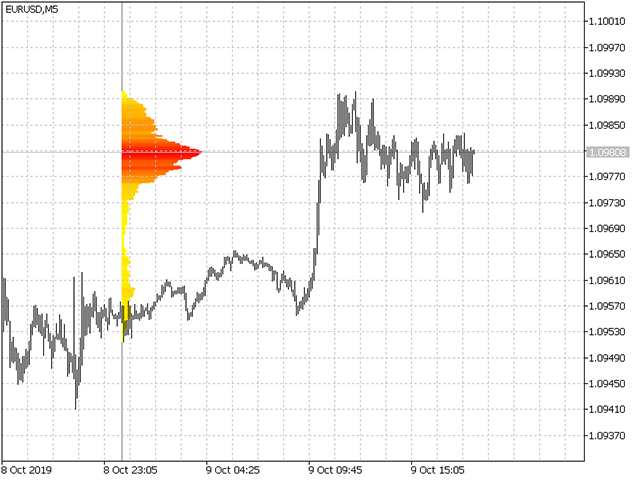
Вертикальная гистограмма объема -  отображает распределение объема по уровням.

Гистограмма рассчитывается от объема ( реального или тикового), при этом объем соответствующий бару переносится на уровень H-L бара.
Таким образом, при распределении объема за сутки по вертикали - формируются максимумы гистограммы показывающие области проторговки.

Настройки индикатора:

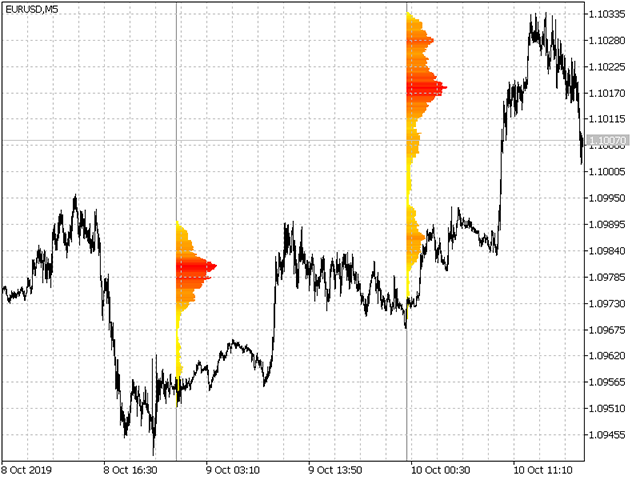
  • Timeframe Set -  период в пределах которого производится расчет. (рекомендуется D1)
  • Step's - количество отображаемых периодов.
  • Amplitude - нормированная амплитуда (в барах)
  • Applied Volume - тип объема. Тиковый или Реальный ( Если есть)
  • Cold -  цвет для отображения минимальных объемов
  • Hot -  цвет для отображения максимального накопленного объема
  • Line Color - цвет линии разграничивающей периоды


Последний период отображаемый на чарте находится в процессе постоянной перерисовки до закрытия периода!

推荐产品
The Expert Advisor analyzes tick micro-signals and determines the direction to open a position. Micro-signals are identified by predetermined codes, which in the optimization are recorded in the settings of the bot. When a bot sees the corresponding micro-signal, it reacts to it by opening a position and its accompaniment! The bot has good predictability. You can check the work of the bot on the simulation of real history, how to configure the tester will be shown in the screenshot. Also, we sh
89 USD
Immortal MT5
Paranchai Tensit
The EA is based on   trend trading strategy . Mechanism " trend trading strategy " is a tendency of a financial market price to move in a particular direction over time. If there is a turn contrary to the trend, This mechanism will exit and wait until the turn establishes itself as a trend in the opposite direction, and re-enter when the trend re-establishes. This EA has been back tested for 4 years of real tick data (2019-2022), consistent with the latest trading accounts. Immortal MT4:   https
90 USD
Niubility Trend  Niubility Trend  displays the trend direction for all time frames in real time. You'll see at a glance at which direction the trends are running, how long they last and how powerful they are. All this makes it an easy-to-use trend trading system for beginners, advanced and professional traders. Features Easy to trade Customizable colors and sizes It is non-repainting and non-backpainting It is fantastic as a trailing stop method It implements alerts of all kinds
30 USD
CounterTrend 5
Antony Augustine
The indicator shows buy and sell signals.  The " CounterTrend 5 " is designed to recognize profitable counter trend patterns from your chart. Features: The CounterTrend 5 is a Counter-Trend Trading with Simple Range Exhaustion System. Signals based on the daily trading range. The indicator calculates the trading range for the last few days and compare the price movements on short time intervals and generating short term reversal points.  This is a leading indicator. It works on any instruments.
40 USD
Ultimate Hero MT5
Smart Forex Lab.
为实现最高性能而构建。针对利润提取进行了优化。 推出新选项 - 通过模拟利润提取进行测试。 Ultimate Hero 是一款先进的交易工具,旨在最大限度地提高您的外汇交易利润。这款先进的交易软件采用最新的 GPT-4 技术创建,具有多种先进功能。 Ultimate Hero 是一款使用基于马丁格尔系统的网格交易策略的交易机器人。它的设计目的是根据当时的市场情况进行多次交易,从而提供稳定的回报。 专家顾问使用网格交易方法,在不同价位下多个订单,围绕当前市场价格创建网格。通过这种方法,机器人可以不断进入市场,捕捉双向的潜在价格变动。 Ultimate Hero 使用马丁格尔交易系统来管理风险并确保盈利。该系统包括增加后续交易的规模,同时保持相同的盈利目标,从而最大限度地减少亏损交易的影响,最大限度地提高获胜交易的潜在利润。 交易专家使用先进的算法和市场分析工具来优化交易参数,并做出有效的交易决策。它不断进行实时监控和调整设置,使智能交易系统在任何市场条件下都能保持盈利。 总之,Ultimate Hero 是一款智能、高效的自动交易解决方案,对于初学者和经验丰富的交易者来说都是非常有
145 USD
Hrum
Yvan Musatov
The Hrum indicator was created to neutralize temporary pauses and rollbacks. It analyzes price behavior and, if there is a temporary weakness in the trend, you can notice this from the indicator readings, as in the case of a pronounced change in trend direction. Entering the market is not difficult, but staying in it is much more difficult. With the Giordano Bruno indicator and its unique trend line, staying on trend will become much easier! Every rise and every fall is reflected in your emot
97 USD
Imbalance Algo
Maya Roma Oberholzer
Imba Algo is a trend following strategy. When the trend changes it provides either a sell or buy signal. The calculation for the trend change is based on the sensitivity setting and Fibonacci levels. It executes 4 trades - at specified risk or lot size - as per settings. Each trade has it’s own SL, TP - calculated per risk set. (See settings) The targets can also be set as per trade management options. (Eg. 1R, 2R, 3R and 4R) The trade/s exits either when TP is reached or stopped out or when the
250 USD
The Rise of Sky walker   is a trend indicator is a powerful indicator for any par and any timeframe. It doesn't requires any additional indicators for the trading setup.The indicator gives clear signals about opening and closing trades.This Indicator is a unique, high quality and affordable trading tool.  Can be used in combination with other indicators Perfect For New Traders And Expert Traders Low risk entries. Never repaints signal. Never backpaints signal. Never recalculates signal. Great Fo
30 USD
MA Fly EURUSD mt5
Sebastian Furmanek
Backtest from   2003-2019 MetaQuotes Data Every Tick Mode EA created for EURUSD H1 Open  transaction based on MA and Volume Close transaction based on RSI or take profit One transaction at the time. No adding position, no martingale, no grid. My recommendations: For "safe mode" i recommend 0.1 lot per 10000USD For "risky mode" i recommend 0.5 lot per 10000USD Personally i use 0.3 lot per 10000 USD Fell free to increase lot size while you earn. This EA does not open transaction e
71 USD
AlgoKing Chandelier Exit Indicator (MT5) The Chandelier Exit Indicator is a volatility based indicator that maximizes returns using the Average True Range (ATR) value and the highest high or lowest low of a period. Benefits Should be used as a trailing stop. Helps you exit a position when you have a respectable profit. Identifies a high probability of a trend reversal when the price moves against the prevailing trend by a distance equal to 3x the average volatility. Join the AlgoKing Lightning
45 USD
Man Trend
Ivan Simonika
Man Trend uses at its core the process of identifying the rate of change in price growth and allows you to find entry and exit points from the market. The indicator was created on the basis of the original indicators for searching for extreme points, the indicator is well suited for determining a reversal or a large sharp jerk to one of the sides, thanks to it you will know when this happens, it will notify you with the appearance of a blue dot to buy red to sell. This is a fundamental tech
119 USD
该指标是两个改进的Lanczos滤波器的组合。 第一个过滤器用于推断价格。根据过去的价值,他预测当前柱内可能的价格变动。也就是说,它表明如果过去的趋势保持不变,价格会是多少。 第二个过滤器,用于平滑和平均窗口内的价格,由过滤器的级别决定。由于选择了权重,此过滤器最积极地响应价格变动中存在的周期性组件。 可以使用 EF 和 IF 参数调整指标。通过选择 EF 和 IF 的值,您可以获得有关趋势价格变动开始的信号。 EF   - 指数滤波器的窗口大小。有效值为 EF = 0 ... 255 。并且在计算期间处理的条数是 2 * EF + 1 。该参数越大,价格序列的过去价值的影响越大。结果以实线绘制。 IF   - 调整平均窗口的大小。  IF = 0 ... 255 的值。要计算的条数是 2 * IF + 1 。  IF 值越大,使用此过滤器检测到价格变动的较长时段。结果以虚线显示在图表上。
30 USD
Gibraltars
Yvan Musatov
The Gibraltars indicator was created to neutralize temporary pauses and rollbacks. It analyzes the price behavior and if there is a temporary weakness in the trend, you can notice it from the indicator readings, as in the case of a pronounced change in trend direction. Entering the market is not difficult, but staying in it is much more difficult. With the Giordano Bruno indicator and its unique trend line, staying in a trend will become much easier! Every rise and fall is reflected in your e
107 USD
特点 更少的设置,通过变量操控实现完全自动化交易 利用突破策略和追踪进行交易 使用2017年至2023年的实际ticks进行研究 获胜率91.5%,最大回撤为29% 仅适用于EURUSD货币对,1小时时间框架,需要无点差ECN账户 要求 交易货币 仅限EURUSD 时间框架 仅限1小时 初始存款 1000美元以上 杠杆 不超过1:500 账户 无点差ECN账户 变量 交易设置 MagicNumber : 输入唯一编号 AutoLot : 如果为true,根据当前余额计算交易量 PerLot : 当AutoLot为true时,作为分母使用,例如)余额1000美元,PerLot 2000 结果为0.5手,或者余额1000美元,Perlot 1000 结果为1手 FixedLot : 当AutoLot为false时,只交易您输入的固定手数 ExceedValue : 额外的突破值 TakeProfit : 利润变量(以点为单位) Stoploss : 亏损变量(以点为单位) BollingerFilter : 您可以选择基于布林带的特殊过滤器 CloseWeekend : 在周五市场
99 USD
对于 MT4: https://www.mql5.com/en/market/product/99489 对冲是一种交易策略,旨在保护交易者资金免受不利货币汇率波动的影响。 通过对冲,交易者可以避免巨大的潜在损失。 对冲是一种“限制”或“保护”交易者资金免受货币汇率不利波动影响的交易策略。 对冲为交易者提供了一个机会,即使他们处于交易过程中,也可以保护资本免受可能的损失。 诀窍是在货币汇率变动不允许交易者获利时将损失风险降至最低。 通常,当价格达到止损水平或追加保证金时,或者如果交易者自己进行止损,亏损交易者的头寸将自动平仓。 在这三种情况下,交易者肯定会承担很多损失。 然而,如果市场参与者使用对冲策略,交易者就有机会将损失降到最低,甚至收支平衡。 不仅如此,对冲还可以帮助市场参与者规划他们的下一个交易头寸。 关键是对冲是通过同时买卖相同的资产或几种不同的资产来完成的,但价格变动是相互关联的(既上涨,又下跌)。
30 USD
KT Volatility Oscillator MT5
KEENBASE SOFTWARE SOLUTIONS
KT Volatility oscillator analyze the past and current market data with a mathematical formula to display the result in a form of an oscillator. The growing and deteriorating waves are equivalent to high and low volatility in the asset.  In a nutshell, volatility is simply a measurement of the price fluctuation of an asset over a certain period of time. Without volatility, there would not much movement in the market and traders would not be able to profit from the price movements. Use of Volati
30 USD
Didi Index
Flavio Javier Jarabeck
4.77 (22)
The famous brazilian trader and analyst Didi Aguiar created years ago a study with the crossing of 3 Simple Moving Averages called "Agulhada do Didi", then later was also named Didi Index, as a separate indicator. The period of those SMAs are 3, 8 and 20. As simple as that, this approach and vision bring an easy analysis of market momentum and trend reversal to those traders looking for objective (and visual) information on their charts. Of course, as always, no indicator alone could be used wit
FREE
Vision AGI
Franck Martin
4.73 (11)
Vision AGI is the result of the merger between BotAGI and GPT. More than one year of development to create this expert. Equipped with an advanced algorithm and a combination of custom indicators, it is designed for the long term but also PROP FIRM , making it one of the most reliable robots of its generation. ***Buy Vision AGI and request another one of my EAs for free!***   Add me to your friends and request more details privately. -> Please note that backtesting does not take into account
69 USD
Time Breakout
George Angelo Boutselis
5 (2)
https://www.mql5.com/en/signals/1926504?source=Site+Signals+My 策略: 当美国市场开盘时,交易量会大幅增加,因此也存在波动。价格倾向于从预定义的范围“突破”,例如,在之前的英国交易时间内一组。时间突破允许我们轻松交易这些突破机会。 特点: 基于时间的突破分析:该策略侧重于历史上表现出更高市场波动性和交易活动增加的特定时间间隔。通过利用这些知识,时间和范围突破策略有效地确定了这些目标时期的突破机会。 价格范围评估:该策略采用范围分析来确定最佳突破水平。它计算特定时间段内的价格范围,使系统能够在价格超过预定阈值时识别潜在的突破。 可定制的参数:时间和范围突破策略通过允许用户根据他们的交易偏好调整各种参数来提供灵活性。交易员可以自定义时间间隔、止损设置、获利水平和其他基本参数,以使策略与他们独特的交易风格和风险承受能力保持一致。然而,这没有必要,因为专家顾问预先优化了默认输入参数。 风险管理:该战略强调风险管理原则,以保护资本和保护利润。每笔交易都有止损。不同的资金管理设置可用。 多符号:这位专家顾问还能够在一张图表上交易多个符号
40 USD
COGO Hunter
Mr Anucha Maneeyotin
COGO Hunter is a fully automatic Expert Advisor for Trend, Hedging, News filter          Strategy Trade Base On Fibonacci expansion And Fibonacci retracement And Stochastic Oscillator          Stochastic Main Line And Signal Line Use For Open Pending Order Buy Or Sell Fibonacci expansion Are Use Target Profit support and resistance level price          COGO Hunter can work on a VPS Features          No martingale          Hard stop loss and take profit for each position          Flexi
100 USD
Ladder Heaven
Gia Thong Nguyen
If you have difficulty determining the trend as well as entry points, stop loss points, and take profit points, "Ladder Heaven" will help you with that. The "Ladder Heaven" algorithm is operated on price depending on the parameters you input and will provide you with signals, trends, entry points, stop loss points, take profit points, support and resistance in the trend That direction. Helps you easily identify trends, stop losses and take profits in your strategy! MT4 Version: Click here F
FREE
The indicator scans for TD Combo signals in multiple timeframes for the all markets filtered and shows the results on Dashboard. Key Features Dashboard can be used for all markets It can scan for signals on MN1, W1, D1, H4, H1, M30, M15 ,M5, M1 timeframes Parameters UseMarketWatch: Set true to copy all symbols available in market watch MarketWatchCount : Set the number of symbols that you want to copy from the market watch list. CustomSymbols: Enter the custom symbols that you want to be availa
198 USD
Carnage
Philip Effiong Philip
Carnage  is an aggressive  pullback  scalper designed for  volatile assets . It uses a sequence of orders and has its own  TP  and  SL . It uses a proven  martingale  system. This EA is using  strong recurrences  of the past to take position(Historical Data) and achieve a  high success rate . It gathers data and runs analysis with the relative strength index. It has a high % of market recovery over time. After purchase, kindly send me a message and indicate your account size so I can give you
50 USD
Snap Fire MT5
Adisak Vongkingsri
SIGNAL  :    https://www. myfxbook .com/members/FXRIndicator/icmarkets-snapfire/10708916 SIGNAL  :   https://www. myfxbook. com/members/FXRIndicator/vantage-snapfire/10735810 Price increase $50 for every 100% profit. MT4 :  https://www.mql5.com/en/market/product/113962 MT5 :  https://www.mql5.com/en/market/product/113961 ADVANTAGES One chart Setup . Great result in past and still going . No important settings . just chose risk level what you can afford . REQUIREMENT Best Brokers Recomme
49 USD
StrategyBuilder
Catalin Zachiu
Strategy Builder 是一款专为 MetaTrader 5 精心打造的先进多功能交易机器人,旨在为交易者提供先进的标准指标库。 这种精心设计的算法通过将大量指标无缝集成到统一策略中,提供了一种全面的交易方法,使交易者能够准确而自信地驾驭动态的金融市场。 主要特征: 指标多样性:策略生成器利用广泛的标准指标的力量,包括但不限于加速振荡器、自适应移动平均线、真棒振荡器、空头力量、多头力量、商品通道指数、DeMarker、双指数移动平均线、包络线 、分形自适应移动平均线、MACD、移动平均线、抛物线转向指标、相对强度指数、相对活力指数、随机指数、三重指数平均线、三重指数移动平均线和威廉姆斯百分比范围。 这套多样化的指标构成了细致入微的交易策略的支柱。 灵活的阈值:通过为开仓和平仓交易设置特定阈值,精确定制您的交易策略。 这种灵活性确保了对不同市场条件的适应性,并使算法与您独特的交易偏好保持一致。 风险管理策略:策略生成器优先考虑风险管理,为交易者提供一套强大的工具。 使用止损和获利水平等功能建立您的风险参数。 此外,您可以在固定手数之间进行选择,或采用具有自动手
49 USD
ROC acceleration-deceleration is the manual system for medium-term scalping. Indicator based on custom ROC system which defines bullish/bearish market and especially  acceleration-deceleration of tendention in the market's main direction. Buy arrow is plotted during bearish market when current trend decelerates and sell  arrow is plotted during bullish market when current trend decelerates. Main Indicator's Features Signals are not repaint,non-late or disappear(exept cases when system recalculat
199 USD
The EA opens trades based on Fractals indicator signals and uses smart averaging and position volume calculation. Unlike most grid expert advisors, Double Grid Pro opens averaging positions only on signals. The Fractals indicator is considered the most effective in this case. The expert Advisor can be configured for an aggressive and conservative trading style. The key parameter in the strategy is the CorrectionValue parameter, it indicates the size of the correction at which we close the ent
150 USD
The EA uses scalping strategy at night, trading consists of three algorithms and each algorithm works in its own time interval. The EA uses many smart filters to adapt to almost any economic situation. Pending orders are used for the least slippage when trading scalping. The adviser is safe and does not require any settings from the user, just install it on the chart and you are ready. The EA sets a protective stop order, so the trader does not have to worry that the robot will allow significant
70 USD
Fully automatic multicurrency trading machine MT5/4 The advisor's strategy is based on trading volumes and statistics of the movement of trading instruments, the author's trading method, which shows excellent results over the past 7 years Multicurrency testing since 2016 with 99.9% real ticks, testing was carried out on the MT5 platform, with all traded currency pairs at the same time. The Expert Advisor has three trading strategies with a smart dynamic lot, which depends on the load on the d
299 USD
Ylei SR Pro Trader
Johnrey Sarahina
Introducing Ylei SR Pro Trader – Your Premier Expert Advisor for Precision Trading with Support, Resistance, and Zigzag Analysis in the MetaTrader 5 Platform! Unlock the full potential of your trading strategy with Ylei SR Pro Trader, an advanced expert advisor meticulously crafted to leverage the power of support and resistance levels alongside the Zigzag indicator. Elevate your trading experience and optimize your profits with a sophisticated tool that seamlessly integrates advanced algorithms
300 USD
该产品的买家也购买
Quantum Trend Sniper
Bogdan Ion Puscasu
5 (28)
介绍   量子趋势狙击指标 ,突破性的 MQL5 指标,正在改变您识别和交易趋势反转的方式!由拥有超过13年交易经验的资深交易员团队开发,     量子趋势狙击指标   旨在通过其创新的方式以极高的准确度识别趋势反转,将您的交易之旅推向新的高度。 ***购买量子趋势狙击指标,即可免费获得量子突破指标!*** 当量子突破指标识别出趋势反转时,它会向您发出警报和信号箭头,并建议您三个止盈水平。 它既适合新手交易者,也适合专业交易者。 量子 EA 通道:       点击这里 MT4版本:       点击这里 建议: 时间范围: 所有时间范围。为了获得最佳结果,我们建议在 M15、M30 和 H1 时间范围内使用它。 货币对:欧元兑美元、英镑兑美元、澳元兑美元、欧元兑英镑、, EURAUD,  XAUUSD 账户类型:ECN、Raw 或 Razor,点差极低 经纪时间:任意 经纪商:IC Markets、Pepperstone with Raw 和 Razor 的点差最低 建议止损:50 点 建议止盈水平:20 点、50 点和
149.99 USD
Description: First of all Its worth emphasizing here that this Trading System is Non-Repainting, Non-Redrawing and Non-Lagging Indicator, Which makes it ideal from both manual and robot trading.  For limited time only 50% OFF, Now 149$ Next price 300$. The user manual in the form of detailed blog, free online course and downloadable presets of the smart trend trading system are all  here . Join our Free Group and stay up-to-date on the Best Indicators and Experts:   Here The “Smart Trend Tra
149 USD
RelicusRoad Pro MT5
Relicus LLC
4.81 (21)
现在$ 147(更新后增加到$ 499) - 无限帐户(PC或Mac) RelicusRoad 用户手册 + 培训视频 + 访问 Private Discord Group + VIP 身份 一种看待市场的新方式 RelicusRoad 是世界上最强大的外汇、期货、加密货币、股票和指数交易指标,为交易者提供保持盈利所需的所有信息和工具。我们提供技术分析和交易计划,帮助每一位交易者取得成功,从初学者到高级。它是一个关键的交易指标,可以提供足够的信息来预测未来的市场。我们相信一个完整的解决方案,而不是图表上几个没有意义的不同指标。这是一个多合一指标,显示无与伦比且非常准确的信号、箭头 + 价格行为信息。 RelicusRoad 基于强大的人工智能,提供缺失的信息和工具来教育您并使您成为交易专家,成为成功的交易者。 几乎所有技术指标都滞后,这意味着它们只能报告已经发生的事情。因此,他们只确认您过去可以看到的价格已经在哪里。我们相信领先指标可以预测未来价格,而无需重新绘制,也不要过度依赖可能改变并导致重新绘制的滞后指标。如果您根据滞后指标进行交易并建立头寸,您就知道您已
147 USD
TrendMaestro5
Stefano Frisetti
note: this indicator is for METATRADER4, if you want the version for METATRADER5 this is the link:  https://www.mql5.com/it/market/product/108106 TRENDMAESTRO recognizes a new TREND in the bud, he never makes mistakes. The certainty of identifying a new TREND is priceless. DESCRIPTION TRENDMAESTRO identifies a new TREND in the bud, this indicator examines the volatility, volumes and momentum to identify the moment in which there is an explosion of one or more of these data and therefore the mome
777 USD
Description: First of all Its worth emphasizing here that this Trading Tool is Non-Repainting, Non-Redrawing and Non-Lagging Indicator, Which makes it ideal for professional trading and expert advisers. For limited time only 40% OFF, Now 60$  Next price 100$. Attention , the application might not work in the strategy tester,    Try Demo here before you buy:   here . Get a detailed blog, free online course and learn more about the Smart Price Action Concepts  here . Join our Free Group and
60 USD
ICT, SMC, SMART MONEY CONCEPTS, SMART MONEY, Smart Money Concept, Support and Resistance, Trend Analysis, Price Action, Market Structure, Order Blocks, BOS/CHoCH,   Breaker Blocks ,  Momentum Shift,   Supply&Demand Zone/Order Blocks , Strong Imbalance,   HH/LL/HL/LH,    Fair Value Gap, FVG,  Premium  &   Discount   Zones, Fibonacci Retracement, OTE, Buy Side Liquidity, Sell Side Liquidity, BSL/SSL Taken, Equal Highs & Lows, MTF Dashboard, Multiple Time Frame, BigBar, HTF OB, HTF Market Structure
60 USD
FX Power MT5 NG
Daniel Stein
5 (4)
通过 mql5 和 Telegram 上 的晨间简报获取每日市场更新,包括详细信息和屏幕截图 ! FX Power MT5 NG 是我们长期以来非常受欢迎的货币强度计算器 FX Power 的下一代产品。 这款下一代强度计算器能提供什么?您所喜爱的原版 FX Power 的所有功能 附加功能 黄金/XAU 强度分析 更精确的计算结果 可单独配置的分析周期 可自定义计算限制,以获得更好的性能 为希望查看更多信息的用户提供特殊的多实例设置 无尽的图形设置,可在每个图表中设置您最喜欢的颜色 无数的通知选项,让您再也不会错过任何重要信息 采用 Windows 11 和 macOS 风格的全新圆角设计 神奇的移动指标面板 FX Power 主要功能 所有主要货币的完整强势历史 所有时间框架内的货币强弱历史 所有经纪商和图表的计算结果完全相同 100% 可靠的实时计算 -> 无重绘 可通过下拉列表选择分析时段 通过自定义模式单独配置分析时段 可在一个图表中使用多个实例 可移动 FX Power 显示屏(通过拖放) 适用于高分辨率 QHD、UHD 和 4K 显示器 自动终端配置 针对平板电脑
149 USD
Entry Points Pro for MT5
Yury Orlov
4.56 (154)
这款指标用于 MT5,可提供准确的入场交易信号,且无重绘。 它可应用在任何金融资产:外汇、加密货币、贵金属、股票、指数。 它将提供极其精准的评估,并告诉您何时开仓和平仓的最佳时机。 观看 视频 (6:22),其中包含一个仅处理单一信号的示例,该信号即可值回指标购价! 大多数交易者在 Entry Points Pro 指标的帮助下,在第一个交易周内即改善了他们的交易结果。 订阅我们的 Telegram 群 ! Entry Points Pro 指标的益处。 入场信号无重绘 如果信号出现,并得到确认,则它不会再消失;不像是重绘指标,它会导致重大的财产损失,因为它们可以在显示信号后再将其删除。 无差错开仓 指标算法可令您找到入场交易(买入或卖出资产)的理想时机,从而提高每位交易者的成功率。 Entry Points Pro 可操作任何资产 它允许您在 MT5 平台上交易任何经纪商的加密货币、股票、贵金属、指数、大宗商品和货币。 提供任何方向的信号 Entry Points Pro 指标提供针对任意价格走势的入场交易信号 - 上涨、下跌或横盘(横向)。
125 USD
Quantum Heiken Ashi PRO MT5
Bogdan Ion Puscasu
4.5 (8)
Quantum Heiken Ashi PRO 简介 Heiken Ashi 蜡烛旨在提供对市场趋势的清晰洞察,以其过滤噪音和消除虚假信号的能力而闻名。告别令人困惑的价格波动,迎接更流畅、更可靠的图表表示。 Quantum Heiken Ashi PRO 的真正独特之处在于其创新公式,它将传统烛台数据转换为易于阅读的彩色条。红色和绿色条分别优雅地突出了看跌和看涨趋势,让您能够以非凡的精度发现潜在的进入和退出点。 量子 EA 通道:       点击这里 MT4版本:       点击这里 这一卓越的指标具有以下几个关键优势: 增强清晰度:通过平滑价格波动,Heiken Ashi 金条可以更清晰地反映市场趋势,使您更容易识别有利的交易机会。 减少噪音:告别经常导致错误信号的不稳定价格变动。 Quantum Heiken Ashi 指标可过滤噪音,使您能够做出更明智的交易决策 无缝集成:Heiken Ashi 指标专为 MetaTrader 开发,可无缝集成到您的交易平台中。它用户友好、高度可定制,并且与您的其他交易指标和过滤器兼容 无论您是寻求新优势的经验丰富的交易者,
99.99 USD
介绍     Quantum Breakout PRO   ,突破性的 MQL5 指标,正在改变您交易突破区域的方式!由拥有超过13年交易经验的资深交易员团队开发,     量子突破 PRO     旨在通过其创新和动态的突破区域策略将您的交易之旅推向新的高度。 量子突破指标将为您提供带有 5 个利润目标区域的突破区域的信号箭头,以及基于突破框的止损建议。 它既适合新手交易者,也适合专业交易者。 量子 EA 通道:       点击这里 重要的!购买后请私信我领取安装手册。 建议: 时间范围:M15 货币对:GBPJPY、EURJPY、USDJPY、NZDUSD、XAUUSD 账户类型:ECN、Raw 或 Razor,点差极低 经纪商时间:GMT +3 经纪商:IC Markets、Pepperstone with Raw 和 Razor 的点差最低 规格: 不重漆! 最多 5 个建议利润目标区域 建议止损水平 可定制的盒子。您可以设置自己的 Box Time Start 和 Box Time End。 接触 如果您有任何疑问或需要帮
149.99 USD
Golden Gate Algo MT5
James David Lane
4.6 (5)
40% 圣诞优惠!价格将于1月1日涨至$250! 推出GoldenGate Entries:前沿交易解决方案! 发现与GoldenGate Entries(GGE)一同进行交易的革命性方法,这是一款设计用于提升您交易体验的先进指标。GGE提供了一套全面的功能,以赋予用户在交易决策中的精准和信心。 交易对:任意(外汇 - 商品 - 股票 - 股票 - 加密货币) 时间框架:15分钟至H1 主要特点: 买入和卖出箭头指示:接收伴随弹出警报的买入和卖出箭头指示,确保您随时保持了解。 GoldenGate_Algo:通过GoldenGate_Algo深入了解市场状况,这是一款强大的工具,用于评估市场是否处于“超卖”或“超买”状态。 当前趋势分析:通过访问您正在查看的时间框架上的当前趋势,保持领先地位,使您能够将交易与市场当前方向对齐。 内置枢轴点:使用内置的枢轴点轻松识别关键市场点,提供有价值的支撑和阻力水平。 蜡烛扫描器:分析蜡烛形态和图案,找到最佳的入场点并过滤掉低概率的入场。 完全定制:通过完整的定制选项,完全掌控您的交易体验,允许您个性化从
149 USD
FX Volume MT5
Daniel Stein
4.94 (16)
通过 mql5 和 Telegram 上 的 " 晨间简报 "获取每日市场更新,包括详细信息和屏幕截图 ! 外汇交易量(FX Volume)是第一个也是唯一一个从经纪商角度真正洞察市场情绪的交易量指标。 直接在您的图表上看到这些信息是真正改变游戏规则和突破性的交易解决方案。 受益于独特的市场数据洞察,如 比率(Ratios )显示货币多头和空头头寸的比率(百分比 比率变化 显示所选时间段内的多头比率及其百分比变化 总交易量 显示货币的总交易量(多头和空头),以手为单位 多头 交易量显示货币所有多头头寸的交易量 空头 交易量显示所有货币空头头寸的交易量 净多头 显示净多头交易量,即所有多头头寸减去所有空头头寸(以手为单位)。 净多头百分比 显示货币净多头交易量的变化 请阅读我们的基本教程 -> "如何使用外汇交易量进行交易 " 获取更多信息,如常见问题、交易技巧和教程视频,请访问我们的 外汇交易量公共信息频道 请 安装并运行 SI Connect 以建立与我们数据中心的持续连接 背景信息 我们都知道,外汇是一个分散的市场。这就是为什么我们必须打破常规思维,开发一个独
229 USD
PZ Swing Trading MT5
PZ TRADING SLU
5 (4)
Swing Trading 是第一个旨在检测趋势方向的波动和可能的反转波动的指标。它使用在交易文献中广泛描述的基准摆动交易方法。该指标研究多个价格和时间向量,以追踪总体趋势方向,并检测市场超卖或超买并准备好进行修正的情况。 [ 安装指南 | 更新指南 | 故障排除 | 常见问题 | 所有产品 ] 市场波动的利润不会被窃取 指示器始终显示趋势方向 彩色价格带代表机会基准 彩色虚线表示可能的反转波动 该指标分析其自身的质量和性能 它实现了一个多时间仪表板 可定制的趋势和波动周期 它实现了电子邮件/声音/推送警报 指示器为非重涂或重涂 什么是摇摆交易 摇摆交易是一种尝试在一天到一周内从证券中获得收益的交易方式,尽管某些交易最终可以保持更长的寿命。摇摆交易者使用技术分析来买入弱点和卖出力量,并有耐心等待这些机会的发生,因为在发生一波抛售浪潮之后购买证券而不是陷入抛售更有意义。 机会基准 关于历史数据的大量研究证明,适合于波动交易的市场倾向于在基线价格带上下交易,基线价格带由图表显示,使用平均真实区间计算得出。波动交易者使用基线,该策略是购买常态和卖出躁狂,或做空常态并掩盖沮丧。
249 USD
Step into the realm of Forex trading with confidence and precision using XQ, a cutting-edge Forex indicator designed to elevate your trading game to unprecedented heights. Whether you're a seasoned trader or just stepping into the world of currency exchange, XQ Forex Indicator empowers you with the insights and signals needed to make informed trading decisions. The signal conditions are a combination of three indicators, and XQ Forex Indicator only display  medium and long-term trends . The ind
199 USD
Owl Smart Levels MT5
Sergey Ermolov
4.46 (35)
MT4版本  |   FAQ Owl Smart Levels Indicator 是一個完整的交易系統,包含 Bill Williams 的高級分形、構建正確的市場波浪結構的 Valable ZigZag 以及標記準確入場水平的斐波那契水平等流行的市場分析工具 進入市場和地方獲利。 策略的详细说明 指示灯使用说明 顾问-贸易猫头鹰助手助理 私人用户聊天 ->购买后写信给我,我会将您添加到私人聊天中,您可以在那里下载所有奖金 力量在於簡單! Owl Smart Levels 交易系統非常易於使用,因此適合專業人士和剛開始研究市場並為自己選擇交易策略的人。 策略和指標中沒有隱藏的秘密公式和計算方法,所有策略指標都是公開的。 Owl Smart Levels 允許您快速查看進入交易的信號,突出顯示下訂單的水平並向您發送有關已出現信號的通知。 優點很明顯: 清楚地顯示主要和更高時間框架的趨勢方向。 指示儀器信號的出現。 標記開單、止損設置和固定利潤的水平。 沒有多餘的,只有必要的結構! ZigZag 表示全球趨勢的方向,因此也表示貿易方向。 市場反轉點的短線清楚地表明在什麼水平上構建斐波
97 USD
Blahtech Supply Demand MT5
Blahtech Limited
4.57 (14)
Was: $299  Now: $99   Supply Demand uses previous price action to identify potential imbalances between buyers and sellers. The key is to identify the better odds zones, not just the untouched ones. Blahtech Supply Demand indicator delivers functionality previously unavailable on any trading platform. This 4-in-1 indicator not only highlights the higher probability zones using a multi-criteria strength engine, but also combines it with multi-timeframe trend analysis, previously confirmed swings
99 USD
TPA True Price Action indicator reveals the true price action of the market makers through 100% non-repainting signals strictly at the close of a candle! TPA shows entries and re-entries, every time the bulls are definitely stronger than the bears and vice versa. Not to confuse with red/green candles. The shift of power gets confirmed at the earliest stage and is ONE exit strategy of several. There are available now two free parts of the TPA User Guide for our customers. The first "The Basics"
168 USD
IX Power MT5
Daniel Stein
IX Power 终于将 FX Power 的无与伦比的精确性带到了非外汇交易符号中。 它能准确判断您喜爱的指数、股票、商品、ETF 甚至加密货币的短期、中期和长期趋势强度。 您可以 分析 终端提供的 一切 。试试吧,体验一下您在交易时如何把握 时机 。 IX Power 主要功能 100% 精确的非重绘计算结果 - 适用于您终端中的所有交易符号 下拉式选择预配置以及可单独配置的强度分析周期 通过电子邮件、消息和手机通知的无数种通知选项 可访问的 EA 请求缓冲区 可自定义计算限制,以获得更好的性能 为希望查看更多信息的用户提供特殊的多实例设置 无尽的图形设置,让您在每个图表中都能找到最喜欢的颜色 采用 Windows 11 和 macOS 风格的圆角新面板设计 神奇的移动指标面板,可在子窗口和主图表之间无缝移动 适用于高分辨率 QHD、UHD 和 4K 显示器,并针对平板电脑和触摸屏进行了优化 IX Power 参数 最重要的参数不言自明,但我们很快会在另一篇文章中为您提供所有 IX Power 参数的完整说明。 使用别名 "参数可为技术交易符号
89 USD
Volume by Price MT5
Brian Collard
5 (3)
Was: $259 Now: $120 — The Volume by Price Indicator for MetaTrader 5 features Volume Profile and Market Profile TPO (Time Price Opportunity). Get valuable insights out of currencies, equities and commodities data. Gain an edge trading financial markets. Volume and TPO histogram bar and line charts. Volume Footprint charts. TPO letter and block marker charts including split structures. Versatile segmentation and compositing methods. Static, dynamic and flexible ranges with relative and/or absolu
120 USD
TPSpro RFI Levels MT5
Roman Podpora
5 (4)
Reversal First Impulse levels (RFI)   - are the   maximum volume   levels/areas that turn the market around, so they play a critical role in future trading decisions. The logic behind the movement of any chart is that the price moves from the first impulse level (RFI) to the first impulse level (RFI) of the past trend. The first impulse level (RFI) is the most powerful level during a trend reversal, which forms a reversal zone. The first impulse level from the reversal of the previous movement
145 USD
Gann 方块指标是一种强大的市场分析工具,基于 W.D. Gann 在其“市场预测数学公式”一文中介绍的数学概念。该指标融合了与平方数(如 144、90 和 52)有关的 Gann 技术,以及平方 9。此外,它还融入了  关于如何将平方 9 与通道和星形图案结合使用的方法。 用户手册和使用方式: 在使用该指标之前,我们建议您阅读用户手册,并与我们联系以获得任何澄清。您可以在我们的网站上找到完整的用户手册。 该指标提供了 MT5 的完整版本供购买,也提供了 MT4 的免费版本供测试。提供了两个版本的链接供您方便使用。 主要特点和功能: Gann 方块指标为您的交易环境提供了全套工具,使您能够基于几何图案和 Gann 的概念做出明智的决策。以下是主要特点: 平方 9 分析:   该指标可以绘制与平方 9 有关的各种元素,包括水平线、星形图案、网格、Gann 扇形等。这在您的图表上提供了 Gann 的几何概念的视觉表示。 Gann 方块:   该指标绘制了 Gann 方块 52、90 和 144,使您能够可视化和分析它们与价格走势的关系。 自由 Gann 星形图案:   该指标使您能够直接
200 USD
Price Action Finder Multi MT5
Siarhei Vashchylka
5 (3)
The Price Action Finder Multi indicator is an indicator of entry points that searches for and displays Price Action system patterns on dozens of trading instruments and on all standard time frames: (m1, m5, m15, m30, H1, H4, D1, Wk, Mn). The indicator places the found patterns in a table at the bottom of the screen. By clicking on the pattern names in the table, you can move to the chart where this pattern is located. Manual (Be sure to read before purchasing) | Version for MT4 Advantages 1. Pa
149 USD
Advanced Supply Demand MT5
Bernhard Schweigert
4.53 (15)
任何新手或专业交易者的最佳解决方案! 该指标是一款独特、高质量、且价格合理的交易工具,因为我们已经整合了许多专有功能和新公式。 依据此更新,您将能够显示双重时间帧区域。 您不仅可以显示一个较高的时间帧,还可以同时显示图表时间帧,加上更高的时间帧:显示嵌套时区。 供需双方所有交易者都会喜欢它。 :) 重要信息披露 高级供需的最大潜力,请访问 https://www.mql5.com/zh/blogs/post/720245   想象您的交易如何得以改善,是因为您能够精准定位入场或目标位吗? 构建于新的底层算法,它可以更轻松地识别出买卖双方之间的潜在失衡。 这是因为它以图形方式展示供需最强劲区域,及其过去的表现(显示旧区域)。 这些功能旨在帮助您更轻松地发现最佳入场区域和价位。 现在您可以针对您的交易品种和时间帧来优化和编辑区域强度! 高级供需指标适用于所有产品和时间帧。 它是一个新的公式,非常新的功能是两个区域强度函数可由用户输入进行调整! 这在交易中是一大优势。 当您学习如何使用专有功能,例如带有价格游离最小 X 因子的区域强度时,您能够判断该区域强劲与否。 供需区域用作警报触发器
199 USD
Bill Williams Advanced
Siarhei Vashchylka
5 (2)
Bill Williams Advanced is designed for automatic chart analysis using Bill Williams' "Profitunity" system. The indicator analyzes four timeframes at once. Manual (Be sure to read before purchasing) Advantages 1. Automatically analyzes the chart using the "Profitunity" system of Bill Williams. The found signals are placed in a table in the corner of the screen. 2. Equipped with a trend filter based on the Alligator indicator. Most of the system signals are recommended to be used only accordi
299 USD
This indicator provides the ability to recognize the SMC pattern, essentially a condensed version of the Wyckoff model. Once the pattern is confirmed by RTO, it represents a significant investment opportunity.  There are numerous indicators related to SMC beyond the market, but this is the first indicator to leverage patterns to identify specific actions of BigBoy to  navigate the market. The SMC (Smart Money Concept) pattern is a market analysis method used to understand the behavior of "smart
79 USD
Matrix Arrow Indicator MT5
Juvenille Emperor Limited
5 (14)
矩阵箭头指标 MT5   是一种独特的 10 合 1 趋势,遵循   100% 非重绘多时间框架指标 ,可用于所有符号/工具: 外汇 、 商品 、 加密货币 、 指数 、 股票 。 Matrix Arrow Indicator MT5 将在其早期阶段确定当前趋势,从多达 10 个标准指标中收集信息和数据,它们是: 平均定向运动指数 (ADX) 商品渠道指数 (CCI) 经典 Heiken Ashi 蜡烛 移动平均线 移动平均收敛散度 (MACD) 相对活力指数 (RVI) 相对强弱指数 (RSI) 抛物线SAR 随机振荡器 威廉姆斯的百分比范围 当所有指标给出有效的买入或卖出信号时,相应的箭头将打印在图表上,在下一根蜡烛/柱线开盘时,指示强劲的上升趋势/下降趋势。用户可以选择使用哪些指标,并可以单独调整每个指标的参数。 Matrix Arrow Indicator MT5 仅从选定的指标中收集信息,并仅根据其数据打印箭头。   Matrix Arrow Indicator MT5   还可以为所有新信号发送终端、推送通知或电子邮件警报。无论您是黄牛、日内交易者还是波段交易者, Mat
75 USD
Gold TMAF MTF - 这是一个最佳股票技术指标。该指标算法分析资产的价格走势,并反映波动性和潜在进入区域。 最佳指标信号: - 卖出 = TMA2 的红色上边界高于 TMA1 的红色上边界 + 上方的红色分形指标 + 同方向的黄色 SR 信号箭头。 - 买入 = TMA2 的蓝色下边界低于 TMA1 的蓝色下边界 + 下方的蓝色分形指标 + 同方向的水蓝色 SR 信号箭头。 该指标的优点 1. 指标产生的信号精确度高。 2. 确认的箭头信号不会重绘,分形信号可以重绘半个周期。 3. 您可以在任何经纪商的 MetaTrader 5 交易平台上进行交易。 4. 您可以交易任何资产(货币、金属、加密货币、股票、指数等)。 5. 最好在 M30-H1 时间框架(中期交易)上进行交易。 6. 在指标设置中可更改个别参数(TF、颜色等),以便每位交易者都能轻松定制适合自己的指标。 7. 该指标既可作为交易系统的主要补充,也可作为独立的交易系统使用。 注意:交易的入市准确性和盈利能力仅取决于交易者的技能。任何指标都只是交易者的助手,而非行动指南。
99 USD
该指标通过忽略突然的波动和市场噪音,以无与伦比的可靠性跟踪市场趋势。它被设计用于趋势交易日内图表和较小的时间范围。其获胜率约为85%。 [ 安装指南 | 更新指南 | 故障排除 | 常见问题 | 所有产品 ] 极易交易 查找超卖/超买情况 随时享受无噪音交易 避免在盘中图表中被鞭打 该指标分析其自身的质量和性能 它实现了一个多时间仪表板 该指标适用于低时限交易,因为它通过降低平均价格周围的市场噪音而忽略了突然的价格飙升或修正。 该指标根本不需要优化 它实现了一个多时间仪表板 它实现了电子邮件/声音/推送警报 指示器为不可重涂和不可重涂 该指标实现了适合于较小时间范围的趋势跟踪方向,该趋势可以渗透到较高时间范围内的非常长的趋势中,从而扩大了您的收益。 指标剖析 指标显示一条彩色的线,周围环绕着一个价格带。彩色线是有价证券的平均价格,而价格带表示超买/超卖水平。如果平均价格为蓝色,则您应该在市场没有超买的情况下寻找多头交易;如果平均价格为红色,则应该在市场没有超卖的情况下寻找空头交易。 指标的趋势变化并不表示立即进行交易或完成相反交易的信号!这些频段用于计时。 技术信息 指
99 USD
本指标是实践实战交易完善的波浪自动分析的指标 ! 黄金实战 案例... 注:波浪分级用西方叫法不习惯,因 受到缠论(缠中说禅)命名方式习惯的影响,我是将基础波浪命名为 笔 , 将二级波段命名为 段 , 同时具有趋势方向的段命名为 主趋段 (以后笔记中都是这种命名方式,先告知大家),但是算法上和缠论关系不大切勿混淆.反映的是本人分析盘面总结的 千变万化纷繁复杂的运行规律 . 对波段进行了标准化定义,不再是不同人不同的浪 , 对人为干扰的画法进行了排除 , 在严格分析进场起到了关键的作用 . 指标内容 1.   基础波浪(笔): 首先我们找出了价格波动过程中的基础波动拐点,当然他的有序性还不算太强,为下一步的计算提供基础 . 2.   二级波段(段) :在基础波浪的基础上,通过算法分析得到层级更明显的二级波段,二级波段为波浪提供了分析基础 3.   波浪(浪): 有着更清晰的趋势,更清晰直观的方向.分析一个波浪是否延续,需要看二级波段的形态,分析二级的构成,可以得出波浪后续的预测. 4.   通道: 通道计算采用了线性回归的方式进行计算. 5.   回撤: 波浪中的两个重要回撤会在每个
188 USD
作者的更多信息
Angulation
Alexey Topounov
According to Bill Williams' trading strategy described in the book "Trading Chaos: Maximize Profits with Proven Technical Techniques" the indicator displays the following items in a price chart: 1.Bearish and bullish divergent bars: Bearish divergent bar is colored in red or pink (red is a stronger signal). Bullish divergent bar is colored in blue or light blue color (blue is a stronger signal). 2. "Angulation" formation with deviation speed evaluation. 3. The level for placing a pending order (
87 USD
Reverse Bar
Alexey Topounov
The Reverse Bar indicator paints the reversal bars according to trade strategy, described by Bill Williams in "Trading Chaos. Maximize Profits with Proven Technical Techniques" book. The bearish reversal bar has red or pink color (red-stronger signal) The bullish reversal bar has blue or light blue color(blue - stronger signal) It is recommended to use it on hourly timeframe (H1) and higher.
57 USD
Pin Bar
Alexey Topounov
This indicator shows Pin Bar candlestick pattern on the chart. The bearish pin bars have red color, the bullish pin bars have blue color. The indicator shows alert when Pin Bar candlestick pattern is formed. It's recommended to use it at timeframes H1 and higher. The best moment (strong signal) is when Pin Bar is formed close to the support/resistance level.
55 USD
Soldiers Crows
Alexey Topounov
5 (1)
The indicator displays the "Three white soldiers and Three black crows" candlestick model on a chart. Three white soldiers are color in blue. Three black crows are colored in red. Input parameters: Max Bars - maximum number of bars calculated on the chart. Make Signal Alert - use alert. Type of pattern rules - use a strict model of determining the pattern (short lower shadows for the three soldiers, short upper shadows for the three crows), or a simplified model. Max Shadow Ratio - coefficient o
30 USD
The indicator displays the "Morning star" and "Evening star" patterns on a chart. The Evening star is displayed in red or rose. The Morning star is displayed in blue or light blue. Input Parameters: Max Bars – number of bars calculated on the chart. Make Signal Alert – use alerts. Send Push Notification - send notification to a mobile terminal Type of rules pattern – type of the model of pattern determination (Hard – with the control of length of shadows of the second bar). If Soft is select
40 USD
HL D1 Move
Alexey Topounov
The indicator displays the dynamics of forming the daily range in the form of a histogram, and the average daily range for a specified period. The indicator is a useful auxiliary tool for intraday trades. Settings N Day - period for calculation of the daily range value. Level Indefinite - level of indefiniteness. Level Confidence - level of confidence. Level Alert - alert level. When it is crossed, the alert appears.
30 USD
Synthetic Reverse Bar is an evolution of Reverse Bar indicator. It is well-known that candlestick patterns work best at higher timeframes (H1, H4). However, candlesticks at such timeframes may form differently at different brokers due to dissimilarities in the terminal time on the single symbol, while the history of quotes on M1 and M5 remains the same! As a result, successful patterns are often not formed at higher timeframes! Synthetic Reverse Bar solves that problem! The indicator works on M5
50 USD
Bullish Bearish Volume is an indicator that divides the volume into the bearish and the bullish part according to VSA: Bullish volume is a volume growing during upward motion and a volume falling during downward motion. Bearish volume is a volume growing during downward motion and a volume falling during upward motion. For a higher obviousness it uses smoothing using MA of a small period. Settings: MaxBars – number of bars calculated on the chart; Method – smoothing mode (Simple is most preferab
40 USD
Trading Sessions Pro is a trading session indicator with extended settings + the ability to install and display the custom period. Main Advantages: The indicator allows you to conveniently manage display of trading sessions on the chart. There is no need to enter the settings each time. Just click the necessary trading session in the lower window and it is highlighted by the rectangle on the chart! The indicator has two modes of defining the trading terminal's time offset relative to UTC (GMT)
45 USD
VWAP Universal
Alexey Topounov
VWAP 是交易量权重平均价格。它计算产品的价格与交易量之和,再除以总的交易量。 这个版本的指标是通用版,它有三种操作模式: 移动 - 在此模式下指标工作如同移动均线。但不同于普通的 SMA,它在大的走势里滞后很小!带状方差可以如同布林带一样使用。 周期 - 在此模式下,计算从周期的开始至结束的累计 (在每根柱线, 计算整个周期从开始时的数值, 所以它包含所有从周期开始的数值)。这个带状方差产生高品质的支撑和阻力级别。 定时器 - 在此模式下,计算类似于 "周期" 模式。不同之处在于,周期的开始和结束可以手工设置。此模式中的最大周期可以超过 24 小时。 设置: Max Bars - 图表上计算的柱线数量 (0 - 所有可用历史)。 Use Mode - 模式选择。3 种模式可用: 移动, 周期, 定时器。 Applied Price - 价格类型。 Applied Volume - 交易量类型 (即时报价或存在的实际量)。 Set Moving Mode - 设置为 "Moving" 模式。 Moving Period - "Moving" 模式的计算周期。 Set Period
57 USD
Divergence MACD
Alexey Topounov
Divergence MACD indicator shows price and MACD indicator divergence. The indicator is not redrawn! The algorithm for detection of price and MACD extremums has been balanced for the earliest entry allowing you to use the smallest SL order possible. The indicator displays all types of divergences including the hidden one, while having the minimum number of settings. Find out more about the divergence types in Comments tab. Launch settings: Max Bars - number of bars calculated on the chart. Indent
50 USD
Hurst Fractal Index Фрактальный Индекс Херста -  показатель персистентности временного ряда При значении индикатора >0.5 временной ряд считается персистентным (тенденция сохраняется) При значениях индикатора явно < 0.5 временной ряд считается антиперсистентным (возможна смена направления движения) Для наглядности значения индекса усредняются периодом 2-3. Настройки индикатора: Max Bars -  глубина истории расчета (кол-во баров на графике для которых произведён расчет) Data from Timeframe - исполь
30 USD
筛选:
无评论
回复评论