Shepherd Gann Squares MT5
- 指标
- Abdullah Alrai
- 版本: 3.2
- 更新: 22 二月 2022
- 激活: 5
該指標是一種市場分析方法,基於 W.D. Gann 撰寫的“市場預測的數學公式”文章,根據 9 的平方和 144 的平方方法。
用戶手冊:
Add Your review And contact us to get it
您可以從以下位置購買完整的 MT4 版本:
您可以免費在 MT4 上進行測試:
https://www.mql5.com/en/market/product/15320?source=Site+Profile+Seller#!tab=reviews
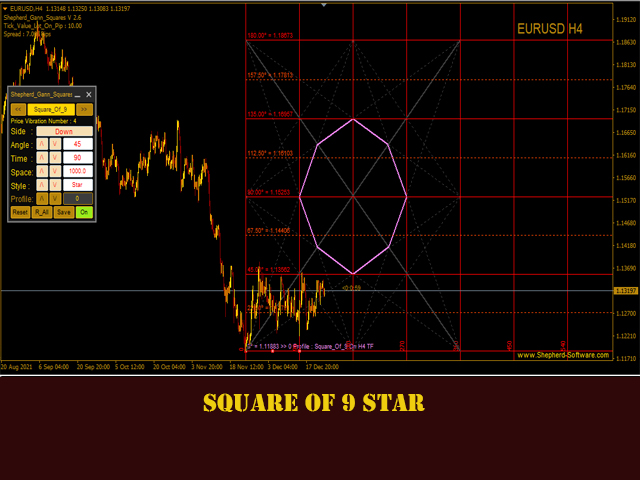
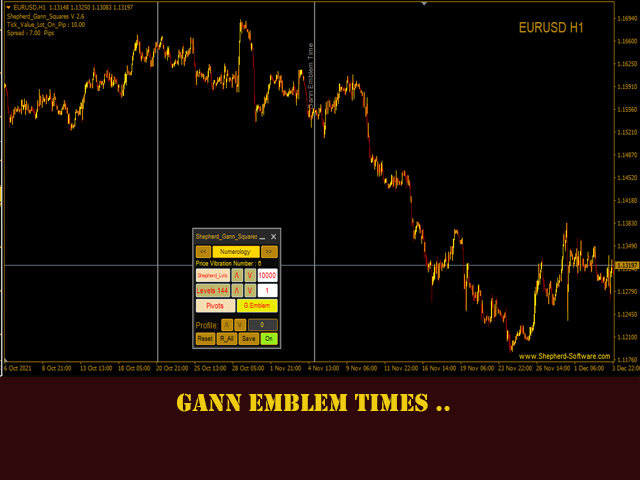
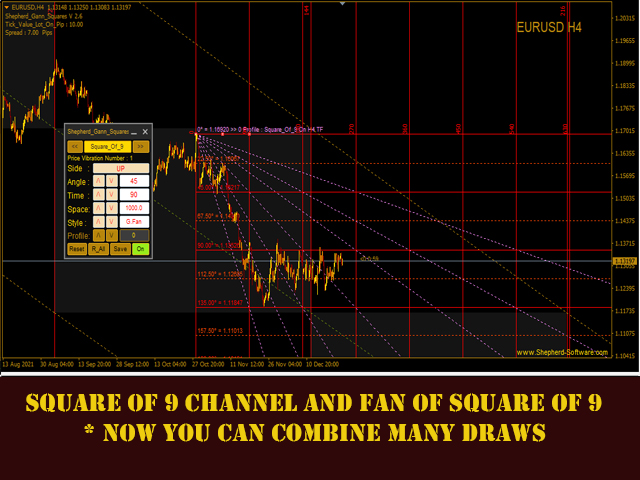
本產品可以為您繪製 9 的正方形作為級別 / 星星 / 網格 / 江恩迷 / 。
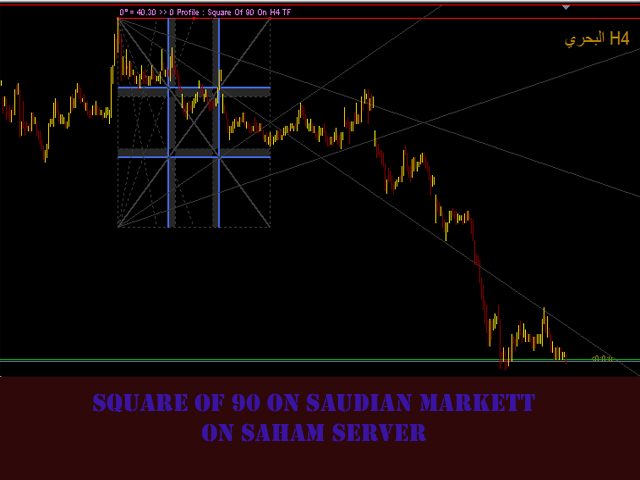
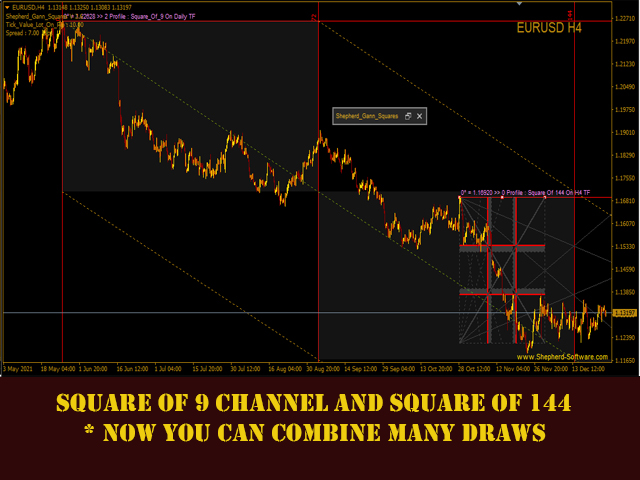
它還將繪製江恩平方:52 / 90 /144。
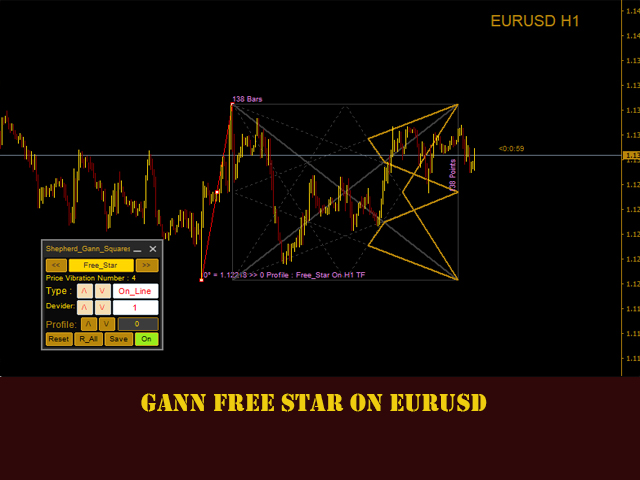
它將直接在圖表上繪製可移動的自由江恩星。
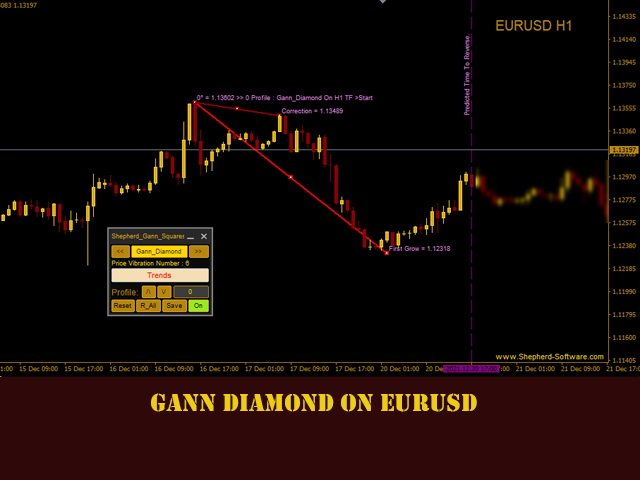
它也將繪製江恩菱形。
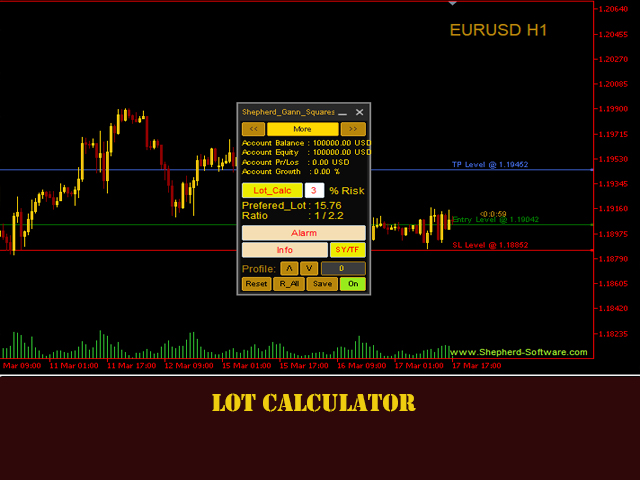
它有很多計算器,讓您能夠為您的條目計算最佳手數。
指標有一個面板,它允許您:
在 144/90/52 方格/9 方格/江恩自由星/江恩鑽石/命理工具/手數計算器和帳戶信息之間移動。
指標將保存您在配置文件上的所有工作,您可以隨時加載和卸載它。
您可以在按下按鈕時重置所有保存的數據。
對於從事威廉·江恩分析和命理學工作的分析人員來說,該產品是最重要的工具之一。
觀看視頻並從我們的網站閱讀我們的 PDF 以了解如何使用它並了解這裡的情況。
參數
Shepherd_Gann_Squares - 只是標題。
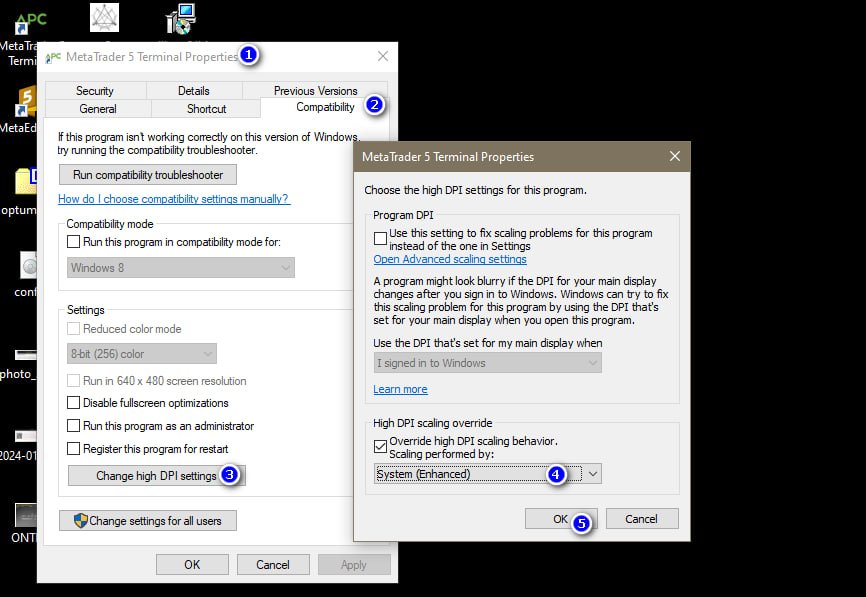
Use_System_Theme - 選擇主題風格
Show_Last_Candle_Counter - 啟用/禁用蠟燭計數器。
Rotation_Counts - 1 Rotation = 360 度在這裡選擇要繪製多少個循環,
Angles_Font_Size - 設置角度字體大小。
Main_Angles_Color - 設置主角度顏色。
Main_Angles_Style - 設置主角度樣式。
Main_Angles_Width - 設置主角寬度。
Sub_Angles_Color - 設置子角度顏色。
Sub_Line_Width - 設置子角寬度。
Sub_Line_Style - 設置子角度樣式。
Time_Separator_Color - 設置時間分隔符顏色。
Channel_Rec_Color - 設置通道矩形顏色。
Channel_Color - 設置通道線顏色。
Channel_Style - 設置通道線寬度。
Star_Color - 為 9 星和自由星的方格設置星的顏色。
Star_Style - 為 9 星和自由星的方格設置星型。
Star_Core_Style - 如果填充或未填充,則設置星形核心樣式。
Star_Core_Color - 設置星核顏色。
Gann_Fan_Color - 設置江恩扇形線顏色。
Gann_Fan_Style - 設置江恩扇形線條樣式。
Gann_Fan_Width - 設置江恩扇形線的寬度。
Gann_Square_Color - 設置江恩方塊 144/90/52 線顏色。
Gann_Square_Style - 設置江恩正方形 144/90/52 線條樣式。
Gann_Square_Width - 設置江恩正方形 144/90/52 線寬。
Gann_Squares_More_Fans - 設置江恩正方形 144/90/52,當您按下面板中的風扇按鈕時查看更多風扇。
Gann_Square_Fans - 設置江恩方塊 144/90/52 風扇顏色。
Shepherd_Levels_Color - 設置江恩方塊 144/90/52 級顏色。
Shepherd_Levels_Style - 設置江恩方塊 144/90/52 級樣式。
Shepherd_Levels_Width - 設置江恩正方形 144/90/52 級寬度。
Shepherd_Levels144_Color - 設置 144 線顏色的江恩水平。
Shepherd_Levels144_Style - 設置 144 線樣式的江恩水平。
Shepherd_Levels144_Width - 設置 144 線寬的江恩水平。
Pivots_TF - 設置 Pivots 時間範圍。
Position_Of_Right_Prices - 設置角度值的文本位置。
Save_On_All_Platforms - 如果您激活它,您將加載您在所有平台上保存的內容。
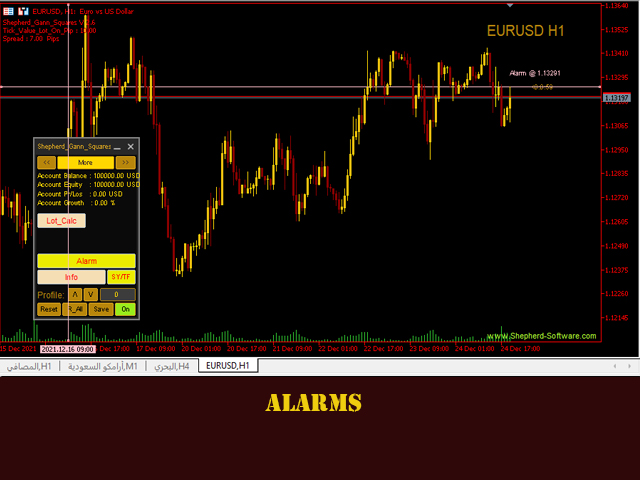
警報 - 啟用/禁用警報警報。
Push_Notifications - 啟用/禁用警報推送通知。


سهم تهامة لايشتغل معي خاصية styie