PZ Divergence Trading
- 指标
- PZ TRADING SLU
- 版本: 13.0
- 更新: 18 五月 2021
- 激活: 20
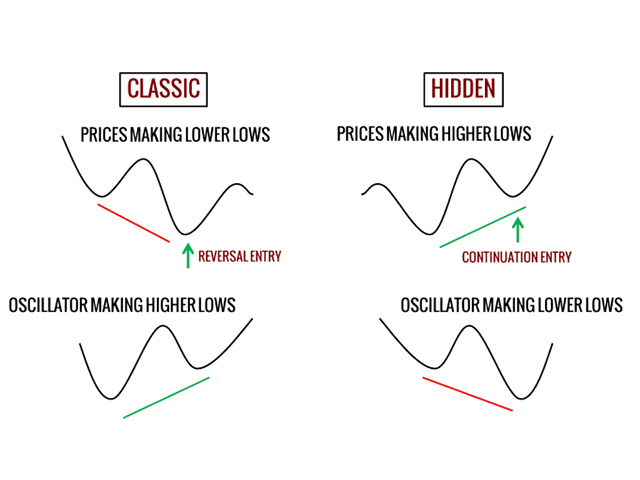
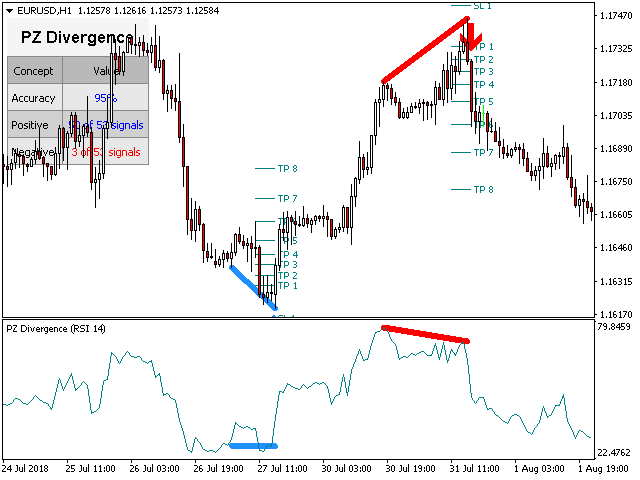
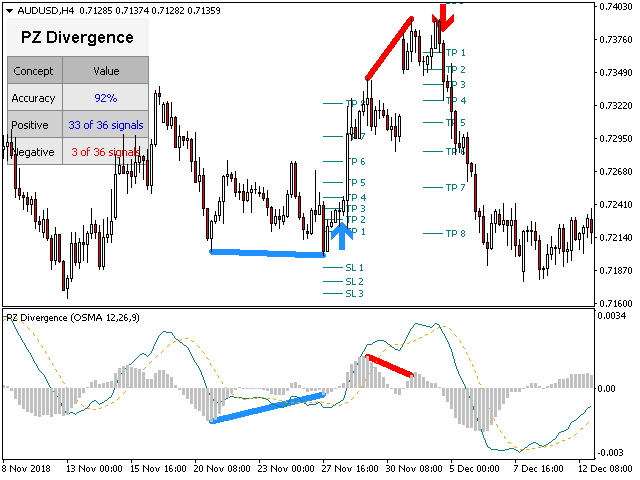
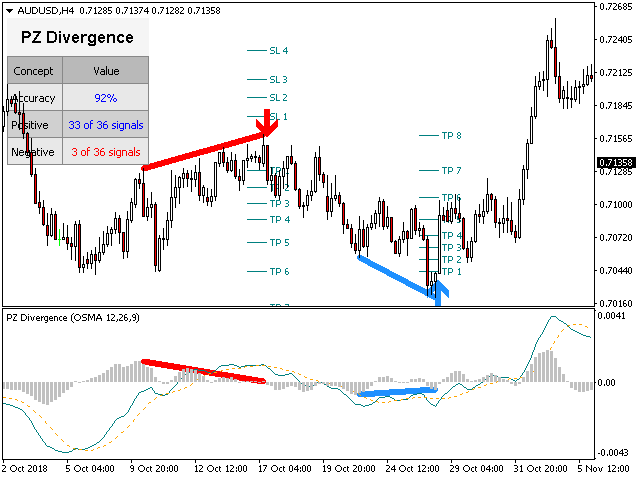
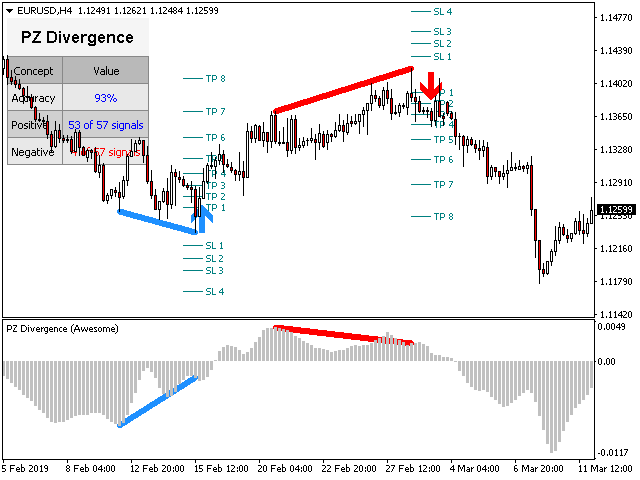
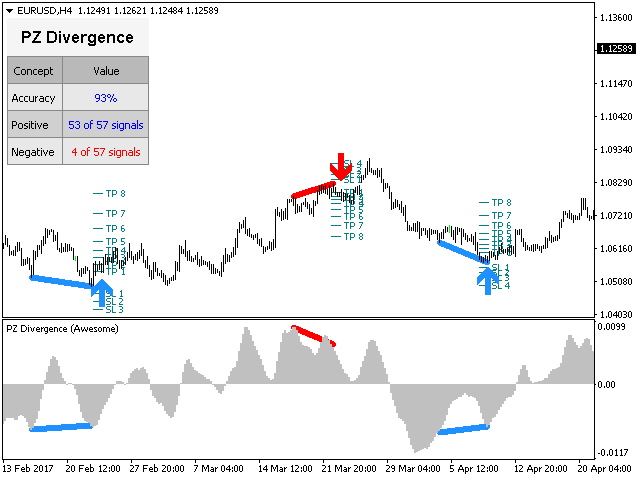
棘手的发现和频率稀缺是最可靠的交易方案之一。该指标使用您喜欢的振荡器自动查找并扫描常规和隐藏的发散。
[ 安装指南 | 更新指南 | 故障排除 | 常见问题 | 所有产品 ]
- 容易交易
- 发现常规和隐藏的分歧
- 支持许多知名的振荡器
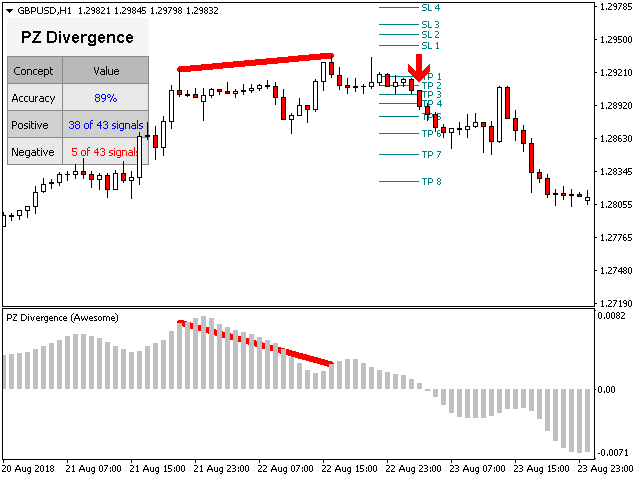
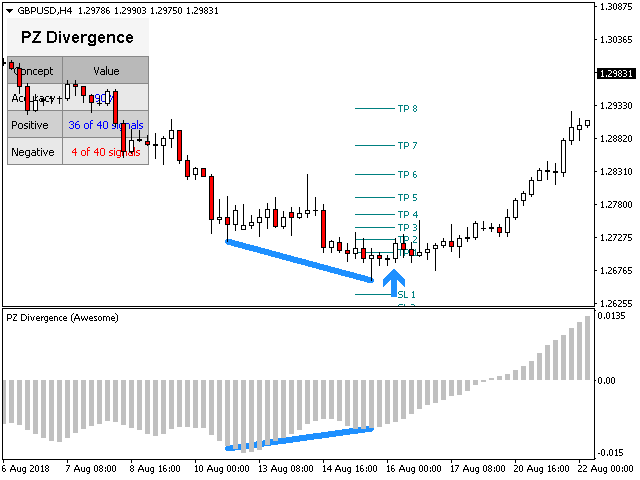
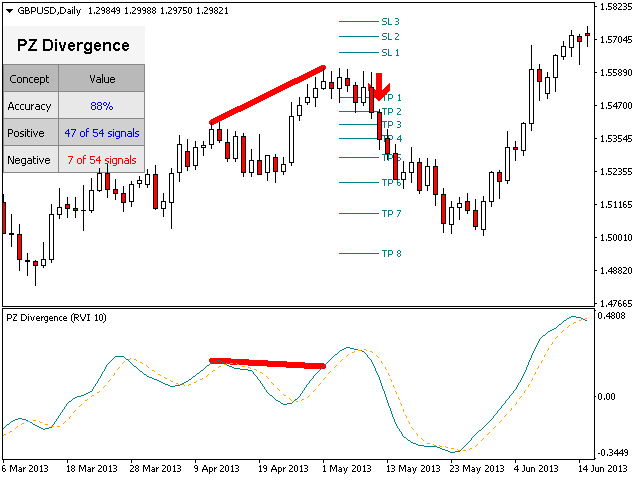
- 根据突破实现交易信号
- 显示适当的止损和获利水平
- 可配置的振荡器参数
- 可自定义的颜色和尺寸
- 按条形过滤大小差异
- 实现绩效统计
- 它实现了电子邮件/声音/视觉警报
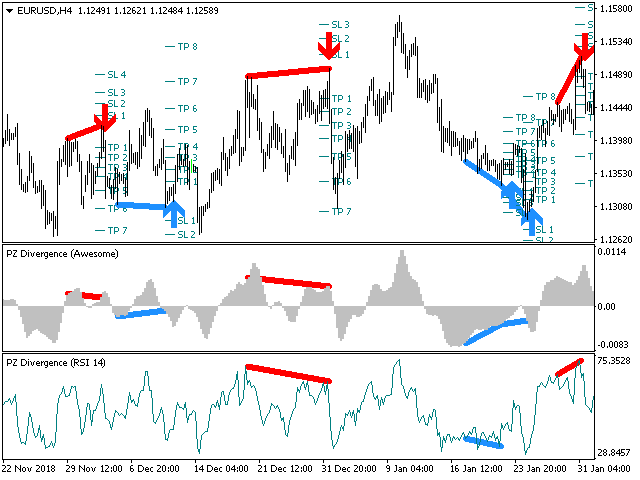
为了提供广阔的市场前景,可以使用不同的振荡器在同一张图表中多次加载该指标,而不会产生干扰。该指标支持以下振荡器:
- RSI
- CCI
- MACD
- OSMA
- 随机
- 动量
- 很棒的振荡器
- 加速器振荡器
- 威廉姆斯百分比范围
- 相对活力指数
由于差异可能会扩大很多,尤其是在外汇市场中,因此该指标产生了转折:它在等待交易突破之前等待donchian突破确认差异。最终结果是带有非常可靠的交易信号的重新粉刷指示器。
输入参数
- 幅度:用于寻找差异的之字形周期
- 振荡器-选择要加载到图表的振荡器。
- 突破期-交易信号的突破期,以柱为单位。
- 发散类型-启用或禁用发散类型:隐藏,常规或两者。
- 最小散度单位为条形-最小散度单位为条形,以显示散度。
- 最大发散尺寸(以条为单位)-显示的发散最大尺寸(以条为单位)。
- 最大。历史柱线-指标加载时评估的柱线数量。
- 指标设置-所有相关振荡器的所需指标设置。
- RSI时期
- CCI期
- WPR期间
- 动量期
- 随机时期
- MACD设置
- RVI期
- 图纸设置-选择散度的颜色和线大小。
- 警报-启用或禁用各种警报,以及设置自定义警报文本。
作者
ArturoLópezPérez,私人投资者和投机者,软件工程师,零零点交易解决方案的创始人。


I would highly recommend this to anyone who uses divergence in their trading. It's not perfect but this indicator does have some versatility along with some limitations. It does repaint but you need to understand divergence is a process generally not a single candle. I have had the best success using the Zig Zag setting on 8, then waiting for a candle to close across the 15 EMA for confirmation the price is going in the right direction. You may also want to combine divergence with support and resistance and overbought oversold for more confluence.