• 概述
  • 评论 (5)
  • 评论 (1)
  • 新特性

Quick response

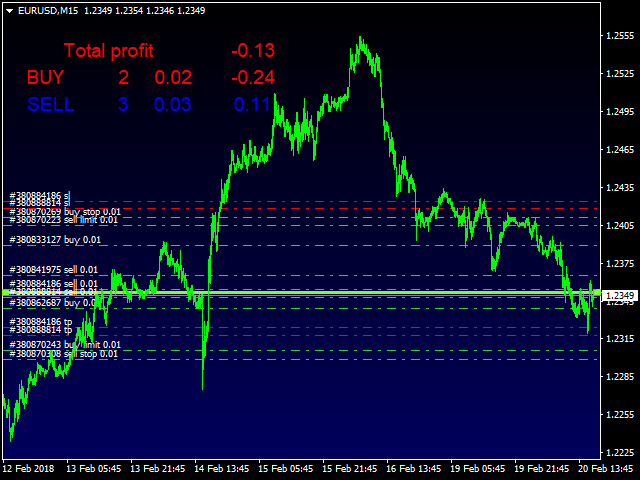
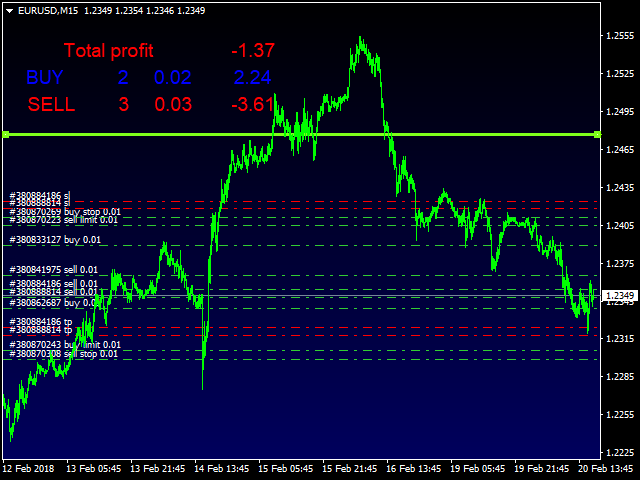
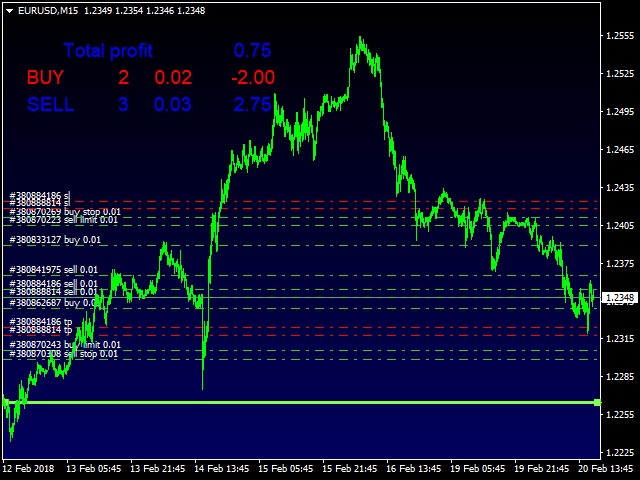
If you need to quickly evaluate the results of trading on a current financial instrument by hypothetical price movement in the chosen direction and up to a certain level, set the indicator on any chart that contains open positions and move the line to the desired level after it appears together with the results tab. This is all you need to understand what happens to your deposit if the price is at this level without taking into account existing stop loss and take profit. Enable considering pending orders to evaluate the situation when they are virtually triggered. You can change the situation based on the obtained results.


Parameters

  • Drawing options for the line — fast result line parameters;
  • Color line Quick response — line color;
  • The width of the lines Quick response — line thickness;
  • Information window parameters — info window parameters;
  • The angle of the graph for the reference — data display window angle;
  • Taking into account pending orders — consider pending orders (disabled by default);
  • Color text — neutral calculation result color;
  • Color plus — positive calculation result color;
  • InpColorMinus — negative calculation result color.


推荐产品
AbzacD
Aleksandr Chernov
The recommended timeframe is M5. Searches for price reversal points on two indicators, after the market correction. Uses the patterns of price movement to enter a position. In the free version, there are no settings for indicator parameters, lot multiplication threshold and lot size. By default, the lot is 0.1 Caution!!! The robot trades aggressively! Recommended deposit from 1000 Recommended leverage from 1:500 Instruction manual: 1. Install Abzac on the demo. Analyzing the tra
FREE
RTSPattern
Tomas Belak
The indicator provides a superior alternative to price action analysis. It enables the identification of normalized patterns, which are then transformed into a graphical representation to forecast future steps within a time series. In the top-left corner, you'll find information regarding the expected prediction accuracy, determined through a complex MSQE calculation. You have the flexibility to adjust the time window, making it easy to validate the indicator's performance. Additionally, you can
KopierMaschine - локальный копировщик сделок между различными счетами MetaTrader 4 и MetaTrader 5 в любом направлении расположенных на одном компьютере с интуитивно понятным интерфейсом. Направления копирования: MT4 --> MT5 MT4 --> MT4 MT5 --> MT5 MT5 --> MT4 для копирования между терминалами MetaTrader 4 и MetaTrader   5 необходимо приобрести версию продукта KopierMaschine  для  MetaTrader   5 Особенности Программа работает в двух режимах Master и Slave На один подчиненный счет можно копирова
Trend Catcher with Alert
Issam Kassas
4.79 (43)
趋势捕捉器: 具有警示指标的趋势捕捉器策略是一种多功能的技术分析工具,可帮助交易员识别市场趋势和潜在的进出点。它采用动态趋势捕捉器策略,根据市场条件进行调整,清晰地呈现趋势方向。交易员可以自定义参数,以符合其偏好和风险容忍度。该指标有助于识别趋势,发出潜在的反转信号,充当跟踪止损机制,并提供实时警报,以便及时应对市场。 具有警示指标的趋势捕捉器策略是一种多功能的技术分析工具,可帮助交易员识别市场趋势和潜在的进出点。它采用动态趋势捕捉器策略,根据市场条件进行调整,清晰地呈现趋势方向。交易员可以自定义参数,以符合其偏好和风险容忍度。该指标有助于识别趋势,发出潜在的反转信号,充当跟踪止损机制,并提供实时警报,以便及时应对市场。 特点: 趋势识别:信号牛市趋势和熊市趋势。 趋势反转:当蜡烛颜色从牛市变为熊市,反之亦然时,提醒可能的反转。 实时警报:为新趋势识别生成警报。 建议: 货币和货币对:EURUSD,AUDUSD,XAUUSD... 时间框架:H1。 账户类型:任何ECN,低点差账户。
FREE
该指标建立了趋势线的扇形(在单击某个蜡烛之后),类似于经典的江恩角。该指标的特点是它不仅在固定比例上构建角度,而且还使用一定数量柱线的平均价格(可选)。 有两种方法可以计算指标中角度的平均价格(可选): 1) 计算从高到低的平均价格变动(对于一定数量的柱); 2) 计算从开盘到收盘的平均价格变动; 选项: 1.Method——构造角的方法; 2. FixedScale - 固定比例(如果在Method中选择了Fixed_Scale); 3. SecondaryAngles - 控制绘制次角的权限; 4. RayRight - 为趋势线设置射线; 5. DrawBackground - 画线作为背景; 6. AnglesQuantity——角度数; 7. Bars_To_Process - 周期,柱的数量,在此基础上确定平均价格,角度的“速度”。如果为零或更低,则根据所有历史数据计算; 8. RisingMainAnglesClr、RisingSecondaryAnglesClr、FallingMainAngle
ZigZag Professional
Dmitriy Kashevich
5 (1)
the zigzag indicator draws lines on the chart from the highest point to the lowest There are built-in fibonacci levels built-in sound alert the indicator highlights trends on small timeframes with a thin line and trends highlights with a coarse line Fibonacci levels can be turned on and off in the settings settings are very simple and clear the same sound alert can be turned on and off, you can change the colors of the lines.
Trend Ray
Andriy Sydoruk
The indicator shows the potential trend direction by cyclical-wave dependence. Thus, all the rays of the intersection will be optimal rays, in the direction of which the price is expected to move, taking into account the indicator period. Rays can be used as a direction for potential market movement. But we must not forget that the approach must be comprehensive, the indicator signals require additional information to enter the market.
VR Cub
Vladimir Pastushak
VR Cub 这是获得高质量切入点的指标。该指标的开发是为了促进数学计算并简化对仓位入场点的搜索。多年来,该指标所针对的交易策略已被证明其有效性。交易策略的简单性是其巨大的优势,即使是新手交易者也能成功进行交易。 VR Cub 计算开仓点以及获利和止损目标水平,这显着提高了效率和易用性。查看使用以下策略进行交易的屏幕截图,了解简单的交易规则。 设置、设置文件、演示版本、说明、问题解决,可以从以下位置获取 [博客] 您可以在以下位置阅读或撰写评论 [关联] 版本为 [MetaTrader 5] 计算入场点的规则 开仓 要计算入场点,您需要将 VR Cub 工具从最后一个高点拉伸到最后一个低点。 如果第一个点在时间上早于第二个点,交易者等待柱线收于中线上方。 如果第一个点在时间上晚于第二个点,交易者等待柱线收于中线下方。 根据上述条件,严格在 柱线收盘 后建仓。 换句话说,如果我们在小时图上进行交易,那么从最高点到最低点的时间距离必须超过24小时,最高点和最低点之间的点数必须大于或等于平均价格变动每天。 维持和改变市场地位 可以有多个未平仓头寸;每个头寸都可以单独修改。 VR Cu
Day Pattern
Oleksandr Martsynyshen
Description: - D ay Pattern - an indicator that helps to identify patterns of price changes for the development of trading algorithms and strategies. For whom this tool? - For developers of trading strategies and algorithms. - Medium- and long-term traders. Time frames H1-W1. Features of the indicator: - There is a function of exporting indicator values to a file of the csv format. - Using the information panel, you can conduct an express analysis of trading tool. - The indicat
The indicator detects and displays Shark harmonic pattern (see the screenshot). The pattern is plotted by the extreme values of the ZigZag indicator (included in the resources, no need to install). After detecting the pattern, the indicator notifies of that by a pop-up window, a mobile notification and an email. The indicator highlights the process of the pattern formation and not just the complete pattern. In the former case, it is displayed in the contour triangles. After the pattern is comple
如果产品有任何问题或者您需要在此产品上添加功能,请联系我 Contact/message me if you encounter any issue using the product or need extra feature to add on the base version Dashboard Super Currency Strength Demo is the demo version of Dashboard Super Currency Strength, which have full functionalities of the paid version, except only 1 currency strength meter with timefrme of M30 and H1 will be used for signal generation (full version has 3 currency strength meters with full timeframe selection). Please re-direct to LINK for
FREE
该指标自动计算并绘制斐波那契支撑位和阻力位 - 最有效的市场分析工具之一。 计算使用所选期间和时间范围的平均价格数据。此期间的最小值和最大值被视为运动的开始和结束。 斐波那契水平让您可以看到潜在的参考点,围绕这些点价格走势可以放缓或逆转,也就是说,它们用于预测进一步的走势,以及设置止损和限价单。 参数: PartsShow - 从当前柱状图显示的历史级别数 CalcPeriod - 价格平均周期 SmoothingMethod - 价格平均法(26 个选项) TF - 用于计算的时间范围 LevelColor - 水平线的颜色 ZeroLevelColor - 零级颜色 ShowVerticalLine - 启用/禁用水平之间的垂直线的显示 VLineStyle - 垂直线的样式 VLineColor - 垂直线的颜色 ShowInfo - 启用以标签形式显示有关级别百分比值的信息,否则以对象描述的形式显示 InfoFontSize - 信息字体大小 InfoColor - 信息字符串的颜色 FiboLevels - 显示水平的百分比值
TrendInChannel
Andriy Sydoruk
This indicator is the undisputed leader among the indicators. And for this statement there is a good reason. The indicator builds a very high quality channel in which it generates signals to enter! What is the ideal strategy for the trader, since the trader always hesitates when choosing a strategy for the job. That is, this indicator will allow you to solve the dilemma of choosing a job by trend or to the channel, since it combines these two basic concepts. Working with the indicator is very
Market Profile 3
Hussien Abdeltwab Hussien Ryad
4 (4)
Market Profile 3 MetaTrader 4 indicator  — is a classic Market Profile implementation that can show the price density over time, outlining the most important price levels, value area, and control value of a given trading session. This indicator can be attached to timeframes between M1 and D1 and will show the Market Profile for daily, weekly, monthly, or even intraday sessions. Lower timeframes offer higher precision. Higher timeframes are recommended for better visibility. It is also possible t
FREE
The indicator detects and displays М. Gartley's Butterfly pattern. The pattern is plotted by the extreme values of the ZigZag indicator (included in the resources, no need to install). After detecting the pattern, the indicator notifies of that by the pop-up window, a mobile notification and an email. The pattern and wave parameters are displayed on the screenshots. The default parameters are used for demonstration purposes only in order to increase the amount of detected patterns. Parameters
MetaWaves
Stanislav Korotky
This indicator was inspired by М & W Wave Patterns by A. Merrill. 5 extremums or 4 edges of ZigZag are enough to build M or W pattern at arbitrary offset in the history. The classical approach includes a table of predefined figures of ZigZag waves, which can transform into each other under special rules—so that next edge can be forecasted based on these rules. Unlike to this approach, the indicator analyses available history and builds statistics for all M and W patterns, which differ in their c
Reversal Pattern Pro
Boonyapagorn Rodvattanajinda
Reversal Patterns Pro Reversal Patterns Pro is a Price Action (PA) analytical tool that scans the reversal patterns.  - Finds and marks the most dependable Japanese candlestick patterns in real-time. - Supports all time frames (Best for Scalping) - Doesn't repaint making it an exceptional indicator for Expert Advisors. Input parameters : - Support & Resistance Mode ( true or false ) for enabling advanced filtering - Donchian Period - RSI Period - RSI Oversold Level - RSI Overbought Level - 
FreqoMaster
Stanislav Korotky
The main idea of this indicator is rates analysis and prediction by Fourier transform. The indicator decomposes exchange rates into main harmonics and calculates their product in future. The indicator shows 2 price marks in history, depicting price range in the past, and 2 price marks in future with price movement forecast. Buy or sell decision and take profit size are displayed in a text label in the indicator window. The indicator uses another indicator as an engine for calculations - FreqoMet
Free automatic fibonacci
Tonny Obare
4.64 (61)
Free automatic Fibonacci is an indicator that automatically plots a Fibonacci retracement based on the number of bars you select on the BarsToScan setting in the indicator. The Fibonacci is automatically updated in real time as new highest and lowest values appears amongst the selected bars. You can select which level values to be displayed in the indicator settings. You can also select the color of the levels thus enabling the trader to be able to attach the indicator several times with differe
FREE
The indicator detects and displays 3 Drives harmonic pattern (see the screenshot). The pattern is plotted by the extreme values of the ZigZag indicator (included in the resources, no need to install). After detecting the pattern, the indicator notifies of that by a pop-up window, a mobile notification and an email. The indicator highlights the process of the pattern formation and not just the complete pattern. In the former case, it is displayed in the contour triangles. After the pattern is com
Expert Advisor designed for trading Engulfing Candle Patterns within a manually input price range the D point of harmonic patterns , gartley , bat cypher butterfly ect.  This is the  full version , word test in the title is an error How Does It Work Step 1 Identify a price range around the end point D of your harmonic pattern. Input two prices into the EA settings   Inp9 Upper Level- type the highest price where an engulfing candle pattern can occur. Inp9 Lower Level - type the lowest price wh
FREE
COG LR Osc AM
Andriy Matviyevs'kyy
The presented indicator allows you to determine potential entry points into the market and set protective orders at reasonable levels. This product can be useful for both beginners and experienced traders. The indicator is based on calculation methods proven by time and practicing traders. The indicator is calculated in two stages: At the first stage, linear regression (LR) of the selected price type is determined for a given number of chart periods. At the second stage, the obtained data is p
FREE
KT Renko Patterns MT4
KEENBASE SOFTWARE SOLUTIONS
2.33 (3)
KT Renko Patterns scans the Renko chart brick by brick to find some famous chart patterns that are frequently used by traders across the various financial markets. Compared to the time-based charts, patterns based trading is easier and more evident on Renko charts due to their uncluttered appearance. KT Renko Patterns features multiple Renko patterns, and many of these patterns are extensively explained in the book titled Profitable Trading with Renko Charts by Prashant Shah. A 100% automate
Laguerre T AM
Andriy Matviyevs'kyy
The indicator analyzes the divergence of the current price with the Laguerre filter data. Indicator signals: Blue dot - short-term transactions to buy an asset are allowed. Red dot - short-term transactions to sell the asset are allowed. A big blue signal - if the price breaks the high of the bar on which the signal was given - a medium-term buy trade is opened. A big red signal - if the price breaks the low of the bar on which the signal was given - a medium-term sell trade is opened. The indic
FREE
Noize Absorption Index MT4
Ekaterina Saltykova
5 (1)
Noize Absorption Index - is the manual trading system that measures the difference of pressure between bears forces and bulls forces. Green line - is a noize free index that showing curent situation. Zero value of index shows totally choppy/flat market.Values above zero level shows how powerfull bullish wave is and values below zero measures bearish forces.Up arrow appears on bearish market when it's ready to reverse, dn arrow appears on weak bullish market, as a result of reverse expectation. S
和谐图案最适合预测市场转折点。和谐图案为您提供高胜率和一天内的高交易机会。 该指标识别了最受欢迎的和谐图案,这些图案预测市场反转点。 基于和谐交易书籍。 重要说明: 该指标不会重绘或滞后(它在D点检测到模式);它不会重新绘制(模式要么有效,要么取消)。 使用方法: 将指标拖放到您的MT5图表上。 将模式检测设置为TRUE(ABCD; Gartley)。 根据您的喜好调整偏差(较大的偏差=更多的模式;较小的偏差=更少的模式)。 根据您的喜好自定义颜色。 根据需要启用或禁用关于入场点、TP和SL的警报。 检测到模式时: 该算法在D点检测到模式。 如果启用了警报,它将通知您检测到的模式。 如果模式无效,则触发一个带有“模式已取消”消息的警报。 成功的模式在蜡烛关闭时触发“入场警报”。 如果价格达到TP1、TP2、TP3、TP4或SL,则会发出带有终端消息的警报。 价格现在为40美元,仅剩下几份副本,最终价格将为70美元。 发展计划: 该指标的当前版本(1.1)将检测Gartley和ABCD模式。 版本1.1将包括Butterfly、Bat和Crab模式。 未来版本将包括其他模式、潜在PRZ检
FREE
Clever TDI Pro
Carlos Forero
Description: The indicator shows the TDI indicator in a separate window, and with the RSI component, the indicator finds possible divergences with M or W patterns. KEY LINKS:   How to Install  -   Frequent Questions  -  All Products  Functions: Finds Market Makers patterns. Finds extremes or exhaustion into the market. Looks for a trend continuation. Content: TDI Indicator Divergence and M or W Signals Note 1:  This indicator should only be considered as a part of any trading strategy. You shoul
Trade with Gann on your side!! MASTER CIRCLE 360 CIRCLE CHART, originally created by Gann admitted that this is “The Mother of all charts”. It is one of the last studies that this great trader left for us. The numeric tab le is apparently quite simple like all the tables and is based on square numbers, the SQUARE OF 12 and is by evolution, one of the most important square numbers. Here we can find CYCLE, PRICE AND TIME thanks to angles and grades, to show past and future support and resistance.
History Pattern Search
Yevhenii Levchenko
该指标建立当前报价,可以与历史报价进行比较,并在此基础上进行价格走势预测。指示器有一个文本字段,用于快速导航到所需日期。 选项: 符号 - 选择指标将显示的符号; SymbolPeriod - 选择指标从中获取数据的时段; IndicatorColor - 指示器颜色; HorisontalShift - 由指标绘制的报价移动指定的柱数; Inverse - true 反转引号,false - 原始视图; ChartVerticalShiftStep - 图表垂直移动(键盘上的向上/向下箭头); 接下来是文本字段的设置,您可以在其中输入日期,您可以通过按“回车”立即跳转到该日期。 接下来是文本字段的设置,您可以在其中输入日期,您可以通过按“回车”立即跳转到该日期。
TrendPlus
Sivakumar Subbaiya
4.38 (13)
Trend Plus   Trendplus  Indicator   Time Frame: Suitable for any time frame.  Purpose: Trend Prediction. Blue and red candle indicate the buy and sell call respectively. Buy: When the blue candle is formed buy call is initiated. close the buy trades when the next red candle will formed.   Sell: When the Red candle is formed Sell call is initiated. close the Sell trades when the next blue candle will formed.   Happy trade!!
FREE
该产品的买家也购买
Trade Assistant MT4
Evgeniy Kravchenko
4.46 (181)
它有助于计算每笔交易的风险,容易安装新的订单,具有部分关闭功能的订单管理, 7 种类型的追踪止损和其他有用的功能。 注意,该应用程序在策略测试器中不起作用。 Manual, Description, Download demo 线条功能  - 在图表上显示开仓线、止损线、止盈线。 有了这个功能,就可以很容易地设置一个新的订单,并在开仓前看到它的附加特性。   风险管理  - 风险计算功能在考虑到设定的风险和止损单的大小的情况下,计算新订单的成交量。它允许你设置任何大小的止损,同时观察设定的风险。 批量计算按钮 - 启用 / 禁用风险计算。 在 " 风险 " 一栏中设置必要的风险值,从 0 到 100 的百分比或存款的货币。 在 " 设置 " 选项卡上选择风险计算的变量: $ 货币, % 余额, % 资产, % 自由保证金, % 自定义, %AB 前一天, %AB 前一周, %AB 前一个月。   R/TP 和 R/SL - 设置止盈和止损的关系。 这允许你设置相对于损失的利润大小。 例如, 1 : 1 - 这决定了 TP = SL 的大小。 2 : 1 - 这意味着 TP 是
您认为在价格可以瞬间变化的市场中,下单应该尽可能简单吗? 在 Metatrader 中,每次您要开单时,您都必须打开一个窗口,您可以在其中输入开盘价、止损和止盈以及交易规模。 在金融市场交易中,资本管理对于维持您的初始存款并使其倍增至关重要。 因此,当您想下订单时,您可能想知道应该开多大的交易? 在这单笔交易中,您应该承担多少百分比的存款? 您可以从这笔交易中获利多少,利润风险比是多少? 在您设置交易规模之前,您需要进行必要的计算,以获得交易规模应该是多少的问题的答案。 想象一下,您有一个工具可以自动完成所有这些工作。 您打开图表,进行市场分析并用水平线标记入场点、防御点(止损)和目标(止盈),最后您定义风险水平,例如 作为可用资本的百分比,您可以在此交易中承担,此时程序提供: 定义风险和止损规模的可接受交易规模 以点数、点数和账户货币计的止损和获利值 风险回报率 现在剩下的就是点击面板上的相应按钮来打开交易。 如果您是黄牛,需要在不设置防御或目标的情况下快速打开和关闭交易,那么您可以在交易管理器面板中轻松掌握一切,您可以在其中定义固定订单参数并通过单击“购买”或 “卖出”按钮。 关闭
Local Trade Copier EA MT4
Juvenille Emperor Limited
5 (79)
通过 Local Trade Copier EA MT4 获得非常快速的交易复制体验。它的简单1分钟设置,使您可以在同一台Windows计算机或Windows VPS上在多个MetaTrader终端之间复制交易,具有闪电般快速的复制速度,低于0.5秒。 无论您是初学者还是专业交易者, Local Trade Copier EA MT4 都提供了广泛的选项,可根据您的特定需求进行自定义。对于任何希望增加利润潜力的人来说,这都是终极解决方案。 今天就尝试一下,看看为什么它是市场上最快、最简单的贸易复印机! 提示: 您可以在您的模拟账户中下载并试用 Local Trade Copier EA MT4 模拟版: 这里 将下载的免费演示文件粘贴到您的 MT4 >> 文件 >> 打开数据文件夹 >> MQL4 >> 专家文件夹并重新启动您的终端。  免费演示版本每次可在 4 小时内发挥全部功能,仅限演示帐户。 要重置试用期,请转至 MT4 >> 工具 >> 全局变量 >> Control + A >> 删除。 请仅在非关键模拟账户上执行此操作,不要在挑战道具公司账户中执行此操作。 Local
TradePanel MT4
Alfiya Fazylova
4.91 (87)
交易面板是一个多功能的交易助手。 该应用程序包含 50 多个专为手动交易而设计的功能。 允许您自动执行大多数交易操作。 应用程序的主要功能: 适用于任何交易工具(外汇、差价合约、期货及其他)。 通过一个终端窗口即可使用所有交易工具。 允许您创建最多四个交易工具工作列表。 允许您选择您最喜欢的交易工具。 允许您在所有(或选定的)终端图表上快速切换交易品种。 允许您使用多种方法来计算交易量。 自动计算每笔交易的风险。 根据止损的大小计算风险。 风险经理。 让您可以在图表上直观地看到新订单的交易水平。 允许您设置虚拟止损和获利。 允许您设置指定的止损和获利比率。 允许您在共同价格水平上为所有头寸设置止损或止盈。 允许您下 OCO 订单(一个订单取消另一个订单)。 允许您根据指定参数关闭订单和平仓。 允许您在达到指定的总利润或损失时平仓。 允许您在图表上设置任务线。 允许您反转“卖出转买入”和“买入转卖出”仓位。 允许您锁定仓位。 允许您设置追踪止损功能。 允许您设置盈亏平衡函数。 允许您设置部分平仓功能。 允许您在达到指定价格水平时设置提醒。 允许您自动和手动截图。 有 5 种界面配色方案
The product will copy all telegram signal to MT4   ( which you are member  ) , also it can work as remote copier.  Easy to set up, copy order instant, can work with almost signal formats, image signal, s upport to translate other language to English Work with all type of channel or group, even channel have "Restrict Saving Content", work with  multi channel, multi MT5 Work as remote copier: with signal have ticket number, it will copy exactly via ticket number. Support to backtest signal. How to
MT4 至 Telegram 信号提供者 是一款易用、可完全自定义的工具,它使发送信号到 Telegram 成为可能,将您的账户变成信号提供者。 消息的格式 可以完全自定义! 但是,为了简便使用,您也可以选择一个预设模板,并能够启用或禁用消息的特定部分。 [ 演示 ]  [ 手册 ] [ MT5 版本 ] [ Discord 版本 ] [ Telegram 频道 ] 设置 可通过 用户指南 获取逐步说明。 无需了解 Telegram API;开发者提供所需的一切。 主要特性 自定义发送给订阅者的订单详情的能力 您可以创建分层订阅模型,例如铜牌、银牌、金牌。金牌订阅可获得所有信号等。 按订单号、符号或备注过滤订单 包括执行订单的图表的屏幕截图 在发送的屏幕截图上绘制已关闭的订单,以便额外验证 推迟发送新订单消息的可能性,以便在发送前对位置进行调整 订单详情的全透明度: 新的市场订单 *附带屏幕截图 订单修改(止损、获利点) 已关闭订单 *附带屏幕截图 部分关闭订单 ** 新的挂起订单 修改的挂起订单(进场价格) 挂起订单激活(作为新的市场订单) 已删除的挂起订单
交易管理器可帮助您快速进入和退出交易,同时自动计算风险。 包括帮助您防止过度交易、报复性交易和情绪化交易的功能。 交易可以自动管理,账户绩效指标可以在图表中可视化。 这些功能使该面板成为所有手动交易者的理想选择,并有助于增强 MetaTrader 4 平台。多语言支持。 MT5版本  |  用户指南+演示 交易经理在策略测试器中不起作用。 如需演示,请参阅用户指南 风险管理 根据%或$自动调整风险 可选择使用固定手数或根据交易量和点自动计算手数 使用 RR、点数或价格设置盈亏平衡止损 追踪止损设置 最大每日损失百分比,在达到目标时自动平仓所有交易。 保护账户免遭过多提款并阻止您过度交易 最大每日损失(以美元为单位)在达到目标时自动关闭所有交易。 保护账户免遭过多提款并阻止您过度交易 一键实现所有交易的盈亏平衡 自动计算从手机/电话发送的交易的风险 OCO 在设置中可用 交易和头寸管理 通过设置每月、每周、每天、每小时或每分钟的最大交易次数,停止过度交易和报复性交易。 高级挂单管理。 调整何时关闭挂单的规则 追踪挂单 支持市价订单和挂单 每日最大利润目标(以美元为单位)以确保头寸并停
Exp COPYLOT CLIENT for MT4
Vladislav Andruschenko
4.66 (67)
MetaTrader 4 的交易复制器。     它从任何账户复制外汇交易、头寸、订单。 它是最好的贸易复印机之一     MT4 - MT4,MT5 - MT4     为了   复制 MT4     版本(或     MT4 - MT5 MT5 - MT5     为了   复制MT5     版本)。 MT5版本 详细描述   +DEMO +PDF 如何购买 如何安装     如何获取日志文件     如何测试和优化     Expforex 的所有产品 复印机 版本       MetaTrader 5 终端 (   МТ5 - МТ5, МТ4 - МТ5   )-   Copylot 客户端 MT5 独特的复制算法将所有交易从主账户准确复制到您的客户账户。 该产品还以其高运行速度而著称,并且具有强大的错误处理能力。 一组强大的功能。 该程序可以在多个终端绑定上运行。 使用它作为您在一个账户上交易的多个账户的交易 的同步器 , - COPYLOT 会将您的交易复制到其他终端。 从已关闭的账户中复制 Invest 密码; 部分关闭仅从 mt4 到 mt4
控制您的外匯投資組合。立即查看您的站立位置、工作原理以及導致您疼痛的原因! 此處提供 MT5 版本: https://www.mql5.com/en/market/product/58658 交易經理儀表板旨在讓您一目了然地顯示您當前在外匯市場中的每個頭寸,並使風險管理和貨幣敞口更易於理解。 對於通過多個頭寸或交易網格和籃子策略逐漸進入市場的交易者,這是需要查看的關鍵信息。監控終端中的多個位置通常很難管理。 過度槓桿化和使用低風險:回報是新交易者和一些經驗豐富的交易者面臨的主要問題,交易經理向您展示您對每種貨幣的風險敞口,確保您不會同時進行雙向交易。 特徵: 未平倉交易 - 查看您當前按貨幣對排序的所有未平倉交易。您不僅可以在該貨幣對上看到您的方向偏差,還可以在該貨幣對上運行的每筆交易或頭寸上看到您的方向偏差。 回撤和利潤信息 - 立即查看您交易活躍的貨幣對的回撤或盈利情況。輕鬆識別需要管理的交易。 手數大小 - 查看您在每個貨幣對上的手數以及您進行的交易數量。 風險敞口 - 查看您對每種貨幣的方向偏差,以確保您不會在另一個入場時以相反的方向交易。另請查看您在該貨幣中使用
VirtualTradePad mt4 Extra
Vladislav Andruschenko
4.88 (60)
一键交易的交易面板。处理头寸和订单!通过图表或键盘进行交易 交易小组进行人工交易。您可以从图表(图表窗口)或键盘进行交易。打开和关闭,反向和锁定。处理职位和订单! МetaТrader4中主要订单的交易控制面板:买入,卖出,买入,买入,卖出,卖出限制,收盘,删除,修改,追踪止损,止损,止损。 MT5版本 详细描述   +DEMO +PDF 如何购买 如何安装     如何获取日志文件     如何测试和优化     Expforex 的所有产品 从符号窗口交易并从键盘交易! 您正在为MetaTrader 4终端提供一个独特的插件 - 虚拟控制面板VirtualTradePad。 Description on English 注意!如果您想学习如何交易 策略测试器  ,请查看我们的免费 TesterPad 实用程序 VirtualTradePad在“  MQL5语言最佳图形面板  ”竞赛中 获得二等奖 。 工作标签 职位标签   -使用职位: 开/关买入和卖出, 冲销所有头寸, 锁定一个共同的立场, 更改止损/获利, 设定一般的止损/获利的位置, 启用追踪止损, 实现盈亏
Unlimited Trade Copier Pro is a tool to copy trade remotely between multiple MT4/MT5 accounts at different computers/locations over internet. This is an ideal solution for signal provider, who want to share his trade with the others globally on his own rules. One provider can copy trades to multiple receivers and one receiver can get trade from multiple providers as well. The provider can even set the subscription expiry for each receiver, so that receiver will not be able to receive the signal
-25% discount ($199 -> $149) Advanced trading tool: One click smart orders that execute under your conditions Developed by trader for trading community:  position size calculator (lot size), open position after price action, strategy builder, set and forget trading, mobile notifications... Risk Management -  Risk percentage position size calculator, gain percentage, target risk reward ratio, spread and commissions are included in calculations 7 Advanced order types   - Set and forget trading
Trade Dashboard MT4
Fatemeh Ameri
5 (20)
Tired of complex order placement and manual calculations? Trade Dashboard is your solution. With its user-friendly interface, placing orders becomes effortless, by a single click, you can open trades, set stop loss and take profit levels, manage trade lot size, and calculate risk to reward ratios, allowing you to only focus on your strategy. Say goodbye to manual calculations and streamline your trading experience with Trade Dashboard. Download   demo version  right now. You can find details
The top-selling EAs on the market cost a lot and one day they are suddenly gone. This is because one strategy will not work in the forex market all the time. Our product is unique from all others in the MQL Marketplace because our EA comes with 34+ built-in indicators that allow adding more strategies every time.  You build your strategy and keep updating it. If one strategy does not work, simply build another all using only one EA. This is All-In-One EA in this market place. You can use as trad
FTMO Sniper 4
Vyacheslav Izvarin
Dedicated for FTMO and other Prop Firms Challenges 2020-2023 Trade only GOOD and checked PROP FIRMS  Default parameters for Challenge $100,000 Best results on GOLD and US100  Use any Time Frame Close all deals and Auto-trading  before  US HIGH NEWS, reopen 2 minutes after Close all deals and Auto-trading  before Weekend at 12:00 GMT+3  Friday Recommended time to trade 09:00-21:00 GMT+3 For Prop Firms MUST use special Protector  https://www.mql5.com/en/market/product/94887 -------------------
将信号从您所属的任何渠道(包括私人和受限渠道)直接复制到您的 MT4。 该工具在设计时充分考虑了用户的需求,同时提供了管理和监控交易所需的许多功能。 该产品采用易于使用且具有视觉吸引力的图形界面。 自定义您的设置并在几分钟内开始使用该产品! 用户指南 + 演示  |     MT5版本  |     不和谐版本 如果您想尝试演示,请参阅用户指南。 Telegram To MT4 接收器在策略测试器中不起作用! Telegram 至 MT4 功能 一次复制多个通道的信号 从私人和受限频道复制信号 不需要机器人令牌或聊天 ID(如果出于某种原因需要,您仍然可以使用这些) 使用风险百分比或固定手数进行交易 排除特定符号 选择复制所有信号或自定义要复制的信号 配置单词和短语以识别所有信号(默认值应适用于 99% 的信号提供商) 配置时间和日期设置以仅在需要时复制信号 设置一次打开的最大交易量 交易和头寸管理 使用信号或自动设置的管理 通过设置每月、每周、每天、每小时或每分钟的最大交易次数,停止过度交易和报复性交易。 支持市价订单和挂单 每日最大利润目标(以美元为单位)以确保头寸并停止
The product will copy all  Discord  signal   to MT4   ( which you are member  ) , also it can work as remote copier.  Easy to set up. Work with almost signal formats, support to translate other language to English Work with multi channel, multi MT4. Work with Image signal. Copy order instant, auto detect symbol. Work as remote copier: with signal have ticket number, it will copy exactly via ticket number. How to setup and guide: Let read all details about setup and download Discord To MetaTrade
Risk Manager for MT4
Sergey Batudayev
4.5 (8)
MT4 的 Expert Advisor 风险管理器是一个非常重要的程序,我认为对每个交易者来说都是必要的程序。 使用此 EA 交易,您将能够控制您交易账户中的风险。风险和利润控制可以以货币形式和百分比形式进行。 要让智能交易系统工作,只需将其附加到货币对图表并以存款货币或当前余额的百分比设置可接受的风险值。 顾问功能 PROMO BUY 1 GET 2 FREE -   https://www.mql5.com/en/blogs/post/754725 该风险经理将帮助您控制风险: - 交易 - 每天 - 一个星期 - 一个月 你也可以控制 1) 交易时允许的最大手数 2) 每天最大订单数 3) 每天最大利润 4) 设置 Equity 的获利了结 不仅如此,如果您在设置中指定自动设置,顾问还可以为您设置默认的止损和止盈。 顾问会在每个事件中附上警报,并向您解释删除订单的原因。比如你开了,你开了第6个订单,按照你的规则你每天只允许开5个订单,顾问会立即删除6个并说明原因。 例如,您开仓的手数比您最初向自己指示的手数大,顾问将删除订单并解释原
DrawDown Limiter MT4
Haidar, Lionel Haj Ali
5 (9)
Drawdown Limiter EA You are in the right place if you were searching for Drawdown control, Drawdown limiter, Balance protection, Equity Protection or Daily Drawdown Limit related to Prop Firm, FTMO, or Funded account trading, or if you want to protect your trading account. Have you suffered from controlling your drawdown when trading funded accounts? This EA is meant for you. Prop firms usually set a rule called “Trader Daily Drawdown”, and if it is not respected, you are disqualified.  I am an
Grid Manual MT4
Alfiya Fazylova
4.71 (17)
Grid Manual是一个交易面板,用于处理订单网格。 该实用程序是通用的,具有灵活的设置和直观的界面。 它不仅可以在亏损方向上设置订单网格,还可以在盈利方向上设置订单网格。 交易者不需要创建和维护订单网格,实用程序会这样做。 打开一个订单就足够了,Grid manual会自动为它创建一个订单网格,并伴随它直到非常关闭。 该实用程序的主要特性和功能: 伴隨以任何方式打開的訂單,包括從移動終端打開的訂單。 適用於兩種類型的網格:“限制”和“停止”。 使用兩種方法計算網格間距:固定和動態(基於 ATR 指標)。 允許您更改未結訂單網格的設置。 顯示圖表上每個網格的盈虧平衡水平。 顯示每個網格的利潤率。 允許您一鍵關閉網格中的盈利訂單。 讓您一鍵關閉每個訂單網格。 允許您對訂單網格應用追踪止損功能。 允許您在訂單網格上應用將訂單網格的止損轉移到盈虧平衡水平的功能。 相對於訂單網格的盈虧平衡水平自動重新排列止盈(僅在限價網格模式下,距離取決於所選的計算類型:“保守”或“激進”)。 最多可管理 20 個訂單網格,每個網格最多可包含 100 個訂單。 計算初始手數時,要考慮入金的大小,不要讓大手
Mentfx Mmanage
Anton Jere Calmes
5 (16)
The added video will show you the full functionality, effectiveness, and simplicity of this trade manager. Drag and Drop Trade Manager. Draw your entry and have the tool calculate the rest. Advanced targeting and close portions of a trade directly available in tool (manage trades while you sleep). Market order or limit order on either side with factored spread. Just draw the entry, the tool does the rest. Hotkey setup to make it simple. Draw where you want to enter, and the stop loss, the tool c
MT4 Alert Signal Trader  is an EA that helps you trade MT4 Alert popup. Some indicators can provide signals by showing an alert popup containing signal texts. This EA will read and trade these signal texts. The alert texts should contain at least 2 elements:  (1) a symbol text   (ex: "EURUSD") and  (2) a command type   (ex: "Buy", "Sell", "Close") that trigger EA's trading activities. Some other contents that may have or not are open price, stop loss, take profit values... The EA needs an aweso
The Expert Advisor will help you forward all pop-up alert with screenshot from  MetaTrader 4 to Telegram channel/ group, also forward all notifications to Telegram. Parameters  -  Telegram Bot Token - create bot on Telegram and get token.  -  Telegram Chat ID  - input your Telegram user ID,  group / channel ID  -  Forward Alert - default true, to forward alert.  -  Send message as caption of Screenshot - default false, set true to send message below Screenshot  How to setup and guide  - Telegram
Ultimate Trailing Stop EA
BLAKE STEVEN RODGER
4.33 (15)
This EA Utility allows you to manage (with advanced filtering) unlimited open orders (manual or EA) with 16 trailing stop methods: fixed, percent, ATR Exit, Chandelier Exit, Moving Average, Candle High Low Exit, Bollinger Bands, Parabolic, Envelope, Fractal, Ichimoku Kijun-Sen, Alligator, Exit After X Minutes or Bars, RSI and Stochastic. The trailing stop can be either real or virtual, and you can exit fully or with a partial close percent on touch or bar close.  Moreover, you can add (overr
Take a Break
Eric Emmrich
5 (27)
The most advanced news filter and drawdown limiter on MQL market NEW: Take a Break can be backtested against your account history! Check the " What's new " tab for details. Take a Break has evolved from a once simple news filter to a full-fledged account protection tool. It pauses any other EA during potentially unfavorable market conditions and will continue trading when the noise is over. Typical use cases: Stop trading during news/high volatility (+ close my trades before). Stop trading when
Custom Ultimate Sniper Dashboard
Hispraise Chinedum Abraham
5 (2)
这个自定义终极狙击手仪表盘是原始终极狙击手仪表盘指标的一个EA升级。它与多达98种不同的算法一起工作,以确保它能捕捉到你工作的资产类别上的趋势的真实性质。 它是对我们几个月来从大多数客户那里得到的很多建议和意见的直接回应。   这个自定义版本是完全可定制的。 由98个独立的自定义算法提供。 非常漂亮的视觉界面,因此你可以轻松和自信地跟踪任何货币对或时间框架的整体市场趋势 可以向telegram发送实时警报 允许你根据你所交易的货币对创建自己的指数 可以向你的手机实时发送警报,所以你不必在电脑前就知道有一个动作正在酝酿。 让你从输入设置中设置8个指数 让你设置你想获得警报的指数和时间框架 当检测到没有互联网连接时,会显示警报   自定义终极狙击手仪表盘已经进行了大量的优化,在动作开始后立即显示。这样,你就不会错过你感兴趣的货币对的任何变动。它的速度非常快,可以在移动发生时迅速捕捉到,并实时向你发送警报,这样你就可以利用移动的优势,而不必整天坐在办公桌前。 它是任何交易策略的一个超级补充,你可以将这个工具与任何其他交易策略和指标一起使用。它主要是为了与我们的其他
MT4 to Discord
Trinh Dat
4.29 (7)
The Expert Advisor will send notifications via Discord when orders are opened/modified/closed on your MetaTrader 4 account. - Send message and screenshot to Discord group/channel.  - Easy to customize message.  - Support custom message for all languages - Support full Emoji.  - Send report Daily, Weekly, Monthly ( must show all history of orders ) Parameters - Discord url Webhook - create webhook on your Discord channel. - Magic number filter - default all, or input magic number to notify with
MT4 to Discord Signal Provider 是一款用户友好、完全可定制的工具,专为直接向 Discord 发送交易信号而设计。这个工具将您的交易账户转变为一个高效的信号提供者。 自定义消息格式以适应您的风格!为了方便使用,您可以从预先设计的模板中选择,并决定包括或排除哪些消息元素。 [ 演示 ] [ 手册 ] [ MT5 版本 ] [ Telegram 版本 ] 设置 遵循我们详细的 用户指南 进行简单设置。 不需要预先了解 Discord API;我们提供所有必要工具。 主要特性 为订阅者更新自定义订单详情。 实施分层订阅模型,如铜牌、银牌、金牌,每一层都提供不同级别的信号访问。 附加执行订单的图表截图。 在这些截图上显示已关闭的订单,以增加清晰度。 提供延迟发送新订单消息的选项,以便在发送前进行最后调整。 透明和详细的订单信息: 带截图的新市场订单。 订单修改(止损、获利)。 已关闭和部分关闭的订单。 新的和修改的挂起订单。 挂起订单的激活和删除。 关于历史订单的详细报告。 每个订单的可定制评论。 注意: * 截图包括图表上的任何对象,如指标。 ** 在报
OrderManager MT4
Lukas Roth
4.63 (19)
介绍 OrderManager :MT4的革命性工具 使用全新的Order Manager实用程序,像专业人士一样管理您在MetaTrader 4上的交易。Order Manager设计简单,易于使用,可让您轻松定义和可视化每笔交易的风险,从而做出明智的决策并优化您的交易策略。有关OrderManager的更多信息,请参阅手册。 [ 手册 ] [ MT5版本 ] [ Telegram 频道 ] 主要功能: 风险管理:快速轻松地定义您交易的风险,让您做出更好的决策并提高交易性能。 视觉表示:图形化地查看您的交易和相关风险,以清晰简洁地了解您的开放头寸。 订单修改:只需几次点击即可轻松修改或关闭您的订单,简化您的交易过程,为您节省宝贵的时间。 掌握新闻:一键获取最新市场新闻。 不要错过这个MT4交易员的必备工具。用Order Manager提升您的交易体验,将您的交易游戏提升到新的水平。 OrderManager在startegyTester中 不 工作! OrderManager 仅与 Windows 兼容。 请考虑给这个产品一个5星级评价。您的优秀反馈将激励作者加快更新
Equity Shield
Vladimir Stepanov
4.57 (7)
EA 将通过持续监控净值并按照参数输入的规则来保护您的账户免受意外损失。 当违反规则时,EA 将关闭所有交易。 您可以将 EA 设置为以特定百分比或货币亏损关闭所有交易,或以特定百分比或货币利润关闭。 此实用程序对于 Prop Trading Challenges 非常有用,可以保持低亏损并保护您的资产! 我的信号和其他产品可以在这里找到 购买后请联系我以获得支持和礼物。 参数: For 1 pair only: 将 Equity Guard 放在您要管理的货币对上 For all pairs at account :Equity Shield 将控制终端上的所有货币对(将 Equity Shield 放在任何货币对上) TP at money(0:关闭):TP in money SL at money(0:关闭):SL in money TP at % at account Equity: TP 将在 X% 的账户利润中关闭交易 SL at % account equity :SL 将关闭所有未平仓交易,账户损失 X 百分比 如何开始: 仅在一张图表上加载 EA 自定义您的设置 不理
作者的更多信息
ZigZag on average
Valeriy Medvedev
This is a well-known ZigZag indicator. But it differs by the fact that its plot is based on values of the middle line which is set by a user. It can display Andrews’ Pitchfork and standard or Bobokus Fibo levels. NO REPAINTING. Parameters Period МА — middle line period. Default value is 34. Minimum value is 4. Maximum value is set at your discretion. Used to calculate price - base price to calculate the middle line. The averaging method - method of smoothing the middle line. Turning pitchfork
The indicator is similar to https://www.mql5.com/en/market/product/12330 . However, it considers the MQL5 platform features. Peaks and bottoms are calculated based solely on external bars. After a swing is formed, the indicator does not redraw providing opportunities for traders working on horizontal level breakthroughs. Traffic can be reduced by changing the amount of calculated bars in the MinBars variable (default value is 500). All you need is to select the output options, so that you can se
This is an interactive and easy-to-set indicator which allows to form seven equally spaced channels which have your settings simultaneously. All seven channels are enabled by default. But you can easily enable one or another channel using control buttons located in the upper case of the indicator's control panel. You can change a period of the indicator calculation by clicking one of buttons indicating number of the channel in the lower case of the control panel. Two other buttons (one of them i
This EA represents an interactive panel with adjustable parameters destined for installation and deletion of pending orders (orders grid generator). You can place the panel anywhere on the screen or hide it into a dot clicking on the button in the upper left part of the chart (it will be shown after clicking on it for the second time). Number and step of orders, lot size, vertical shift for limit orders - all these things make your work easier. There are functions for restoring according to pend
Equidistant channel
Valeriy Medvedev
The purpose of the indicator is drawing an equidistant channel. It is somewhat different from the traditional model. The choice of control parameters is simple and does not require any special description. Enter the calculation interval in hours and the solution to the problem will appear on the screen. Please note that the time involved in calculation of the channel must be greater than the timeframe it will be displayed on. If the parameters you enter are beyond the allowable limits, you will
This indicator is designed for drawing equidistant channels. Two options are available: based on the number of hours in the indicator calculation and by the number of bars. To draw a channel, enter a number 1 or greater. The maximum value is limited by the amount of visible bars. If the parameters you enter are beyond the allowable limits, you will get notified if the indicator restrictions. Please note that the time involved in calculation of the channel must be greater than the timeframe it wi
The indicator displays the moving average of all periods on one chart. It shows the MA of a one step lower timeframe and all the MAs equal to and higher than it. Parameters Period moving average - Moving Average period (default is 34); Used to calculate price - price used for the MA calculation (default is the average price = (high+low)/2); The averaging method - default is linear-weighted; Moving average shift - MA shift (default is 0). Just enter the MA calculation period and its parameters,
This indicator is designed for analyzing your positions on 30 financial instruments with the font size of the output information between 8 and 10. If the font size is 11 you will see only 26 instruments and so on: 12-25, 13-24, 14-20. The font size can range from 8 to 14. The main window contains buttons with names of financial instruments and lines where brief information about all open positions is displayed. Two columns show the total volumes in lots of positions in each trading direction: BU
This is a prototype of the famous Control and management of transactions panel. There are two main differences: Allows to work with all the variety of financial instruments opened by a user and not only with instruments it was attached to; To activate levels of order closure hidden from a broker, it uses not lines but modifiable virtual levels. To enjoy the full functionality of the panel you are advised to have: Desk analytical table . Their combined operation allows to keep the situation under
This is a prototype of the famous Control and management of transactions panel. There are two main differences: Allows to work with all the variety of financial instruments opened by a user and not only with instruments it was attached to; To activate levels of order closure hidden from a broker, it uses not lines but modifiable virtual levels. The EA will independently determine a total number of involved financial instruments, display them in the upper left window and locate the pointer on the
It is widely known that colors affect the emotional state of a human, especially if this human is a trader. Psychologists recommend that you follow your instincts and select the color of your environment that is most comfortable to you. In order to reduce emotional stress, impact of colors on a person should be considered. The optimal range of the most beneficial colors includes green, yellow-green and green-blue ones. This indicator allows you to manage your emotional state and health. Choose a
The indicator is based on the two-buffer scheme and does not require any additional settings. It can be used on any financial instrument without any restrictions. The indicator is a known ZigZag, but it does not redraw . The indicator allows to easily detect significant levels on the price chart, as well as demonstrates the ability to determine the probable direction of a price movement. The calculations are based on the candles' Close prices, thus improving the reliability of the levels. Para
The idea of the indicator stems from the necessity to clearly define the borders of support and resistance levels, which helps to plan the opening and closing of positions in the areas that most appropriately determine the process. Look at the breakdowns of the resistance level that confirm the intention of the price to continue the upward movement, after it passed the support level and entered the channel formed by the two levels. The same is for the case when the price enters the channel downw
This indicator is a logical extension of the product at https://www.mql5.com/en/market/product/12526 . The only difference is that price movement is displayed using a histogram with levels, allowing to assess the direction and strength of the movement. How to interpret the signal: 0 - the middle of the channel; above 0.5 - the breakdown of the channel up; below -0.5 - the breakdown of the channel down. Both indicators are displayed in the attached screenshots. Install the indicator and you will
Simple Line
Valeriy Medvedev
The indicator shows the levels of the past week and day. In addition, it draws a level in percentage. This level is specified relative to the difference between the High and Low of the past month and week. For the daily levels of the past day, the Close levels are additionally displayed. All you need to do is configure the display parameters of the levels to your liking. Parameters Over the past months installations - settings for the last months; PasteMonthsLines - the level display mode is
This indicator is the logical continuation of the well-known equidistant channel indicator: https://www.mql5.com/en/market/product/8723 . The main purpose of the indicator is the visualization of price levels relative to the parallel channel using Fibo Bobokus levels in a separate window and the price history. This often allows forecasting the future price movement with a sufficiently high degree of probability. The Fibo levels calculation equation is as follows: FiboLevel = (50-(100*((Close[i]-
This simple to use utility allows opening charts from the list of financial instruments by left clicking their names. The chart window is opened using the Default template. The template name can be changed to one of those stored in Charts-Templates section of the terminal. It is possible to customize the background colors of panels and their labels, and also to select the display type for a more comfortable working environment. This is all you need to know in order to see the result quickly. P
This is an individual tool for analyzing the market situation. It is very simple to use. After attaching the indicator to the chart, you will see three vertical lines named "VLine 1", "VLine 2" and "VLine 3", following in this order from left to right. For the utility to operate correctly, this sequence should always be observed. Please note: at the first start, the lines are not bound to specific price levels on the chart. This should be done by user in accordance with the following rule: if li
This indicator displays a set of moving average lines across all higher timeframes. The indicator can be installed on any financial instrument and any timeframe. For the analysis of the lines, a panel with timeframe values is provided in the lower right corner. Using the panel, you can easily enable/disable the display of the MA line of any higher timeframe. This allows a more thorough analysis of the market situation. The color of the button matches the color of the moving average line. Param
This indicator is designed for monitoring RSI levels on the current and higher timeframes. The control panel is user friendly and consists of buttons, with which you can control the display of lines as per the names of the buttons. The button color matches the line color. Parameters "___| Settings of the main indicator " RSI Period - averaging period for index calculation (default is 14); RSI Price type - price used for calculations (default is the Close price); "___| Color palette " Text colo
Этот индикатор предназначен для контроля уровней CCI на текущем и старших от него таймфреймах. Панель управления проста в понимании и состоит из кнопок, с помощью которых можно управлять отображением линий, соответствующим указанным на наименовании кнопок. Цвет кнопки совпадает с цветом линии. Этот индикатор из серии подобных индикаторов, которые уже успели завоевать популярность: https://www.mql5.com/ru/market/product/30276 и https://www.mql5.com/ru/market/product/30403 Параметры "___| Set
This is a well-known ZigZag indicator. But it differs by the fact that its plot is based on values of the middle line which is set by a user. It can display Andrews’ Pitchfork and standard or Bobokus Fibo levels. NO REPAINTING. Parameters Period МА — middle line period. Default value is 34. Minimum value is 4. Maximum value is set at your discretion. Used to calculate price — type of price used for the midline calculations. The averaging method — type of smoothing for the middle line. Turning
The indicator is based on the two-buffer scheme and does not require any additional settings. It can be used on any financial instrument without any restrictions. The indicator is a known ZigZag, but it does not redraw . The indicator allows to easily detect significant levels on the price chart, as well as demonstrates the ability to determine the probable direction of a price movement. The calculations are based on the candles' Close prices, thus improving the reliability of the levels. Para
It is an analogue of the indicator of levels at https://www.mql5.com/en/market/product/24273 for the MetaTrader 5 platform. The indicator shows the levels of the past month, week and day. In addition, it draws a level in percentage relative to the difference between the High and Low of the past month and week. For the daily levels of the past day, the Close levels are additionally displayed. All you need to do is to configure the display parameters of the levels to your liking. In some cases, af
筛选:
asaens15
2126
asaens15 2020.10.15 11:29 
 

用户没有留下任何评级信息

Matthew Todorovski
13122
Matthew Todorovski 2018.06.16 11:10 
 

用户没有留下任何评级信息

Singgih Wasito Adhi
355
Singgih Wasito Adhi 2018.04.26 21:05 
 

用户没有留下任何评级信息

Tim Eubanks
5733
Tim Eubanks 2018.03.22 00:29 
 

用户没有留下任何评级信息

Alexey Suvorov
782
Alexey Suvorov 2018.02.28 02:21 
 

用户没有留下任何评级信息

回复评论
版本 1.2 2018.12.13
v1.2-устранена ошибка отображения при перезагрузке терминала.
版本 1.1 2018.12.11
v1.1 - добавлена возможность увидеть результат в процентах от депозита