• 概述
  • 评论 (11)
  • 评论 (6)
  • 新特性

Extremum Reverse Bar

3.55

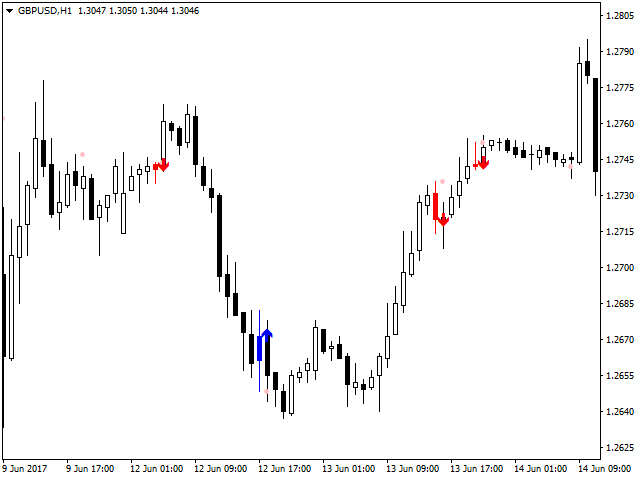
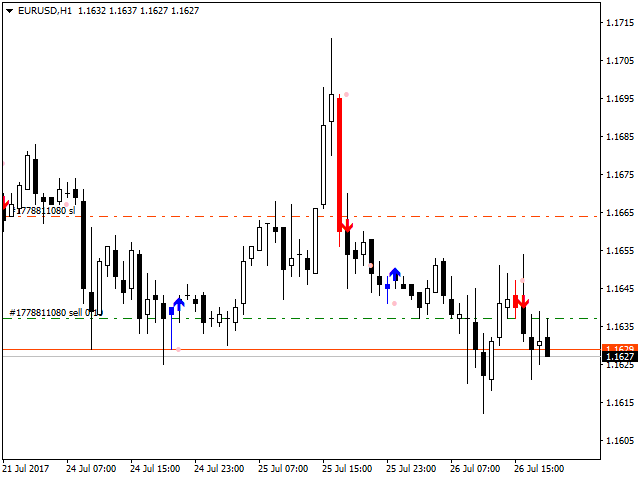
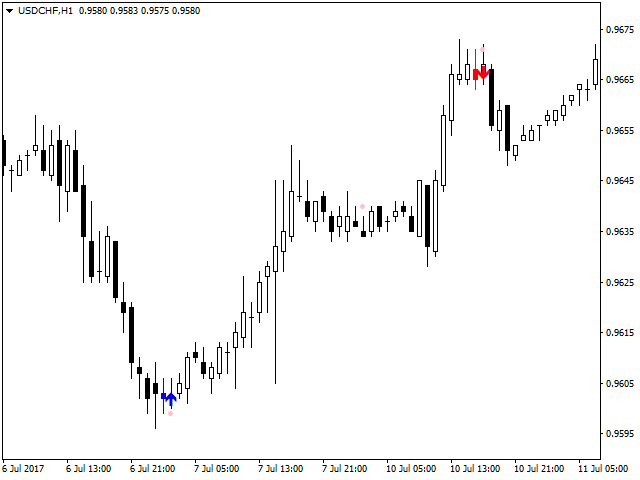
This indicator has been created for finding the probable reversal points of the symbol price. A small candlestick reversal pattern is used it its operation in conjunction with a filter of extremums. The indicator is not redrawn!

  • If the extremum filter is disabled, the indicator shows all points that have a pattern.
  • If the extremum filter is enabled, the condition works – if the history Previous bars 1 candles back contains higher candles and they are farther than the Previous bars 2 candle, such an input is not considered an extremum. Previous bars 1 and Previous bars 2 are specified in the settings.

It is possible to receive sound and push notifications about the presence of an indicator signal. In order to enable sending messages about the signals to the mobile terminal, set SendNotifications = true, with the MetaQuotes ID configured in advance (read here if you do not know where).

With the default settings, a pink dot shows the assumed reversal bar (Revers bar color), blue and red arrows indicate the expected entries (Bull color and Bear color).


Settings

  • Alerts – enable sound notifications.
  • Send Notifications – enable push notifications.
  • Send Email Notifications - enable email notifications.
  • Extremum filter – enable the extremum filter.
  • Previous bars 1 – the number of candles to check in the filter.
  • Previous bars 2 – the number of candles that must not contain new highs/lows.
  • Bear color – color of the bearish candlesticks.
  • Bull color – color of the bullish candlesticks.
  • Revers bar color – color of the dot that marks a reversal bar.
  • Start Bar – the initial bar for searching, default = 0.
  • Limit Bars (0 = No limit) – the number of bars to check starting from the initial bar, limited to 1000 bars by default. This option slightly reduces the load.

If you need any additional functionality for the indicator, contact me.

评论 11
SandPaddict
129
SandPaddict 2022.09.24 17:08 
 

Simple but does exactly what it says it does. Thank you Aleksandr

Aravind Kolanupaka
8820
Aravind Kolanupaka 2020.11.22 21:11 
 

Simple and good!

Aleksandr Tamonin
4109
Aleksandr Tamonin 2017.08.03 20:31 
 

Хороший индикатор!

推荐产品
TrendPlus
Sivakumar Subbaiya
4.38 (13)
Trend Plus   Trendplus  Indicator   Time Frame: Suitable for any time frame.  Purpose: Trend Prediction. Blue and red candle indicate the buy and sell call respectively. Buy: When the blue candle is formed buy call is initiated. close the buy trades when the next red candle will formed.   Sell: When the Red candle is formed Sell call is initiated. close the Sell trades when the next blue candle will formed.   Happy trade!!
FREE
Free automatic fibonacci
Tonny Obare
4.64 (61)
Free automatic Fibonacci is an indicator that automatically plots a Fibonacci retracement based on the number of bars you select on the BarsToScan setting in the indicator. The Fibonacci is automatically updated in real time as new highest and lowest values appears amongst the selected bars. You can select which level values to be displayed in the indicator settings. You can also select the color of the levels thus enabling the trader to be able to attach the indicator several times with differe
FREE
PZ Penta O MT4
PZ TRADING SLU
2.25 (4)
The Penta-O is a 6-point retracement harmonacci pattern which usually precedes big market movements. Penta-O patterns can expand and repaint quite a bit. To make things easier this indicator implements a twist: it waits for a donchian breakout in the right direction before signaling the trade. The end result is an otherwise repainting indicator with a very reliable trading signal. The donchian breakout period is entered as an input. [ Installation Guide | Update Guide | Troubleshooting | FAQ | A
FREE
Pin Bars
Yury Emeliyanov
主要用途:"Pin Bars"旨在自动检测金融市场图表上的pin bars。 针杆是具有特征主体和长尾的蜡烛,可以发出趋势反转或修正的信号。 它是如何工作的:指标分析图表上的每个蜡烛,确定蜡烛的身体,尾巴和鼻子的大小。 当检测到与预定义参数相对应的引脚柱时,指示器会根据引脚柱的方向(看涨或看跌)在图表上用向上或向下箭头标记它。 参数: TailToBodyRatio-定义尾部长度和针杆主体尺寸之间的最小比率。 NoseToTailRatio-设置"鼻子"和销杆尾部之间的最大允许比率。 ArrowSize-定义标记的pin条与图表上指向它的箭头之间的距离。 应用:"Pin Bars"指标可用于识别潜在的趋势反转点,并产生进入市场或平仓的信号。 当正确使用并与其他技术指标和分析方法相结合时,该指标能够改善交易结果。 其他产品 :   https://www.mql5.com/ru/users/yura1994ru/seller#products 重要事项: 该指标不是一个现成的交易系统,应该与其他分析工具结合使用。 建议在真实账户上使用指标之前,先在历史数据上测试和优化指标的参数
FREE
Are you tired of drawing trendlines every time you're analyzing charts? Or perhaps you would like more consistency in your technical analysis. Then this is for you. This indicator will draw trend lines automatically when dropped on a chart. How it works Works similar to standard deviation channel found on mt4 and mt5. It has 2 parameters: 1. Starting Bar 2. Number of bars for calculation The   starting bar   is the bar which drawing of the trend lines will begin, while the   number of bars for c
FREE
Traditional MACD MT4
Daniel Lewis
4.59 (69)
MetaTrader 4/5 中的 MACD 指标看上去与其它许多图表软件里的 MACD 不同。这是因为 MetaTrader 4/5 版本的 MACD 显示 MACD 曲线作为直方图,而传统上显示为曲线。此外,MetaTrader 4/5 版本使用 SMA 计算信号线,而根据 MACD 的定义,它应该使用 EMA。MetaTrader 4/5 版本也不计算实际的 MACD 直方图 (即 MACD 与信号线之间的差异)。这可能对那些 MetaTrader 4/5 的新手带来困惑,因为将 MACD 线显示为直方图,而未提供实际的 MACD 直方图。 这款指标按照其创造者 (Gerald Appel) 的定义显示 MACD,如同其它图表软件里显示的那样。而 MACD 线的计算采用 "快速" EMA 和 "慢速" EMA 之间的差异。信号线是 MACD 线的 EMA。MACD 直方图是MACD 和信号线之间的差异 (MACD 直方图可自行作为可靠的用作背离信号)。 True/False 启用开关,您可以显示/隐藏 MACD/信号线,以及 MACD 直方图。
FREE
Follow The Line
Oliver Gideon Amofa Appiah
4 (13)
FOLLOW THE LINE GET THE FULL VERSION HERE: https://www.mql5.com/en/market/product/36024 This indicator obeys the popular maxim that: "THE TREND IS YOUR FRIEND" It paints a GREEN line for BUY and also paints a RED line for SELL.  It gives alarms and alerts of all kinds. IT DOES NOT REPAINT and can be used for all currency pairs and timeframes. Yes, as easy and simple as that. Even a newbie can use it to make great and reliable trades. NB: For best results, get my other premium indicators for more
FREE
Wicks UpDown Target GJ Wicks UpDown Target GJ is specialized in GJ forex pairs. Choppy movement up and down on the opening range every day.  Trading breakouts on London session and New York session is recommended. Guideline Entry Strategy Idea: Step 1 - Breakout Forming (Warning! Trade on London Session and New York Session) Step 2 - Breakout Starting (Take Action on your trading plan) Step 3 - Partial Close your order & set breakeven (no-risk) Step 4 - Target complete Step 5 - Don't tr
FREE
MASi Three Screens
Aleksey Terentev
5 (2)
MASi Three Screens is based on the trading strategy by Dr. Alexander Elder. This indicator is a collection of algorithms. Algorithms are based on the analysis of charts of several timeframes. You can apply any of the provided algorithms. List of versions of algorithms:     ThreeScreens v1.0 - A simple implementation, with analysis of the MACD line;     ThreeScreens v1.1 - A simple implementation, with analysis of the MACD histogram;     ThreeScreens v1.2 - Combines the first two algorithms
FREE
Rainbow MT4
Jamal El Alama
Rainbow MT4 is a technical indicator based on Moving average with period 34 and very easy to use. When price crosses above MA and MA changes color to green, it’s a signal to buy. When price crosses below MA and MA changes color to red, it’s a signal to sell. The Expert advisor ( Rainbow EA MT4) based on Rainbow MT4 indicator, as you can see in the short video below is now available here .
FREE
Wise Men Indicator demo
Bohdan Kasyanenko
3.67 (3)
The indicator displays signals according to the strategy of Bill Williams on the chart. Demo version of the indicator has the same features as the paid, except that it can work only on a demo account . Signal "First Wise Man" is formed when there is a divergent bar with angulation.  Bullish divergent bar - with lower minimum and closing price in the upper half. Bearish divergent bar - higher maximum and the closing price at the bottom half. Angulation is formed when all three lines of Alligat
FREE
This trial scanner works with the other "Smart Market Structure Opportunity Scanner", and is basically an extension of that scanner with added features to find more accurate entry opportunities for day trading or refined swing trading.  The most important added features are:  1) The ADRs ( Average Daily Range ) for the last 5 days would have color and  +/- sign that shows the direction of each days ADR     move.  2) I added RSI values for each of the trading timeframes ( 1min, 5min, 15min, 30min
FREE
MegaTrends
Sivakumar Subbaiya
1 (1)
Megatrends  Indicator   Time Frame: Suitable for any time frame.  Purpose: Trend Prediction. Blue and red color indicate the buy and sell call respectively. Buy: When the blue line is originating it is opened buy call. Sell: When the Red line is origination it is opened sell call Happy trade!! this indicator is suitable for all time frame, but our recommended time frame to use 1hour and 4 hours, suitable for any chart.
FREE
New Bar Alarm Free
Tomoyuki Nakazima
This indicator alerts you when/before new 1 or 5 minute bar candle formed. In other words,this indicator alerts you every 1/5 minutes. This indicator is especially useful for traders who trade when new bars formed. *This indicator don't work propery in strategy tester.Use this in live trading to check functionality. There is more powerful Pro version .In Pro version,you can choose more timeframe and so on. Input Parameters Alert_Or_Sound =Sound ----- Choose alert or sound or both to not
FREE
ZigZag Fibo Retracement
Dang Khoa Nguyen
5 (1)
ZigZag Fibo Retracement Indicator Optimize Your Trading Strategy! Are you seeking to optimize your trading strategy in the financial markets? Explore the unique features of the ZigZag Fibo Retracement Indicator, a powerful tool designed to help you identify potential support and resistance levels based on the combination of ZigZag patterns and Fibonacci ratios. Integration of ZigZag Patterns and Fibonacci: The ZigZag Fibo Retracement Indicator combines the effectiveness of ZigZag patterns, helpi
FREE
UPD1 Rsi Dots Dashboard
Vitaliy Kuznetsov
5 (1)
指标在图表上显示基于终端RSI振荡器的信号。 从而能够滤除重复信号。 这里振荡器用于搜索反向信号。 建议将其作为波段策略和水平交易的切入点。 多币种仪表板可用。 有了它,您可以轻松地在图表之间切换。 在产品讨论中,您可以建议一种可以在其中嵌入仪表板的算法。 输入参数 。 主要设置 。 Bars Count – 指标将工作的历史柱的数量 。 RSI Period – 振荡器周期 。 RSI Level – 振荡器的电平。 振荡器在0到100之间。 如果选择10,信号将高于10,低于90 。 RSI Applied Price 。 Repeat Signal - 重复信号 。 Enable – 所有重复的信号将与箭头/图标 。 No Signal – 所有重复的将被忽略 。 视觉箭头 。 Sell Code – Sell rsi图标的代码编号 。 Sell Color – 出售RSI图标的颜色 。 Buy Code – 购买RSI图标的代码编号 。 Buy Color – 购买RSI图标的颜色 。 Indent Coeff – 由波动系数从阴影缩进 。 Siz
FREE
The Day Scalping System
Anton Iudakov
3 (5)
Scalping indicator. It takes into account volatility, price movement in the local interval and the direction of the current trend. Recommended timeframe - M5. Advantages: Low volatility when a signal appears ensures minimal movement against an open position. The indicator does not redraw its signals. There are alert signals. It is a great tool for day trading. Settings: Name Description Period Indicator period Range of each bar in the period (pp.) The maximum size of each candle in the indicat
FREE
This indicator shows the latest untouched support and resistance as horizontal lines. The indicator can show support/resistance from higher timeframes. With this indicator you can e.g. easily see the support/resistance of the timeframes H4, D1 and W1 on a H1 chart, which can be a big advantage while time your entry on H1. This is the FREE version of the indicator: Support Resistance Multi Time Frame The free version works only on EURUSD and GBPUSD! Parameters referenceTF: the timeframe from wh
FREE
PZ Three Drives
PZ TRADING SLU
4 (3)
This indicator finds Three Drives patterns. The Three Drives pattern is a 6-point reversal pattern characterised by a series of higher highs or lower lows that complete at a 127% or 161.8% Fibonacci extension. It signals that the market is exhausted and a reversal can happen. [ Installation Guide | Update Guide | Troubleshooting | FAQ | All Products ] Customizable pattern sizes Customizable colors and sizes Customizable breakout periods Customizable 1-2-3 and 0-A-B ratios It implements visua
FREE
High Low Open Close MT4
Alexandre Borela
4.81 (21)
如果你象这个项目一样,就有5个饥饿审查。 塔克的后续工作: borelatech 这项指标采用了既定价格的公开、高、低价和关闭价格 可以对特定时间区加以调整。 许多机构和专业人士都认为这些是重要的。 贸易商可以为你了解他们可能更进一步的地点, 积极。 现有期间为: 前一日。 前一星期。 曾任Month。 曾任。 前一年。 或: 目前日。 目前周。 目前 Month。 目前配额。 今年。
FREE
Toby Strategy Indicator
Ahmd Sbhy Mhmd Ahmd ʿYshh
The indicator rely on The Toby strategy >> The mother candle which is bigger in range than the previous six candles. A vertical line shows the last Toby Candle with the targets shown up and down. The strategy is about the closing price out of the range of the toby candle to reach the 3 targets..The most probable to be hit is target1 so ensure reserving your profits and managing your stop lose.
FREE
SFT Trend Chart
Artem Kuzmin
4 (1)
Opening positions in the direction of the trend is one of the most common trading tactics. This indicator determines the direction of the local movement and colors the candles on the chart in the appropriate color. Allows you to enter the transaction at the very beginning of the movement Thanks to the flexible settings you can use on any currency pairs, metals and cryptocurrency Can be used when working with binary options Distinctive features Does not redraw. Additional parameters for
FREE
Cumulative Delta MT4
Evgeny Shevtsov
4.69 (35)
The indicator analyzes the volume scale and splits it into two components - seller volumes and buyer volumes, and also calculates the delta and cumulative delta. The indicator does not flicker or redraw, its calculation and plotting are performed fairly quickly, while using the data from the smaller (relative to the current) periods. The indicator operation modes can be switched using the Mode input variable: Buy - display only the buyer volumes. Sell - display only the seller volumes. BuySell -
FREE
Market Profile 3
Hussien Abdeltwab Hussien Ryad
4 (4)
Market Profile 3 MetaTrader 4 indicator  — is a classic Market Profile implementation that can show the price density over time, outlining the most important price levels, value area, and control value of a given trading session. This indicator can be attached to timeframes between M1 and D1 and will show the Market Profile for daily, weekly, monthly, or even intraday sessions. Lower timeframes offer higher precision. Higher timeframes are recommended for better visibility. It is also possible t
FREE
OrderBlock TS Roman
Vladislav Vlastovskii
4 (7)
Индикатор строит блоки заказов (БЗ) по торговой системе (ТС) Романа. Поиск блоков осуществляется одновременно на двух таймфремах: текущем и старшем (определяемым в настройках). Для оптимизации и игнорирования устаревших блоков в настройках задается ограничение количества дней в пределах которых осуществляется поиск блоков. Блоки строятся по правилам ТС состоящем из трех шагов: какую свечу вынесли (что?); какой свечой вынесли (чем?); правило отрисовки (как?).
FREE
Wave Reversal Indicator - determines the direction of trend waves and price reversals. The indicator shows wave movements and trend directions. It gives recommendations where to follow the trader, helps to follow the trading strategy. It is an addition to an intraday or medium-term strategy. Almost all parameters are selected for each time frame and are changed automatically, the only parameter for manual adjustment is the wavelength. Works on various trading instruments and timeframes, rec
FREE
Trend arrow Indicator
NGUYEN NGHIEM DUY
3.23 (13)
Trend arrow Indicator is an arrow Indicator used as an assistant tool for your trading strategy. The indicator analyzes the standard deviation of bar close for a given period and generates a buy or sell signals if the deviation increases. It good to combo with Martingale EA to follow Trend and Sellect Buy Only/Sell Only for EA work Semi-Automatic. You can use this  Indicator with any EAs in my Products.
FREE
HMA Trend
Pavel Zamoshnikov
4.6 (80)
A trend indicator based on the Hull Moving Average (HMA) with two periods. The Hull Moving Average is an improved variant of the moving average, which shows the moment of trend reversal quite accurately. It is often used as a signal filter. Combination of two types of Hull Moving Averages makes a better use of these advantages: HMA with a slow period identifies the trend, while HMA with a fast period determines the short-term movements and signals in the trend direction. Features The movement
FREE
WH Price Wave Pattern MT4
Wissam Hussein
5 (5)
Welcome to our   Price Wave Pattern   MT4 --(ABCD Pattern)-- The ABCD pattern is a powerful and widely used trading pattern in the world of technical analysis. It is a harmonic price pattern that traders use to identify potential buy and sell opportunities in the market. With the ABCD pattern, traders can anticipate potential price movements and make informed decisions on when to enter and exit trades. EA Version : Price Wave EA MT4 MT5 version : Price Wave Pattern MT5 Features :  Aut
FREE
Super Auto Fibonacci
Muhammed Emin Ugur
Discover the power of precision and efficiency in your trading with the " Super Auto Fibonacci " MT4 indicator. This cutting-edge tool is meticulously designed to enhance your technical analysis, providing you with invaluable insights to make informed trading decisions. Key Features: Automated Fibonacci Analysis: Say goodbye to the hassle of manual Fibonacci retracement and extension drawing. "Super Auto Fibonacci" instantly identifies and plots Fibonacci levels on your MT4 chart, saving you tim
FREE
该产品的买家也购买
Gann Made Easy
Oleg Rodin
4.96 (45)
Gann Made Easy 是一个专业且易于使用的外汇交易系统,它基于使用先生理论的最佳交易原则。 W.D.江恩。该指标提供准确的买入和卖出信号,包括止损和获利水平。您甚至可以使用推送通知在旅途中进行交易。 购买后请联系我!我将免费与您分享我的交易技巧和丰厚的红利指标! 您可能已经多次听说过江恩交易方法。通常 Gann 的理论不仅对于新手交易者而且对于那些已经有一定交易经验的人来说都是非常复杂的东西。这是因为江恩的交易方法在理论上并不那么容易应用。我花了几年时间来完善这些知识,并将最好的原则应用到我的外汇指标中。 该指标非常易于应用。您所需要的只是将其附加到您的图表并遵循简单的交易建议。该指标不断进行市场分析工作并寻找交易机会。当它检测到一个好的入口点时,它会为您提供一个箭头信号。该指标还显示止损和获利水平。 换句话说,当您像先生一样进行交易时,该指标会为您提供最佳江恩建议。江恩亲自告诉你此时此刻该做什么。但最好的部分是您不需要了解任何有关江恩交易原则的知识,因为该指标会为您完成整个市场分析工作。
Gold Stuff
Vasiliy Strukov
4.89 (250)
Gold Stuff 是专为黄金设计的趋势指标,也可用于任何金融工具。 该指标不会重绘,也不会滞后。 推荐时间框架 H1。 在它指标工作全自动专家顾问 EA Gold Stuff。 你可以在我的个人资料中找到它。 购买后立即联系我以获得设置和个人奖励!   设置 绘制箭头 - 打开关闭。 在图表上绘制箭头。 警报 - 打开关闭声音警报。 电子邮件通知 - 打开关闭。 电子邮件通知。 Puch-notification - 打开关闭。 推送通知。 接下来,调整色域。 Gold Stuff 是专为黄金设计的趋势指标,也可用于任何金融工具。 该指标不会重绘,也不会滞后。 推荐时间框架 H1。 在它指标工作全自动专家顾问 EA Gold Stuff。 你可以在我的个人资料中找到它。 购买后立即联系我以获得设置和个人奖励!   设置 绘制箭头 - 打开关闭。 在图表上绘制箭头。 警报 - 打开关闭声音警报。 电子邮件通知 - 打开关闭。 电子邮件通知。 Puch-notification - 打开关闭。 推送通知。 接下来,调整色域。
Atomic Analyst
Issam Kassas
5 (1)
首先值得强调的是,该交易指标是非重绘、非延迟的指标,这使其成为手动和机器人交易的理想选择。 Atomic Analyst是一种PA价格行动指标,利用价格的力量和动量来寻找市场上更好的机会。配备了高级过滤器,可帮助去除噪音和假信号,并提高交易潜力。使用多层复杂的指标,Atomic Analyst扫描图表,并将复杂的数学计算转化为任何初学者都能理解并用来做出一致交易决策的简单信号和颜色。 “Atomic Analyst”是专为新手和经验丰富的交易者量身定制的综合交易解决方案。它将高级指标和一流功能融合为一体的交易策略,使其成为所有类型交易者的多功能选择。 日内交易和剥头皮策略:专为快速准确的日内交易和短期交易而设计。 日内和摆动交易策略:可用作追求价格大幅波动的日内和摆动交易者的可靠工具。 多货币和市场:凭借其可靠的精度,在不同的工具和市场上运作。 多个时间框架:可在多个时间框架上使用,性能良好。 稳定性:所有指标均不重绘、不重绘和不滞后,确保可靠的信号。 信号清晰度:提供箭头信号,用于清晰的入场和出场点。 实时警报:通过交易入场、SL和TP警报通知交易者。 多个利润水平:使用
TPSproTREND PrO
Roman Podpora
5 (15)
TPSpro TRENDPRO  - is a trend indicator that automatically analyzes the market and provides information about the trend and each of its changes, as well as giving signals for entering trades without redrawing! The indicator uses each candle, analyzing them separately. referring to different impulses - up or down impulse. Exact entry points into transactions for currencies, crypto, metals, stocks, indices!  -  Version MT5               DETAILED DESCRIPTION        /       TRADING SETUPS           
Quantum Trend Sniper Indicator MT4
Bogdan Ion Puscasu
4.59 (39)
介绍   量子趋势狙击指标 ,突破性的 MQL5 指标,正在改变您识别和交易趋势反转的方式!由拥有超过13年交易经验的资深交易员团队开发,     量子趋势狙击指标   旨在通过其创新的方式以极高的准确度识别趋势反转,将您的交易之旅推向新的高度。 ***购买量子趋势狙击指标,即可免费获得量子突破指标!*** 当量子突破指标识别出趋势反转时,它会向您发出警报和信号箭头,并建议您三个止盈水平。 它既适合新手交易者,也适合专业交易者。 量子 EA 通道:       点击这里 MT5版本:       点击这里 建议: 时间范围:  所有时间范围。为了获得最佳结果,我们建议在 M15、M30 和 H1 时间范围内使用它。 货币对:欧元兑美元、英镑兑美元、澳元兑美元、欧元兑英镑, EURAUD, XAUUSD 账户类型:ECN、Raw 或 Razor,点差极低 经纪时间:任意 经纪商:IC Markets、Pepperstone with Raw 和 Razor 的点差最低 建议止损:50 点 建议止盈水平:20 点、50 点和 1
Trend Screener
STE S.S.COMPANY
4.83 (86)
趋势指标,趋势交易和过滤的突破性独特解决方案,所有重要趋势功能都内置在一个工具中! 它是 100% 非重绘多时间框架和多货币指标,可用于所有符号/工具:外汇、商品、加密货币、指数、股票。 趋势筛选器是有效的指标趋势跟踪指标,它在图表中提供带有点的箭头趋势信号。 趋势分析器指标中可用的功能: 1.趋势扫描仪。 2. 具有最大利润分析的趋势线。 3.趋势货币强度计。 4. 带有警报的趋势反转点。 5. 带有警报的强趋势点。 6. 趋势箭头 每日分析示例,每日信号表现...等与我们的趋势筛选指标,可以在这里找到: 点击这里 限时优惠:Trend Screener Indicator 仅售 50 美元且终身可用。原价 125$) 通过访问我们的 MQL5 博客,您可以找到我们所有的高级指标以及分析示例、每日信号表现...等。 : 点击这里 我们的趋势系统由 2 个指标组成: 1. Trend Screener Indicator:显示趋势仪表盘、图表中的趋势线、入场点...等。 2. Trend Line Map Indicator:显示买卖作为仪表板,活动信号盈利/亏损
Scalper Vault
Oleg Rodin
5 (27)
Scalper Vault 是一个专业的剥头皮系统,为您提供成功剥头皮所需的一切。该指标是一个完整的交易系统,可供外汇和二元期权交易者使用。推荐的时间范围是 M5。 该系统为您提供趋势方向的准确箭头信号。它还为您提供顶部和底部信号以及江恩市场水平。无论您拥有何种交易经验,该系统都易于使用。您只需要遵循简单的规则并每天重复该过程。 建议将此系统用于主要货币对。感谢您的关注! 请注意,该指标在策略测试器中可能无法正常工作。因此,我建议仅在模拟或真实账户的真实交易条件下使用该系统。 指示器提供所有类型的警报,包括推送通知。 购买指标后请与我联系。我将免费与您分享我的个人交易建议和出色的奖励指标! 祝您交易愉快,盈利!
TPSpro RFI Levels
Roman Podpora
5 (13)
A key element in trading is zones or levels from which decisions to buy or sell a trading instrument are made. Despite attempts by major players to conceal their presence in the market, they inevitably leave traces. Our task was to learn how to identify these traces and interpret them correctly. Reversal First Impulse levels (RFI)   -  Version MT5                INSTRUCTIONS                 RUS                 ENG                                       R ecommended to use with an indicator   -  
Advanced Currency Strength28 Indicator
Bernhard Schweigert
4.9 (662)
目前26%的折扣 任何新手或专家交易者的最佳解决方案! 这个指标是一个独特的、高质量的、可负担得起的交易工具,因为我们纳入了一些专有的功能和一个新的公式。只需一个图表,你就可以读出28个外汇对的货币强度!想象一下,你的交易将如何得到改善,因为你的交易是在你的手中进行的。想象一下,你的交易将如何改善,因为你能够准确地确定新趋势或剥头皮机会的触发点? 用户手册:点击这里  https://www.mql5.com/en/blogs/post/697384 这是第一本,原版的! 不要买一个毫无价值的崇拜者的克隆品。 特别的 子窗口中的箭头显示强劲的货币势头GAP将指导你的交易! 当基础货币或报价货币处于超卖/超买区域(外盘斐波那契水平)时,在个人图表的主窗口中出现警告信号。 当货币力量从外围区间回落时,回撤/反转警报。 十字星模式的特别警报 可选择多个时间框架,以快速查看趋势! 货币强度线在所有的时间框架中都非常平稳,当使用较高的时间框架来识别总体趋势,然后使用较短的时间框架来确定精确的入口时,效果非常好。你可以根据自己的意愿选择任何时间框架。每个时间框架都由其自身进
首先,值得强调的是,这个交易工具是非重绘、非重画和非滞后的指标,非常适合专业交易。 智能价格行动概念指标是一个非常强大的工具,既适用于新手,也适用于经验丰富的交易者。它将超过20个有用的指标合并到一个指标中,结合了高级交易思想,如内圈交易员分析和智能资金概念交易策略。该指标侧重于智能资金概念,提供有关大型机构交易方式的见解,帮助预测它们的动向。 它在流动性分析方面尤其擅长,有助于理解机构的交易方式。它擅长预测市场趋势,并仔细分析价格波动。通过将您的交易与机构策略对齐,您可以更准确地预测市场走向。该指标多才多艺,擅长分析市场结构,识别重要的订单区块,并识别各种模式。 它擅长识别BOS和CHoCH等模式,理解动量的转变,并突出显示供需强劲的关键区域。它还擅长发现强大的不平衡,并分析价格创造更高高点或更低低点的模式。如果您使用斐波那契回撤工具,该指标可以满足您的需求。它还可以识别相等的高点和低点,分析不同的时间框架,并通过仪表板显示数据。 对于使用更高级策略的交易者,该指标提供了工具,如公平价值差指标和优惠和折扣区域的识别。它特别关注高时间框架订单区块,并在较长时间框架内彻
目前八折优惠! 对任何新手或专家交易者来说都是最好的解决方案! 这个仪表板软件适用于28种货币对。它基于我们的两个主要指标(高级货币强度28和高级货币冲动)。它对整个外汇市场提供了一个伟大的概述。它显示高级货币强度值,货币运动速度和28个外汇对在所有(9)时间段的信号。想象一下,当你可以使用图表上的单一指标观察整个市场,以确定趋势和或剥头皮的机会时,你的交易将得到改善 我们已经在这个指标中建立了一些功能,使你更容易识别强势和弱势货币,同时识别和确认潜在的交易。该指标以图形方式显示货币的强势或弱势是增加还是减少,以及它在所有时间段的表现。 增加的新功能是动态市场斐波那契水平,它适应当前的市场条件变化,这是一个已经在我们的高级货币强度28和高级货币冲动指标中使用的成熟的加分项。 在交易时,总是将弱势货币和强势货币配对,这个新指标将帮助你做到这一点。 用户手册:点击这里  https://www.mql5.com/en/blogs/post/708783 特点  显示每个时间段的ACS28和GAP-speed(冲动)的货币强度值。 列:颜色代码以7种颜色
Entry Points Pro
Yury Orlov
4.7 (224)
这是一款 MT4 的趋势指标,可提供准确的入场交易信号,且无重绘或延迟。 它可应用在任何金融资产:外汇、加密货币、贵金属、股票、指数。 最好的结果出现在 M15+ 的时间帧内。 指标的 MT5 版本 重要! 购买后请联系我,以便获取详细指南和奖励。 视频 (6:22) - 一个信号赢取的利润等于指标价格的三倍。 视频 (4:44) - 它如何在测试器中工作,我的提示和技巧。 视频 (1:44) - 有关它如何处理加密货币和指数的几句话。 大多数交易者在 Entry Points Pro 指标的帮助下,在第一个交易周内就改善了他们的交易结果。 Entry Points Pro 指标的益处 入场信号无重绘或延迟 如果信号出现,并得到确认(如果信号所在烛条已收盘),则它不会再消失;不像是重绘指标,它会导致重大的财产损失,因为它们可以在显示信号后再将其删除。 无差错开仓 指标算法可令您找到入场交易(买入或卖出资产)的理想时机,从而提高每位交易者的成功率。 Entry Points Pro 可操作任何资产 它允许您在 MT4 平台上交易任何经纪商提供的加密货币、股票、
Advanced Supply Demand
Bernhard Schweigert
4.92 (310)
现在优惠 33%! 任何新手或专业交易者的最佳解决方案! 该指标是一款独特、高质量、且价格合理的交易工具,因为我们已经整合了许多专有功能和新公式。 依据此更新,您将能够显示双重时间帧区域。 您不仅可以显示一个较高的时间帧,还可以同时显示图表时间帧,加上更高的时间帧:显示嵌套时区。 供需双方所有交易者都会喜欢它。 :) 重要信息披露 高级供需的最大潜力,请访问 https://www.mql5.com/zh/blogs/post/720245   想象您的交易如何得以改善,是因为您能够精准定位入场或目标位吗? 构建于新的底层算法,它可以更轻松地识别出买卖双方之间的潜在失衡。 这是因为它以图形方式展示供需最强劲区域,及其过去的表现(显示旧区域)。 这些功能旨在帮助您更轻松地发现最佳入场区域和价位。 现在您可以针对您的交易品种和时间帧来优化和编辑区域强度! 高级供需指标适用于所有产品和时间帧。 它是一个新的公式,非常新的功能是两个区域强度函数可由用户输入进行调整! 这在交易中是一大优势。 当您学习如何使用专有功能,例如带有价格游离最小 X 因子的区域强度时,您能够判断该区域强劲与否。 供
XQ Indicator MetaTrader 4
Marzena Maria Szmit
3 (2)
Step into the realm of Forex trading with confidence and precision using XQ, a cutting-edge Forex indicator designed to elevate your trading game to unprecedented heights. Whether you're a seasoned trader or just stepping into the world of currency exchange,   XQ Forex Indicator   empowers you with the insights and signals needed to make informed trading decisions. The signal conditions are a combination of three indicators, and XQ Forex Indicator only display  medium and long-term trends . The
TrendMaestro
Stefano Frisetti
5 (2)
note: this indicator is for METATRADER4, if you want the version for METATRADER5 this is the link: TRENDMAESTRO recognizes a new TREND in the bud, he never makes mistakes. The certainty of identifying a new TREND is priceless. DESCRIPTION TRENDMAESTRO identifies a new TREND in the bud, this indicator examines the volatility, volumes and momentum to identify the moment in which there is an explosion of one or more of these data and therefore the moment in which prices have strong probability of f
引入神奇外汇指标:释放精准交易的力量 你是否厌倦了寻找在所有时间框架上都能取得出色结果的完美外汇指标?别再继续寻找了!神奇外汇指标已经来到,改变您的交易体验,将您的利润推向新的高度。 神奇外汇指标基于尖端技术和多年的精心开发,堪称外汇市场上的强大和精确的巅峰之作。这个卓越的工具旨在满足各个层次的交易者需求,在追求持续盈利性方面提供无与伦比的优势。 神奇外汇指标的独特之处在于其无与伦比的适应性。无论您是日内交易者、波段交易者还是更喜欢长期持仓,该指标都经过优化,能在所有时间框架上取得出色的结果。然而,当在1小时时间框架上使用时,它的准确性和捕捉市场复杂走势的能力得到真正展示。 准备好对神奇外汇指标的准确性和可靠性感到惊讶。其先进的算法无缝结合了强大的指标、统计分析和趋势识别,实时为您提供全面的市场视图。指标的智能和动态信号使您能够自信地做出明智的交易决策,最大限度地提高获胜交易的机会。 不再犹豫和迷茫。神奇外汇指标消除了交易的猜测,使您在市场参与者中具有独特的优势。其用户友好的界面和直观的设计使得无论是经验丰富的专业人士还是初学者都能轻松掌握这一卓越工具的力量。 有了神奇外汇指标的支持,
FX Power MT4 NG
Daniel Stein
5 (8)
通过 mql5 和 Telegram 上 的晨间简报获取每日市场更新,包括详细信息和屏幕截图 ! FX Power MT4 NG 是我们长期以来非常受欢迎的货币强度计算器 FX Power 的下一代产品。 这款下一代强度计算器能提供什么?您所喜爱的原版 FX Power 的所有功能 附加功能 黄金/XAU 强度分析 更精确的计算结果 可单独配置的分析周期 可自定义计算限制,以获得更好的性能 为希望查看更多信息的用户提供特殊的多实例设置 无尽的图形设置,可在每个图表中设置您最喜欢的颜色 无数的通知选项,让您再也不会错过任何重要信息 采用 Windows 11 和 macOS 风格的全新圆角设计 神奇的移动指标面板 FX Power 主要功能 所有主要货币的完整强势历史 所有时间框架内的货币强弱历史 所有经纪商和图表的计算结果完全相同 100% 可靠的实时计算 -> 无重绘 可通过下拉列表选择分析时段 通过自定义模式单独配置分析时段 可在一个图表中使用多个实例 可移动 FX Power 显示屏(通过拖放) 适用于高分辨率 QHD、UHD 和 4K 显示器 自动终端配置 针对平板电脑
Market Reversal Alerts
LEE SAMSON
4.21 (121)
成為突破者,隨著價格反轉,市場結構會改變利潤。 訂單突破者指示器可以識別趨勢或價格走勢何時接近枯竭並準備好逆轉。它會提醒您市場結構的變化,通常會在發生逆轉或重大回調時發生。 該指標使用專有計算來確定突破和價格動能。每當在可能的耗盡點附近形成新的高點時,指標就會繪製最後一個生成該高點的順序塊。然後,它將隨價格移動隨價格跟隨定單。然後,當價格轉向相反方向並突破該訂單塊時,它會提醒您,從而創建新的市場結構並開始趨勢或重大回調的可能逆轉。 訂單塊是在創建高/低之前的最後一個相反的彩色蠟燭,並且當價格跌破這些關鍵區域以下時,這表明趨勢可能會發生短期或長期反轉。 特徵 提醒您關鍵耗盡點的市場結構變化 價格接近耗盡水平時自動提取訂單塊 在一個方向繼續移動時,在價格後面跟踪定單,以提醒您最佳的反轉輸入 將顏色更改為純色塊,以顯示何時發生市場結構中斷。 適用於所有交易品種和時間範圍 內置集成的彈出窗口和電子郵件警報 策略和如何與定單破壞者指標進行交易 當斷路器塊發生時,您有兩個選擇。 看左邊!我們正在尋求供應/需求或支撐/阻力位嗎?市場結構轉變(逆轉)通常發生在價格重新測試舊水平或
EasyTrade Indicator
Gabor Bocsak
5 (5)
多货币和多框架买卖提醒。 自动追踪止损和风险奖励止盈! 该指标扫描并分析市场,让您无所事事! 在一张图表上交易您的所有货币!   购买后请留言联系我,我会给您发送交易助理EA。 该指标使用多个振荡器和附加的过滤器来找到最佳的已确认进入点,因此您无需担心! 它会提醒您并为您选择观察的所有时间范围和货币绘制一个按钮。 只需按下按钮即可转到图表并打开交易! 该指标还为所有基础货币和市场观察货币绘制强度面板(可在设置中调整)。这将向您显示所有货币对和选择的更高时间范围。 在指标窗口中:带有趋势过滤器的特殊 MACD 直方图和图表货币的多时间框架趋势面板! 它提供所有货币和时间范围的交易警报,只需按下按钮即可转到图表! 展示: 绿色箭头:买入信号 红色箭头:卖出信号 出现买入或卖出信号后,只需按 EA 上的 EASYTRADE 按钮,它就会为您提供自动计算的手数、止损和止盈! 检查指示器窗口中的过滤器,对于多头交易,它必须为绿色,对于空头交易,它必须为橙色! 专家顾问的设置: https://www.mql5.com/en/blogs/post/
Quantum Breakout Indicator PRO
Bogdan Ion Puscasu
4.96 (26)
介绍     Quantum Breakout PRO   ,突破性的 MQL5 指标,正在改变您交易突破区域的方式!   Quantum Breakout PRO 由拥有超过 13 年交易经验的经验丰富的交易者团队开发,旨在通过其创新和动态的突破区域策略将您的交易之旅推向新的高度。 量子突破指标将为您提供带有 5 个利润目标区域的突破区域的信号箭头,以及基于突破框的止损建议。 它既适合新手交易者,也适合专业交易者。 量子 EA 通道:       点击这里 MT5版本:   点击这里 重要的!购买后请私信我领取安装手册。 建议: 时间范围:M15 货币对:GBPJPY、EURJPY、USDJPY、NZDUSD、XAUUSD 账户类型:ECN、Raw 或 Razor,点差极低 经纪商时间:GMT +3 经纪商:IC Markets、Pepperstone with Raw 和 Razor 的点差最低 规格: 不重漆! 最多 5 个建议利润目标区域 建议止损水平 可定制的盒子。您可以设置自己的 Box Time Start 和 Box Time E
Currency Strength Wizard
Oleg Rodin
4.91 (44)
货币强度向导是一个非常强大的指标,为您提供成功交易的一体化解决方案。该指标使用多个时间范围内所有货币的数据来计算这个或那个外汇对的力量。此数据以易于使用的货币指数和货币电力线的形式表示,您可以使用它们来查看这种或那种货币的力量。 您所需要的只是将指标附加到您要交易的图表上,该指标将向您显示您交易的货币的真实强度。该指标还向您显示买卖量压力的极值,您可以在顺势交易时利用这些压力。该指标还显示了基于斐波那契的可能目标。该指标可用于各种交易时间范围。该指标支持各种货币对的交易。 该指标为您提供所有类型的警报,包括推送通知。 购买后请联系我。我将与您分享我的交易技巧,并免费为您提供丰厚的红利指标! 祝您交易愉快,获利丰厚!
PRO Renko System
Oleg Rodin
5 (24)
PRO Renko Arrow Based System for trading renko charts.  准确的信号交易任何外汇工具. 另外,我将免费提供系统的附加模块! PRO Renko系统是RENKO图表上高度准确的交易系统。该系统是通用的。 该交易系统可应用于各种交易工具。 该系统有效地中和了所谓的市场噪音,打开了获得准确反转信号的通道。 该指标易于使用,只有一个参数负责产生信号。 您可以很容易地使算法适应您感兴趣的交易工具和renko酒吧的大小。 我很乐意通过提供任何咨询支持来帮助所有客户有效地使用该指标。 祝您交易成功!购买后,立即写信给我! 我将与您分享我的建议和我的renko发电机。 另外,我将免费提供系统的附加模块!
TrendDecoder Premium
Christophe, Pa Trouillas
5 (3)
确定范围和下一步可能的走势   |  获得早期信号和趋势强度   |  在反转之前获得明确的退出   |  了解价格将测试哪些斐波水平 非重绘、非延迟指标 - 手动和自动交易的理想选择 - 适用于所有资产和所有时间单位 限时优惠 >>   50% OFF 购买后,  请联系我的频道  获取推荐设置 MT5   版本: 点击此处 使用   BladeSCALPER   和   PowerZONES   获取我们的完整方法 它是什么? TrendDECODER 集多种创新于一身,使趋势监测变得简单易行。 投射趋势线(Projective TrendLine)--快速参考即将到来的趋势 实时趋势线(RealTime TrendLine)与投射趋势线(Projective TrendLine)的对比 - 与之前的同方向走势相比,市场是加速还是放缓? 实时趋势线交叉 - 趋势正在偏离轨道 使用 GreyBox - 市场不再是趋势并进入新的过渡序列 使用 DecoderSignals 和 Blue/Orange Clouds - 利用作为动态支撑/阻力的 Blue/Orange
Trend Forecasting
Mohamed Hassan
5 (14)
This indicator is unstoppable when combined with our other indicator called Katana. After purchase, send us a message and you could get Katana for FREE as a BONUS After purchase, send us a private message for your instructions.  MT5 version: click here There are limited copies available at $45. Next price is $99. Don't miss this great deal!  The Trend Forecasting indicator is a very unique & easy tool that is able to make prediction about future price movement based on the signals
使用我们的自定义MT4指标发现成功外汇交易的秘诀! 您是否曾经想过如何在外汇市场上取得成功,一贯赚取利润,同时降低风险? 这是您一直在寻找的答案! 允许我们介绍我们的专有MT4指标,该指标将彻底改变您的交易方法。 独特的多功能性 我们的指标专为喜欢Renko和Rangebar Candle编队的用户而设计。 我们了解到,这些图表类型受到许多经验丰富的交易者的青睐,这就是为什么我们的指标与它们无缝集成,从而提供无与伦比的市场分析。 清晰的趋势信号 忘记复杂的分析! 我们的指标利用鲜艳的色彩和清晰的点结构来明确指示市场趋势。 红色和蓝色的点毫无疑问地对价格变动的方向留下了疑问,从而可以在您的交易中快速决策。 与HH/HL HL/LL策略对齐 如果您正在寻求一个指标,该指标无缝地与基于HH/HL和HL/LL结构的策略无缝合作,则不需要更多。 我们的工具不仅确定了这些形式,而且还促进了它们在投资过程中的有效利用。 绝对的清晰度和简单性 我们的首要任务是为您提供一种不仅有效而且易于使用的工具。 我们的指标是为了清晰而设计的,使您可以专注于做出投资决策,而不是
TakePropips Donchian Trend Pro
Eric John Pajarillaga Aldana
4.82 (17)
TakePropips Donchian Trend Pro   (MT4) 是一款功能强大且有效的工具,可使用 Donchian 通道自动检测趋势方向,并为您提供进场和退场交易信号! 这个多功能指标包括趋势扫描器、交易信号、统计面板、筛选器、交易时段和警报历史仪表板。它旨在为您提供交易信号并节省您分析图表的时间! 您可以在我们的博文中下载用户手册和安装指南:   https   :// www.mql5.com/en/blogs/post/751368 今天立减 50%!价格从 98 美元降到 49 美元! 您可以在 Strategy Tester 上测试该指标(启用可视模式)。如果您喜欢在实时图表上进行测试,也可以给我发消息以获取 7 天试用版。 视频教程也可在说明下方获得更多详细信息。 如果您有任何问题或需要任何帮助,请与我联系。 TakePropips Donchian Trend Pro 指标适用于所有外汇对、金属、商品、指数和加密货币。 主要特点 交易信号 - 检测多个时间范围内所有货币对的买卖机会。它将为您提供警报并在图表上绘制交易信号,最多 3 个止盈价和一个止
Up Down v6
Guner Koca
4.67 (9)
up-down indicator is no repaint and works all pairs and lower than weekly time frames charts. it is suitable also 1 m charts for all pairs. and hold long way to signal. dont gives too many signals. when red histogram cross trigger line that is up signal.and price probably will down when blue histogram cross trigger line that is down signal.and price probably will go up. when the signals not seen press + button on terminal . too see weekly chart because of low data on chart ,it needs to lower p
Scalper Inside PRO
Alexey Minkov
4.75 (55)
SALE NOW! Limited Time Offer! An exclusive indicator that utilizes an innovative algorithm to swiftly and accurately determine the market trend. The indicator automatically calculates opening, closing, and profit levels, providing detailed trading statistics. With these features, you can choose the most appropriate trading instrument for the current market conditions. Additionally, you can easily integrate your own arrow indicators into Scalper Inside Pro to quickly evaluate their statistics and
buy sell star indicator has a different algoritms then up down v6 and buy sell histogram indicators. so that i put this a another indicator on market. it is no repaint and all pairs and all time frame indicator. it need minimum 500 bars on charts. when  the white  x sign on the red histogram that is sell signals. when the white x sign on the blue  histogram that is sell signals. this indicator does not guarantie the win.price can make mowement on direction opposite the signals. this is multi tim
FX Volume
Daniel Stein
4.6 (35)
通过 mql5 和 Telegram 上 的 " 晨间简报 "获取每日市场更新,包括详细信息和屏幕截图 ! 外汇交易量(FX Volume)是第一个也是唯一一个从经纪商角度真正洞察市场情绪的交易量指标。 直接在您的图表上看到这些信息是真正改变游戏规则和突破性的交易解决方案。 受益于独特的市场数据洞察,如 比率(Ratios )显示货币多头和空头头寸的比率(百分比 比率变化 显示所选时间段内的多头比率及其百分比变化 总交易量 显示货币的总交易量(多头和空头),以手为单位 多头 交易量显示货币所有多头头寸的交易量 空头 交易量显示所有货币空头头寸的交易量 净多头 显示净多头交易量,即所有多头头寸减去所有空头头寸(以手为单位)。 净多头百分比 显示货币净多头交易量的变化 请阅读我们的基本教程 -> "如何使用外汇交易量进行交易 " 获取更多信息,如常见问题、交易技巧和教程视频,请访问我们的 外汇交易量公共信息频道 请 安装并运行 SI Connect 以建立与我们数据中心的持续连接 背景信息 我们都知道,外汇是一个分散的市场。这就是为什么我们必须打破常规思维,开发一个独
作者的更多信息
The indicator is designed for displaying the following price levels on the chart: Previous day's high and low. Previous week's high and low. Previous month's high and low. Each of the level types is customizable. In the indicator settings, you set line style, line color, enable or disable separate levels. Configurations ----Day------------------------------------------------- DayLevels   - enable/disable previous day's levels. WidthDayLines   - line width of daily levels. ColorDayLines   - lin
FREE
First RSI level
Yurij Izyumov
3.57 (7)
First RSI level indicator analyzes and displays the level, at which the first crossing of the standard RSI maximum or minimum value took place for the subsequent definition of strong trends. The indicator allows you to track the beginning of a trend that does not follow the signals of the standard RSI trading strategy, for example, when the price rushes downwards after reaching an oversold level instead of reversing. In this case, we have to conclude that a strong trend is underway and the next
FREE
RSI 7TF
Yurij Izyumov
3 (5)
This is a multitimeframe RSI indicator defining trends, oversold/overbought zones, as well as all intersections of signal lines from different timeframes on a single chart using arrows and audio alerts. When working with standard RSI, we often need to examine data from all necessary timeframes simultaneously. RSI 7TF solves this issue. If you are only interested in audio signals when signal lines are crossed, then have a look at RSI Alerts . Attention! The indicator uses seven timeframes - M5, M
FREE
RSI vs Envelopes
Yurij Izyumov
1.67 (3)
This semaphore indicator is based in the standard RSI, which is applied over the Envelopes indicator that shows an envelope or envelope fluctuation borders. This is a version of RSI vs Envelopes Graph drawn in a separate window . A sell signal emerges when the upper envelope/border is broken by the RSI indicator from top to bottom. A buy signal emerges when the lower envelope/border is broken by the RSI indicator from bottom upwards. The indicator can draw arrows on the indicator, draw vertical
FREE
Stable Trend MA
Yurij Izyumov
5 (3)
The indicator is based on a single Moving Average of a user-defined period. By analyzing the price movement of the price relative to this MA, and also by tracking all updates of the price Highs and Lows over the same period as the MA period, the indicator draws its own picture of the trend, avoiding the ever-breaking MA lines. Therefore, if the trend goes up, the line will also point upwards and will not change its direction even on small retracements, allowing to capture almost the entire trend
FREE
Time Levels
Yurij Izyumov
4.27 (11)
The indicator is designed for displaying the following price levels on the chart: Previous day's high and low. Previous week's high and low. Previous month's high and low. Each of the level types is customizable. In the indicator settings, you set line style, line color, enable or disable separate levels. The version of the exact same indicator but only with sound alerts there - Time Levels with Alerts . Configurations ----Day------------------------------------------------- DayLevels - enable
FREE
RSI vs Envelopes Graph
Yurij Izyumov
3 (3)
This semaphore indicator is based in the standard RSI, which is applied over the Envelopes indicator that shows an envelope or envelope fluctuation borders. This is a version of RSI vs Envelopes drawn in the symbol window . A sell signal emerges when the upper envelope/border is broken by the RSI indicator from top to bottom. A buy signal emerges when the lower envelope/border is broken by the RSI indicator from bottom upwards. The indicator can draw arrows on the indicator, draw vertical lines
FREE
Disconnect Alerts
Yurij Izyumov
5 (2)
If you execute or test an Expert Advisor on a laptop, personal computer or a VPS, you may face the situation when Internet connection is lost and the EA stops. Of course, this utility ( Disconnect Alerts ) will not help you restore the Internet connection, but it will gather the information and will send an alert to you about when and how long your terminal was without access to the Internet and did not actually work. After receiving such a notification, you can check your trades or think about
FREE
This indicator MA Alerts with Arrows gives you the opportunity to receive signals about the intersection of two moving averages (Moving Average), as well as signals about the price rollback to MA - to enter the transaction. Alert options: Sound and text alerts (alert). Push notification to the mobile terminal. Email notification (message to your e-mail).  Visual alert (arrows on the chart). The indicator has the following features: To display or hide the moving averages and arrows themselves.  T
Delta CCi MTF7
Yurij Izyumov
As the proper trading using CCI indicators requires the trader to monitor multiple timeframes and CCI indicators with different periods. For example - monitor the trend using CCI with the period of 100 or 200 ( slow CCI period ) on the H4 timeframe, and make entries based on the CCI with the period of 13 ( fast CCI period ) on the H1 timeframe. To facilitate this task, the Delta CCi MTF7 indicator was created, which implements monitoring the changes of the price movement trends as well as marks
RSI Alerts
Yurij Izyumov
5 (1)
Addition to the standard Relative Strength Index (RSI) indicator, which allows to configure various notifications about the events related with the indicator. For those who don't know what this indicator is useful for, read here . This version is for Metatrader 4, version for Metatrader 5 is here . Currently implemented events: Crossing from top to bottom - of the upper signal level (default - 70) - sell signal. Crossing from bottom to top - of the upper signal level (default - 70) - sell signal
The MarketView utility is designed to display the market changes in percents as a table over the specified time interval. Every column element can be disabled. The color scheme can be easily and quickly customized for your needs. The number of symbols in columns can be adjusted ( PerColumn ). The MarketView also allows to open chart of any symbol by simply clicking its name. It can automatically apply any customized template to the newly opened chart. Attention! In order to remove any symbol fro
Extremum catcher
Yurij Izyumov
1 (1)
The Extremum catcher indicator analyzes the price action after breaking the local Highs and Lows, generates price reversal signals with the ability to plot the Price Channel. If you need the version for MetaTrader 5, see Extremum catcher MT5 . The indicator takes the High and Low of the price over the specified period - 24 bars by default (can be changed). Then, if on the previous candle the price broke the High or Low level and the new candle opened higher than the extremums, then a signal will
You can avoid constant monitoring of computer screen waiting for the DeMarker signal while receiving push notifications to a mobile terminal or a sound alert on the screen about all required events, by using this indicator - DeMarker Alerts. In fact, it is the replacement of the standard indicator with which you will never miss the oscillator signals. If you don't know the benefits of DeMarker or how to use it, please read here . If you need signals of a more popular RSI indicator, use RSI Alert
MFI Alerts
Yurij Izyumov
If you use the MFI (Money Flow Index) indicator, the waiting time till the next signal can be long enough. Now you can avoid sitting in front of the monitor by using MFI Alerts. This is an addition or a replacement to the standard MFI oscillator . Once there appears an MFI signal on the required level, the indicator will notify you with a sound or push, so you will never miss a signal. This is especially significant if you follow the indicator in different timeframes and currency pairs, which ca
CCI Alerts
Yurij Izyumov
When using CCI (Commodity Channel Index) oscillator, the waiting time till the next signal can be long enough depending on a timeframe. CCI Alerts indicator prevents you from missing the indicator signals. It is a good alternative for the standard CCI indicator. Once there appears a CCI signal on the required level, the indicator will notify you with a sound or push, so you will never miss an entry. This is especially significant if you follow the indicator in different timeframes and currency p
RSI Panel MTF
Yurij Izyumov
The RSI Panel MTF indicator has been created in order to have the ability to monitor the values of the standard RSI indicator from a multitude of timeframes and symbols on a single chart, as well as to receive timely notifications about the trading opportunities using an audio signal or a notification. The indicator can output both the indicator values, and only the indicator signals (confirmed and expected). A user-friendly feature for selecting the required symbol has been implemented - simply
The indicator trades during horizontal channel breakthroughs. It searches for prices exceeding extreme points and defines targets using Fibo levels. The indicator allows you to create a horizontal channel between the necessary extreme points in visual mode quickly and easily. It automatically applies Fibo levels to these extreme points (if the appropriate option is enabled in the settings). Besides, when one of the extreme points and/or Fibo levels (50%) is exceeded, the indicator activates a so
This is an expanded version of the Time Levels indicator provided with sound alerts notifying of level intersection. The indicator is designed for displaying the following price levels on the chart: Previous day's high and low. Previous week's high and low. Previous month's high and low. Each of the level types is customizable. In the indicator settings, you set line style, line color, enable or disable separate levels. This version is provided with an option for alerting using an audio signal a
The indicator trades during horizontal channel breakthroughs. It searches for prices exceeding extreme points or bouncing back, monitors night flat and defines targets using customizable Fibo levels with a sound alert, which can be disabled if necessary. The indicator allows you to create a horizontal channel between the necessary extreme points in visual mode quickly and easily. It automatically applies your selected Fibo levels to these extreme points (if the appropriate option is enabled in t
This is а modified oscillator CCI (Commodity Channel Index) with all sorts of signals, alerts and arrows. The indicator is designed so that any signal of crossing any specified level does not escape you. This is a supplemented version of the CCI Alerts Indicator, which does not draw the CCI indicator window, but only draws the result of its work as arrows on the symbol graph. This version of CCI Alerts with Arrows is for MetaTrader 4. If you need signals from another popular RSI indicator, then
The indicator is a modification of RSI Alerts . However, it does not have a separate RSI indicator window. Instead, it uses signal arrows on the price chart. This saves space on the symbol chart, without affecting the quality of received signals and alerts. Similar to RSI Alerts, the indicator can generate sound alert, send push notifications and email messages, as well as draw signal arrows. The display of arrow can be disabled. If the arrows are enabled, they only display the signals chosen in
The indicator trades during horizontal channel breakthroughs. It searches for prices exceeding extreme points or bouncing back and defines targets using customizable Fibo levels with a sound alert, which can be disabled if necessary. The indicator allows you to create a horizontal channel between the necessary extreme points in visual mode quickly and easily. It automatically applies your selected Fibo levels to these extreme points (if the appropriate option is enabled in the settings). Besides
RSI Alerts MT5
Yurij Izyumov
Addition to the standard Relative Strength Index (RSI) indicator, which allows to configure various notifications about the events related with the indicator. For those who don't know what this indicator is useful for, read here . This version is for MetaTrader 5, MetaTrader 4 version - here . Currently implemented events: Crossing from top to bottom - of the upper signal level (default - 70) - sell signal. Crossing from bottom to top - of the upper signal level (default - 70) - sell signal. Cro
CCI Alerts MT5
Yurij Izyumov
When using CCI (Commodity Channel Index) oscillator, the waiting time till the next signal can be long enough depending on a timeframe. CCI Alerts indicator prevents you from missing the indicator signals. It is a good alternative for the standard CCI indicator. Once there appears a CCI signal on the required level, the indicator will notify you with a sound or push, so you will never miss an entry. This is especially significant if you follow the indicator in different timeframes and currency p
The Extremum catcher MT5 indicator analyzes the price action after breaking the local Highs and Lows and generates price reversal signals with the ability to plot the Price Channel. If you need the version for MetaTrader 4, see Extremum catcher . The indicator takes the High and Low of the price over the specified period - 24 bars by default (can be changed). Then, if on the previous candle, the price broke the High or Low level and the new candle opened higher than the extremums, then a signal
You can avoid constant monitoring of computer screen waiting for the DeMarker signal while receiving push notifications to a mobile terminal or a sound alert on the screen about all required events, by using this indicator - DeMarker Alerts. In fact, it is the replacement of the standard indicator with which you will never miss the oscillator signals. If you don't know the benefits of DeMarker or how to use it, please read here . If you need signals of a more popular RSI indicator, use RSI Alert
MFI Alerts MT5
Yurij Izyumov
5 (1)
If you use the MFI (Money Flow Index) indicator, the waiting time till the next signal can be long enough. Now you can avoid sitting in front of the monitor by using MFI Alerts. This is an addition or a replacement to the standard MFI oscillator . Once there appears an MFI signal on the required level, the indicator will notify you with a sound or push, so you will never miss a signal. This is especially significant if you follow the indicator in different timeframes and currency pairs, which ca
筛选:
yalewang
1120
yalewang 2023.05.03 11:36 
 

ggod

13022526
44
13022526 2023.01.17 08:28 
 

Non mi ha catturato .....

SandPaddict
129
SandPaddict 2022.09.24 17:08 
 

Simple but does exactly what it says it does. Thank you Aleksandr

80053930
464
80053930 2021.01.29 12:39 
 

under middel

Aravind Kolanupaka
8820
Aravind Kolanupaka 2020.11.22 21:11 
 

Simple and good!

Victor Manuel Valderrama Zamora
7343
Victor Manuel Valderrama Zamora 2019.04.19 02:45 
 

thanks for sharing

Tim Eubanks
5733
Tim Eubanks 2018.03.16 01:47 
 

This is an 50/50 coin flip indicator.

AlexanderSh
146
AlexanderSh 2017.11.13 15:25 
 

用户没有留下任何评级信息

Andrey Litvichenko
7559
Andrey Litvichenko 2017.10.29 05:12 
 

用户没有留下任何评级信息

Gennadiy Voltornist
11909
Gennadiy Voltornist 2017.10.22 19:40 
 

用户没有留下任何评级信息

Aleksandr Tamonin
4109
Aleksandr Tamonin 2017.08.03 20:31 
 

Хороший индикатор!

回复评论
版本 1.2 2021.11.26
перекомпиляция
版本 1.1 2019.08.24
Email notification has been added, as well as a sound alert has been fixed so that it does not give unnecessary signals.