Bermaui Deviation Percent
- 指标
- Muhammad Elbermawi
- 版本: 6.1
- 更新: 28 三月 2020
- 激活: 20
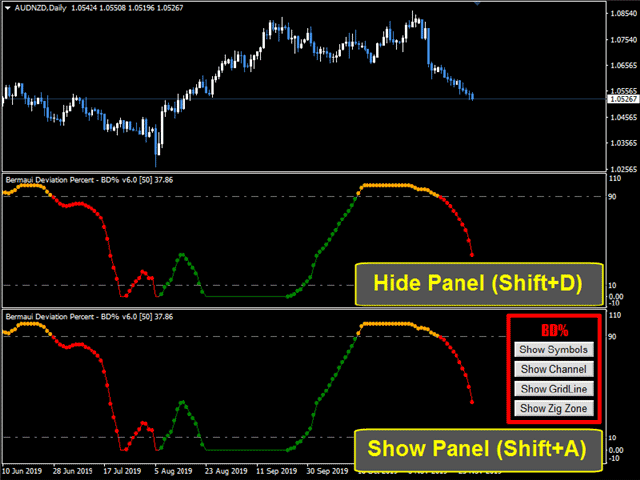
或者 ( BD% ) 这是一个波动率指数,以百分比而不是点来衡量波动率。 BD% 的想法是根据在 0% 和 100% 之间移动的经典标准偏差 (CSD) 创建一个索引。
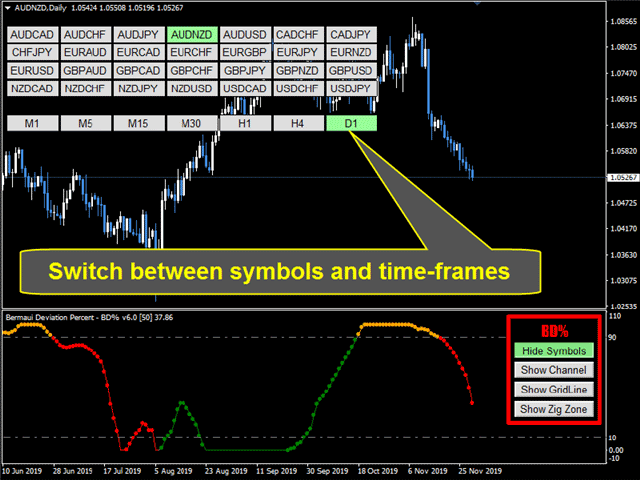
您可以使用 BD% 来比较同一证券在不同时间段或不同时间范围内的波动率。此外,您可以使用 BD% 以百分比而非点数来比较不同市场中不同证券之间的波动率。
如何使用“BD%”
要了解有关 BD% 的更多信息,请从此处阅读用户手册: https://www.mql5.com/en/blogs/post/718182
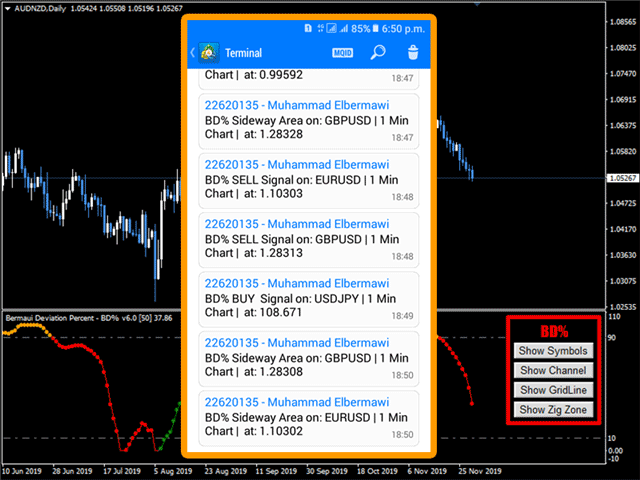
如果您有任何问题,请通过私信与我联系,或者在评论部分写下它们。
Muhammad Al Bermaui,CMT
您可以使用 BD% 来比较同一证券在不同时间段或不同时间范围内的波动率。此外,您可以使用 BD% 以百分比而非点数来比较不同市场中不同证券之间的波动率。
如何使用“BD%”
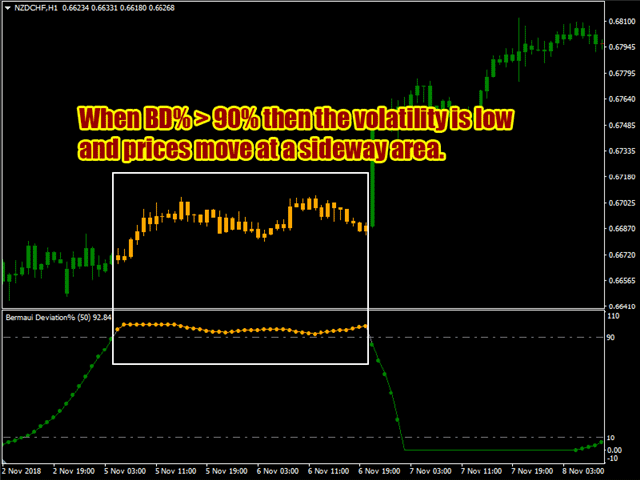
- 如果 BD% 低于 90%,然后向上越过该水平,则表明价格可能在区间内波动。
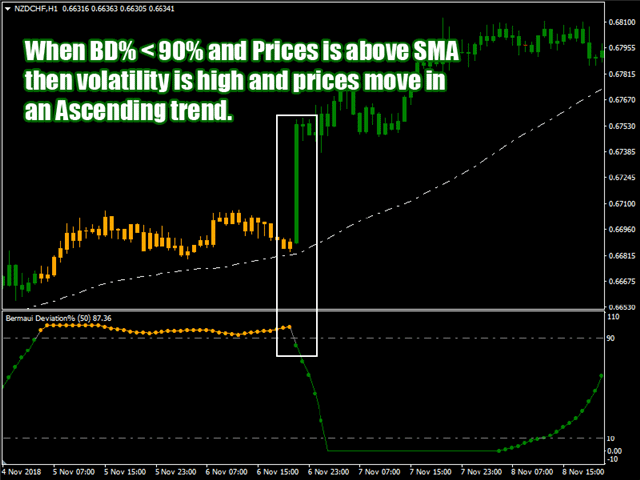
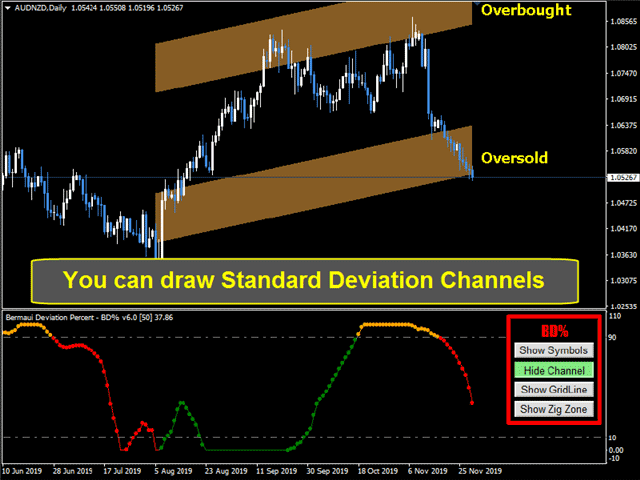
- 如果 BD% 高于 90%,然后向下穿过该水平,并且价格已经高于其简单移动平均线,则这是新的上升趋势开始的迹象。随着 BD% 进一步下行,波动性和趋势强度正在增加。当 BD% 为 0% 时,这意味着波动率处于最高值。
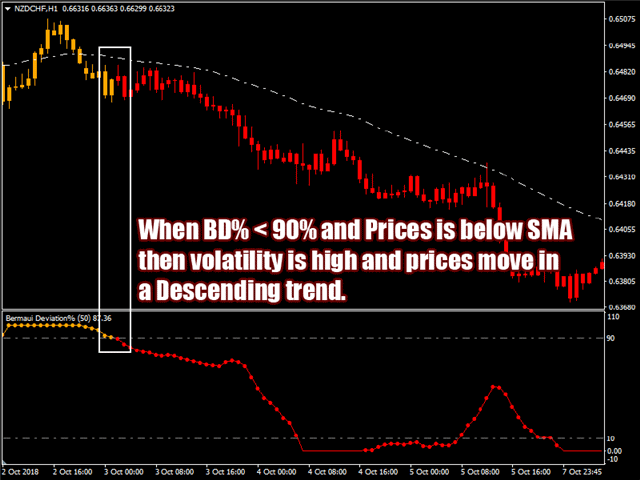
- 如果 BD% 高于 90%,然后向下穿过该水平,并且价格已经低于其简单移动平均线,则这是新的下降趋势开始的迹象。随着 BD% 进一步下行,波动性和趋势强度正在增加。当 BD% 为 0% 时,这意味着波动率处于最高值。
要了解有关 BD% 的更多信息,请从此处阅读用户手册: https://www.mql5.com/en/blogs/post/718182
如果您有任何问题,请通过私信与我联系,或者在评论部分写下它们。
Muhammad Al Bermaui,CMT


Fantastic filter/Momentum Indicator.