Corporate Report MT5
- 实用工具
- Pavel Verveyko
- 版本: 1.6
- 更新: 21 三月 2021
- 激活: 5
The script displays info about the share's corporate reports and dividends. The data is downloaded from investing.com:
- Report date
- Profit per share (EPS)
- Revenue
- Market capitalization
- Amount of dividends
- Date of payment of dividends
- Dividend income
The product cannot be tested in the tester (since it is not possible to receive data from the Internet).
Before launching: Add 2 URL https://ru.investing.com/earnings-calendar/Service/getCalendarFilteredData and https://ru.investing.com/dividends-calendar/Service/getCalendarFilteredData to the list of allowed URLs. Options -> Expert Advisors -> enable "Allow WebRequest for listed URL".
The program works the following way:
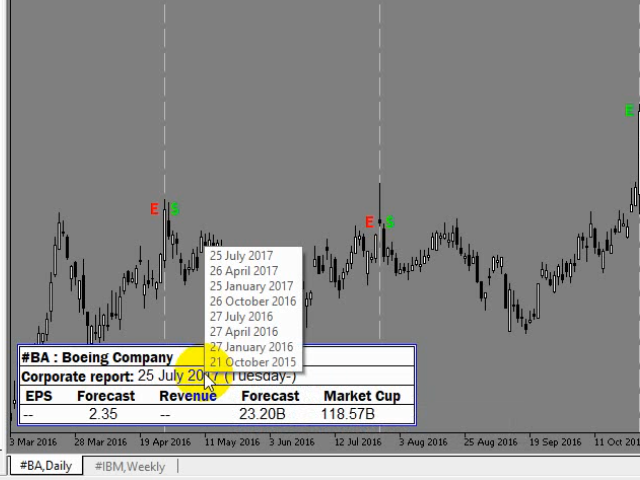
- Searches for information on the ticker on which the program is running.If the data is not found, it offers to use the search.Search by ticker - the ticker must be written in quotation marks, for example: "BA" or "ba".Search by company name - the company name should be written without quotation marks, for example: Apple or ford.All found options are displayed in the "Experts" tab.To display data on the chart, you need to enter the found number from the Experts tab (which is in square brackets) with the sign # for example: № 241 or #241.The numbers you have entered are remembered.if you want to change the previously selected number, then when the program asks "is this the right company?", you need to click no, and then find and enter a new number.to clear all pinned numbers, delete the "Custom Ticker List" file at the path "MQL5\Files\Corporate Report".
- While searching for information, the background of the graph changes color to blue.
- Plotting vertical lines corresponding to dates of the published reports about a dividends.
- Plotting vertical lines corresponding to dates of the published corporate reports. The tooltip of each of the lines contains data on the appropriate corporate report.
- The E and $ marks are assigned to vertical lines:
- if EPS value exceeds the forecast, the green E mark is used,
- if expectations are not met, the red one is used;
- if Revenue exceeds the forecast, the green $ mark is used,
- if expectations are not met, the red one is used.
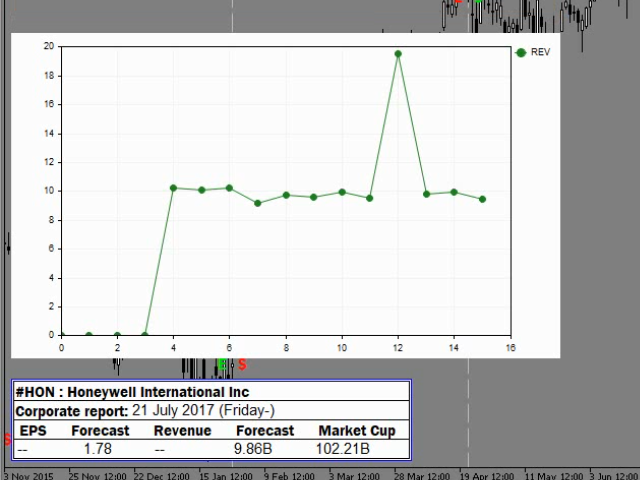
- The table at the bottom left displays: the ticker (on which the program has been launched) and company name (corresponds to the one downloaded from the website),
date and info on the expected report as well as the one published not earlier than 5 days ago.
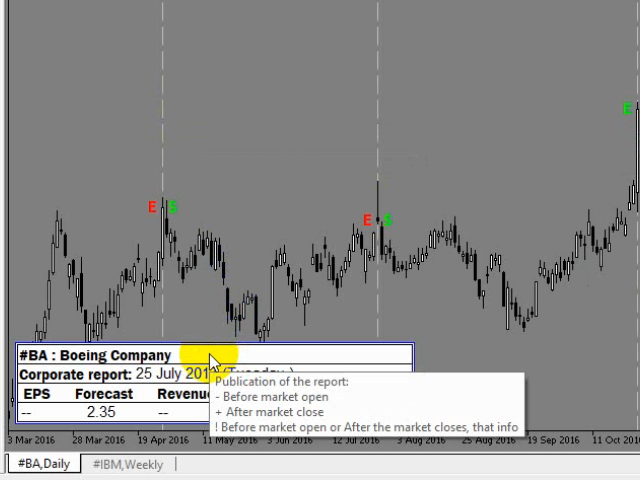
(5 days after releasing the report, it is moved to the chart as a vertical line and a search for the next report date starts.) - The +, - and ! marks at the report date specify the report issue time as follows:
- Report issue:
- - Before the market opening,
- + After the market closure,
- ! No data.
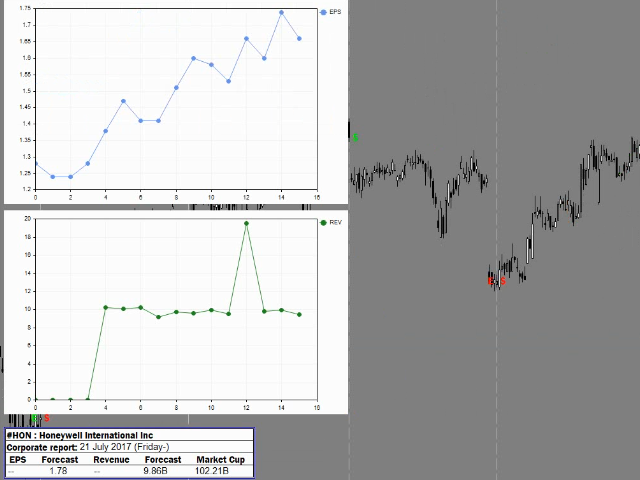
- Company indicator graphs are displayed on the chart (EPS and Revenue $). The graphs are plotted based on the downloaded reports and data present in the downloaded reports. If some report is missing on the website, the graph is based on available ones. If some indicator is missing in the downloaded report, its value is assumed to be zero on the graph. The graphs can be moved or deleted. Reports located in the table at the bottom left are not considered by the graphs. Only the ones displayed as horizontal lines on the chart are considered instead.
- The program works in English and Russian.
List of instruments (shares, stock, CFD, ADR) the program works with: 18 054 tickers; The list contains tickers of 80 countries.
The monitor vertical resolution of 900 or more is recommended when using the program for more comfortable trading.
The program and all the information used in it depend on the site investing.com and they work as long as it is possible to get information programmatically from the specified links.
For more convenience, assign a hotkey to the script: right-click "Corporate Report" in the Navigator window -> Set hotkey -> select a suitable combination. 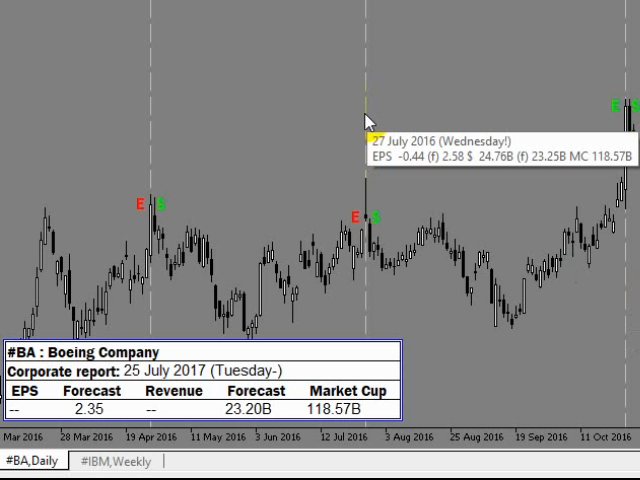


Very good product, allow you to analyze corporate stock reports directly on the chart