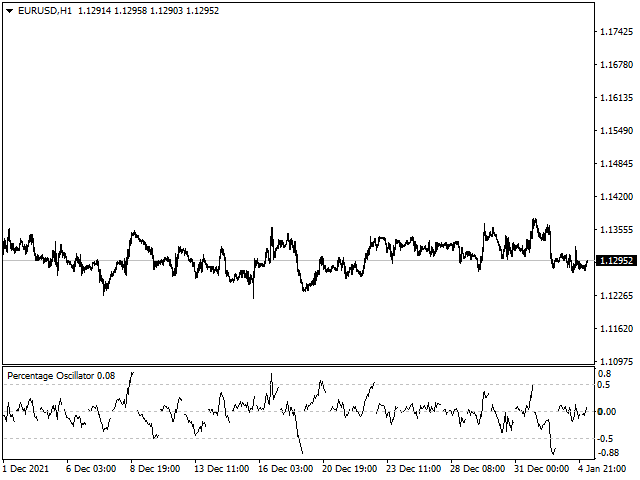
Percentage Oscillator
- 指标
- Alexandre Borela
- 版本: 1.4
- 更新: 24 一月 2022
如果你象这个项目一样,就有5个饥饿审查。
塔克的后续工作: borelatech
由于机构贸易量很大,因此它们不愿意努力设法争取。
在特定百分比上捍卫立场。
这些级别将成为你可以利用的自然支持和抵抗力。
进入贸易或了解对你立场的可能危险。
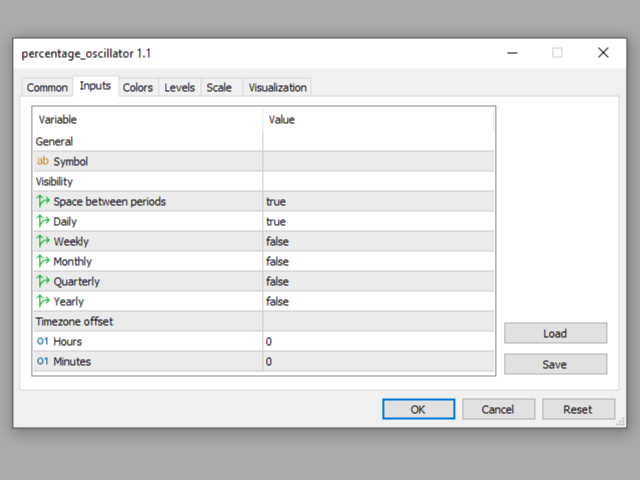
提名人将显示:
- 日。
- 周。
- Month.
- 资格。
- 年。
在你追踪你们的支持和抵抗的温床。
⠀⠀⠀⠀⠀⠀⠀⠀⠀⠀⠀⠀⠀⠀⠀⠀⠀⠀⠀⠀⠀⠀⠀⠀⠀⠀⠀⠀⠀⠀⠀⠀⠀⠀⠀⠀⠀⠀⠀⠀⠀⠀⠀⠀⠀⠀⠀⠀⠀⠀⠀⠀⠀⠀⠀⠀⠀⠀⠀⠀⠀⠀⠀⠀⠀⠀⠀⠀⠀⠀⠀⠀⠀⠀⠀⠀⠀⠀⠀⠀⠀⠀⠀⠀⠀⠀⠀⠀⠀⠀⠀⠀⠀⠀⠀⠀⠀⠀⠀⠀⠀⠀⠀⠀⠀⠀⠀⠀⠀⠀⠀⠀⠀⠀⠀⠀⠀⠀⠀⠀⠀⠀⠀⠀⠀⠀⠀⠀⠀⠀⠀⠀⠀⠀⠀⠀⠀⠀⠀⠀⠀⠀⠀⠀⠀⠀⠀⠀⠀⠀⠀⠀⠀⠀⠀⠀⠀⠀⠀⠀⠀⠀⠀⠀⠀⠀⠀⠀⠀⠀⠀⠀⠀
O fabricante disponibiliza indicadores muito precisos.