• 概述
  • 评论 (351)
  • 评论 (1135)
  • 新特性

Advanced Supply Demand

4.91

现在优惠 33%!

任何新手或专业交易者的最佳解决方案!

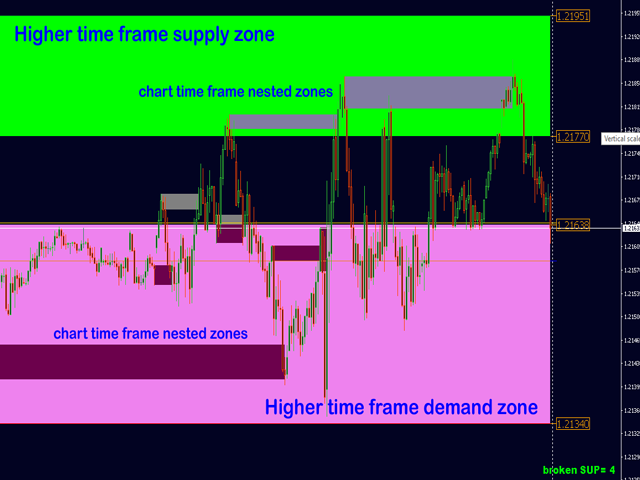
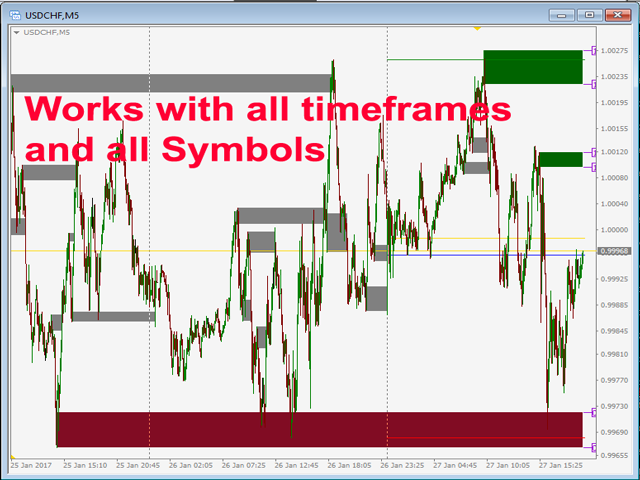
该指标是一款独特、高质量、且价格合理的交易工具,因为我们已经整合了许多专有功能和新公式。 依据此更新,您将能够显示双重时间帧区域。 您不仅可以显示一个较高的时间帧,还可以同时显示图表时间帧,加上更高的时间帧:显示嵌套时区。 供需双方所有交易者都会喜欢它。 :)


重要信息披露

高级供需的最大潜力,请访问https://www.mql5.com/zh/blogs/post/720245 

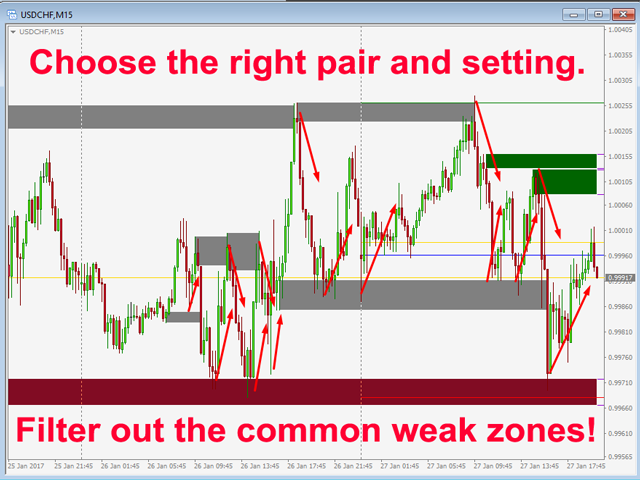
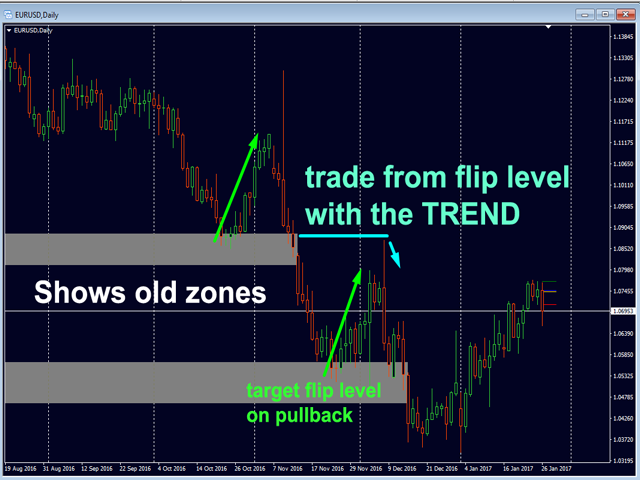
想象您的交易如何得以改善,是因为您能够精准定位入场或目标位吗? 构建于新的底层算法,它可以更轻松地识别出买卖双方之间的潜在失衡。 这是因为它以图形方式展示供需最强劲区域,及其过去的表现(显示旧区域)。 这些功能旨在帮助您更轻松地发现最佳入场区域和价位。

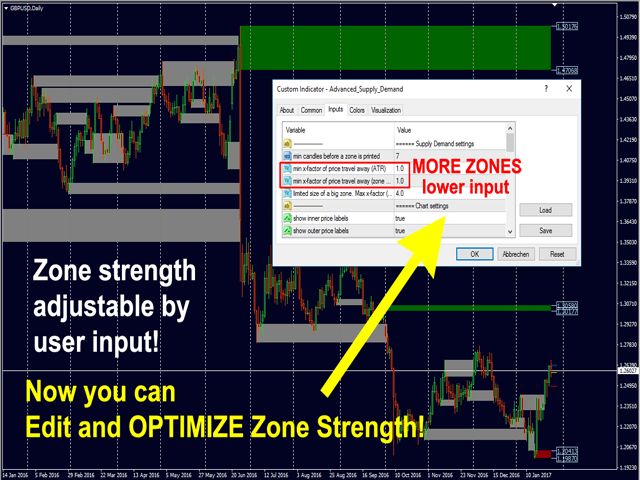
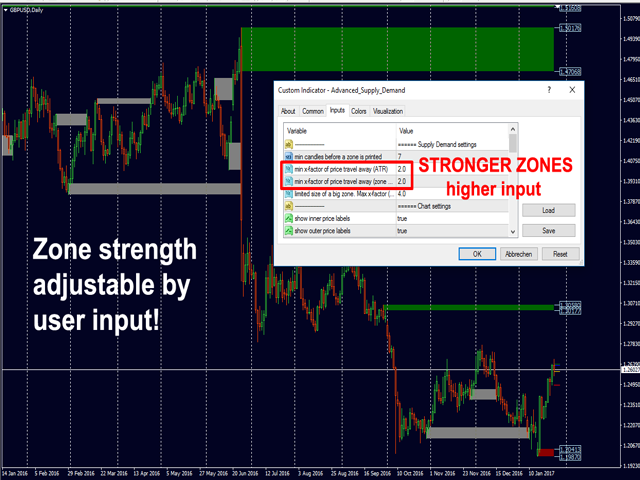
现在您可以针对您的交易品种和时间帧来优化和编辑区域强度!

高级供需指标适用于所有产品和时间帧。 它是一个新的公式,非常新的功能是两个区域强度函数可由用户输入进行调整! 这在交易中是一大优势。 当您学习如何使用专有功能,例如带有价格游离最小 X 因子的区域强度时,您能够判断该区域强劲与否。

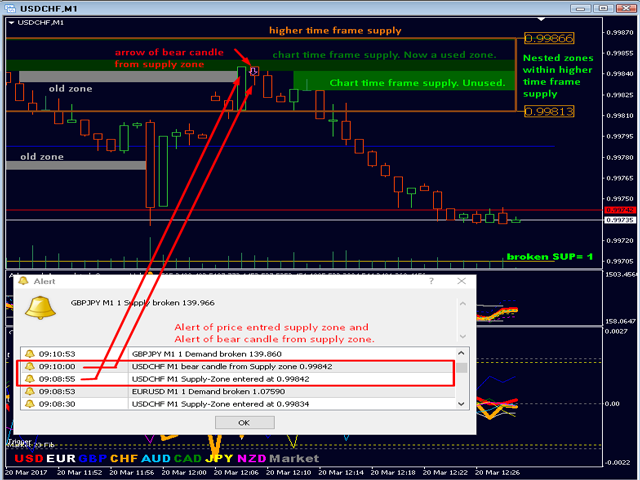
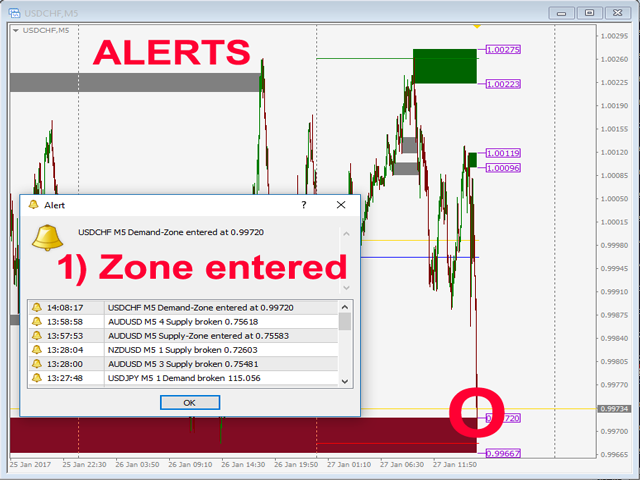
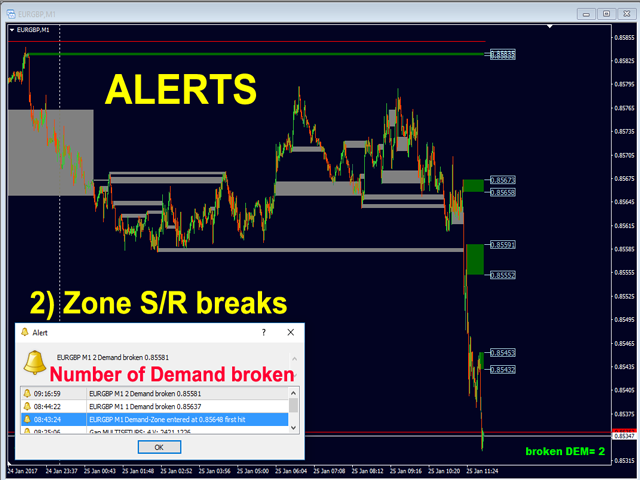
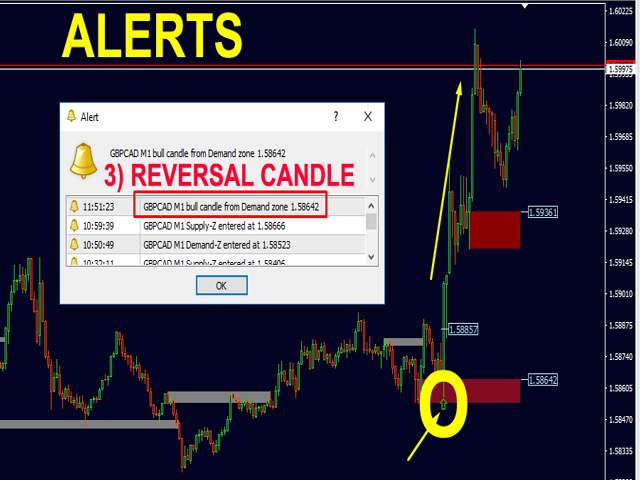
供需区域用作警报触发器。 您可以选择 3 种警报。 如果价格 1) 进入该区域,和/或 2) 突破该区域,和/或 3) 自该区域形成逆转蜡烛。 您可以在 MetaTrader 4 使用带声音的弹窗式警报,和/或推送电子邮件。 当您收到警报时,您就会知道作为交易者应该做什么。

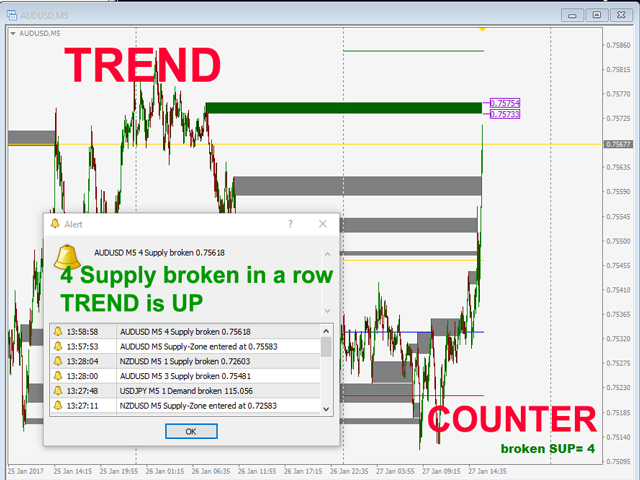
一条消息会告诉您一连串突破了多少个需求区域,如此您就能顺势交易并寻找趋势的延续。

该指标可以检测嵌套的供需区域!

一个非常强大的功能! 警报将告知供需区域是否嵌套(在)更高时间帧的供需区域内! 可以过滤掉嵌套区域的所有警报。


参数

供需设置:

  • 打印区域之前的最少蜡烛数(用于实时图表)。
  • 价格游离的最小 X 因子 (ATR)(数字越大,区域越强劲)。 针对您的品种和时间帧优化此处!
  • 价格游离的最小 Y 因子(区域大小)第二个输入:数字越大,区域越强劲。 针对您的品种和时间帧优化此处!
  • 一个大区域的极限大小。 最大系数 (ATR)(超大的大区域将会减少。 数字越大,所允许的区域尺寸越大)。

MTF 设置:

  • 加入更高的时间帧
  • 更高的时间帧周期(如果 MTF 等于或低于图表时间帧,采用较高的那个)
  • 打印区域之前的更高时间帧的最少蜡烛数
  • 价格游离的最小 X 因子 (ATR) MTF
  • 价格游离的最小 Y 因子(区域大小)MTF
  • 一个大区域的极限大小。 最大因子 (ATR) MTF(超大区域将会减少。 数字越大,所允许的区域尺寸越大)。
  • 显示内部价格标签 MTF
  • 显示外部价格标签 MTF

图标设置:

  • 显示内部价格标签。
  • 显示外部价格标签。
  • 显示老旧区域(供需计数器需要,见下文)。
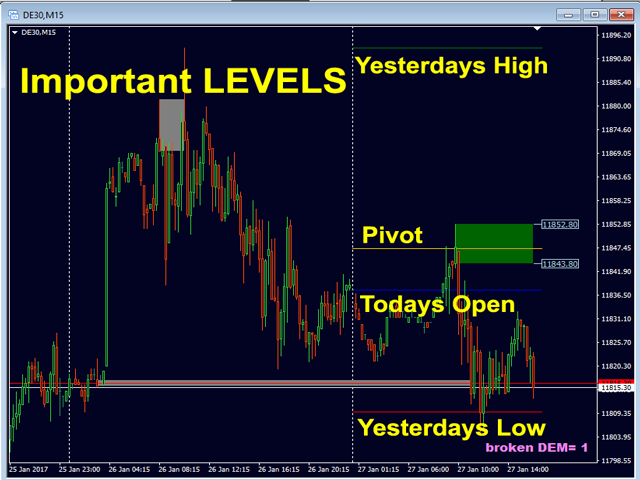
  • 显示昨天的最高价/最低价
  • 显示今天的轴点
  • 显示一连串突破供需区域数量(计数器)
  • 显示在上方角落
  • 在生鲜蜡烛上绘制延伸矩形

警报设置:

  • 警报区域命中
  • 警报区域突破
  • 区域逆向蜡烛警报
  • 仅嵌套区域警报! (位于 MTF)
  • 假突破警报
  • FBO 最小柱线点
  • FBO 柱线 收盘价回踩 % (20-90)
  • FBO 形态柱线计数 (1-3)
  • 弹窗式警报(MT4 弹窗和声音)
  • 发送电子邮件警报
  • 发送推送警报

颜色设置:

  • 您知道如何使用它。 每个区域都有自己的颜色。
    若要查看完整列表点击此处

其它设置:

  • 使用 PIN (用于 EA)
  • 显示供应区域的最大数量
  • 显示需求区域的最大数量
  • 若要查看完整列表点击此处

小贴士:

  1. 用户手册:点击这里
  2. 使用我的模板(见评论)。
  3. 针对您的交易品种和时间帧优化区域强度。
  4. 保持顺势。 该指标主要与我的其他专业货币强度指标之一配合使用。
  5. 查看个人资料上我的新闻和博客,了解交易系统和交易示例。

如果您有任何问题,我会随时为您提供帮助。

由衷地问候,Bernhard

评论 20
richard lindstrom
143
richard lindstrom 2024.10.02 13:10 
 

Great indicator & great support.

tgkaranja74
82
tgkaranja74 2024.06.21 00:22 
 

Loving this indicator so far. Excited at the possibilities.

Darryl Brown
248
Darryl Brown 2024.05.26 16:48 
 

This indicator is the best on MQL5 in my opinion. The reason why I believe that is because when you can combine it with other indicators it will improve your trading. If you want accurate entries and exits this is the indicator for you. Bravo Bernhard.....Bravo.

推荐产品
VR Cub
Vladimir Pastushak
VR Cub 这是获得高质量切入点的指标。该指标的开发是为了促进数学计算并简化对仓位入场点的搜索。多年来,该指标所针对的交易策略已被证明其有效性。交易策略的简单性是其巨大的优势,即使是新手交易者也能成功进行交易。 VR Cub 计算开仓点以及获利和止损目标水平,这显着提高了效率和易用性。查看使用以下策略进行交易的屏幕截图,了解简单的交易规则。 设置、设置文件、演示版本、说明、问题解决,可以从以下位置获取 [博客] 您可以在以下位置阅读或撰写评论 [关联] 版本为 [MetaTrader 5] 计算入场点的规则 开仓 要计算入场点,您需要将 VR Cub 工具从最后一个高点拉伸到最后一个低点。 如果第一个点在时间上早于第二个点,交易者等待柱线收于中线上方。 如果第一个点在时间上晚于第二个点,交易者等待柱线收于中线下方。 根据上述条件,严格在 柱线收盘 后建仓。 换句话说,如果我们在小时图上进行交易,那么从最高点到最低点的时间距离必须超过24小时,最高点和最低点之间的点数必须大于或等于平均价格变动每天。 维持和改变市场地位 可以有多个未平仓头寸;每个头寸都可以单独修改。 VR Cu
The indicator detects and displays 3 Drives harmonic pattern (see the screenshot). The pattern is plotted by the extreme values of the ZigZag indicator (included in the resources, no need to install). After detecting the pattern, the indicator notifies of that by a pop-up window, a mobile notification and an email. The indicator highlights the process of the pattern formation and not just the complete pattern. In the former case, it is displayed in the contour triangles. After the pattern is com
Supply and Demand Monster MT4
Tsog Erdene Borjigon Enkhkhudulmur
Supply and demand zones are at the heart of   supply and demand trading . These zones are areas that show  liquidity at a specific price.  The supply zone is also called the distribution zone, while the demand zone is called the accumulation zone.   Our indicator automatically draw supply and demand zones in Metatrader 5. It give opportunity to understand trading zone and avoiding risk.
Trend Ray
Andriy Sydoruk
The indicator shows the potential trend direction by cyclical-wave dependence. Thus, all the rays of the intersection will be optimal rays, in the direction of which the price is expected to move, taking into account the indicator period. Rays can be used as a direction for potential market movement. But we must not forget that the approach must be comprehensive, the indicator signals require additional information to enter the market.
El indicador "MR BEAST ALERTAS DE LIQUIDEZ" es una herramienta avanzada diseñada para proporcionar señales y alertas sobre la liquidez del mercado basándose en una serie de indicadores técnicos y análisis de tendencias. Ideal para traders que buscan oportunidades de trading en función de la dinámica de precios y los niveles de volatilidad, este indicador ofrece una visualización clara y detallada en la ventana del gráfico de MetaTrader. Características Principales: Canal ATR Adaptativo: Calcula
REX complete 3in1
Christophe Godart
This is the complete REX package. It consists of the lite, pro and ULTRA version.  Perfect for beginners and intermediates. REX complete is 100% non repaint. The strategy is based on a mix of different strategies, statistics, including pivot points, oscillators and patterns.  As the trading idea consists of a variety of some classic indicators like Momentum, Williams Percent Range, CCI, Force Index, WPR, DeMarker, CCI, RSI and Stochastic, it is clear that the fundamental indicators have being
Trend Catcher with Alert
Issam Kassas
4.71 (51)
趋势捕捉器: 具有警示指标的趋势捕捉器策略是一种多功能的技术分析工具,可帮助交易员识别市场趋势和潜在的进出点。它采用动态趋势捕捉器策略,根据市场条件进行调整,清晰地呈现趋势方向。交易员可以自定义参数,以符合其偏好和风险容忍度。该指标有助于识别趋势,发出潜在的反转信号,充当跟踪止损机制,并提供实时警报,以便及时应对市场。 具有警示指标的趋势捕捉器策略是一种多功能的技术分析工具,可帮助交易员识别市场趋势和潜在的进出点。它采用动态趋势捕捉器策略,根据市场条件进行调整,清晰地呈现趋势方向。交易员可以自定义参数,以符合其偏好和风险容忍度。该指标有助于识别趋势,发出潜在的反转信号,充当跟踪止损机制,并提供实时警报,以便及时应对市场。 特点: 趋势识别:信号牛市趋势和熊市趋势。 趋势反转:当蜡烛颜色从牛市变为熊市,反之亦然时,提醒可能的反转。 实时警报:为新趋势识别生成警报。 建议: 货币和货币对:EURUSD,AUDUSD,XAUUSD... 时间框架:H1。 账户类型:任何ECN,低点差账户。
FREE
Diamond Trend
Segundo Calvo Munoz
Indicator which identifies Trend and also buy/sell opportunities. Use for entries aligned to the Trend.  Although Diamond Trend is very accurate identifying entry points, it is always recommended to use a support indicator in order to reconfirm the operation. Remind to look for those Assets and Timeframes which best fit to your trader behavior/need... Valid for Scalping and Long Term operations. Please, set up a Bars Chart to be able to visualize the indicator properly...  ...And remind to give
FiboRec
Alfred Kamal
This indicator depends on Fibonacci lines but there is a secret lines i used them, by using FiboRec indicator you will be able to know a lot of important information in the market such as: Features You can avoid entry during market turbulence. You can enter orders in general trend only. You will know if the trend is strong or weak. Signal Types and Frame used You can use this indicator just on H1 frame. Enter buy order in case Candle break out the square area and closed over it, at least 20
Strong Retracement Points Pro demo edition! SRP (Strong Retracement/Reversal Points) is a powerful and unique support and resistance indicator. It displays the closest important levels which we expect the price retracement/reversal! If all level are broken from one side, it recalculates and draws new support and resistance levels, so the levels might be valid for several days depending on the market! If you are still hesitating to start using this wonderful tool, you can check this link to see h
BPSPanel
Remi Passanello
BPS Panel Breakout Pro Scalper Solution Panel This indicator is part of the   RPTrade Pro Solutions  systems. BPS Panel   is a daily trend indicator using Price Action, Dynamic Support and Resistances. It's designed to be used by anyone, even the absolute beginner in trading can use it. NEVER repaints . Indications are given   from close to close . Designed to   be used alone , no other indicators are required. Gives you the trend and potential Take Profit at the beginning of the day. How
PZ Penta O MT4
PZ TRADING SLU
The Penta-O is a 6-point retracement harmonacci pattern which usually precedes big market movements. Penta-O patterns can expand and repaint quite a bit. To make things easier this indicator implements a twist: it waits for a donchian breakout in the right direction before signaling the trade. The end result is an otherwise repainting indicator with a very reliable trading signal. The donchian breakout period is entered as an input. [ Installation Guide | Update Guide | Troubleshooting | FAQ | A
WanaScalper MT4
Isaac Wanasolo
1 (1)
A scalping indicator based on mathematical patterns, which on average gives signals with relatively small SL, and also occasionally helps to catch big moves in the markets (more information in the video) This indicator has three main types of notifications: The first type warns of a possible/upcoming signal on the next bar The second type indicates the presence of a ready signal to enter the market/open a position The third type is for SL and TP levels - you will be notified every time price r
Atomic Analyst
Issam Kassas
5 (2)
首先值得强调的是,该交易指标是非重绘、非延迟的指标,这使其成为手动和机器人交易的理想选择。 用户手册:设置、输入和策略。 Atomic Analyst是一种PA价格行动指标,利用价格的力量和动量来寻找市场上更好的机会。配备了高级过滤器,可帮助去除噪音和假信号,并提高交易潜力。使用多层复杂的指标,Atomic Analyst扫描图表,并将复杂的数学计算转化为任何初学者都能理解并用来做出一致交易决策的简单信号和颜色。 “Atomic Analyst”是专为新手和经验丰富的交易者量身定制的综合交易解决方案。它将高级指标和一流功能融合为一体的交易策略,使其成为所有类型交易者的多功能选择。 日内交易和剥头皮策略:专为快速准确的日内交易和短期交易而设计。 日内和摆动交易策略:可用作追求价格大幅波动的日内和摆动交易者的可靠工具。 多货币和市场:凭借其可靠的精度,在不同的工具和市场上运作。 多个时间框架:可在多个时间框架上使用,性能良好。 稳定性:所有指标均不重绘、不重绘和不滞后,确保可靠的信号。 信号清晰度:提供箭头信号,用于清晰的入场和出场点。 实时警报:通过交易入场、SL和TP警报通知交
Laser Trend
Nicolas Zouein
The trend is your friend! This is what this indicator is all about. Follow this famous saying and be safe. Characteristics: Buy/Sell signals fixed on the close of a bar. Works on all symbols and all timeframes. Clear visual market trend laser line, Buy/Sell signal arrows, market strength meter, TP1 & TP2 boxes. Visual signals when to enter, when to exit the market. No repainting. Compatible with Flexible EA for trading automation. (Ask for a free set file optimized to perform 2010-2018) Para
Indicator. "Indicator wave or Indicator Ma". Using 23 standard indicators and the author's algorithm, the levels of purchases (from 0 to +100) and sales (from 0 to -100) are calculated. Then, using the calculated levels, the "Wave Indicator" draws a wave with 21 moving averages. The wave number is equal to the averaging period of the calculated levels. Waves # 1 - 7 Fast Moving Averages Waves from No. 8 -14 moving averages Waves from No. 15-21 slow moving averages Looking at the figu
This is a new strategy for SUPPLY DEMAND areas It is based on a calculation using the tick volume to detect the big price action in market for both bear /bull actions this smart volume action candles are used to determine the supply and demand areas prices in between main supply and demand lines indicate sideway market  up arrows will be shown when prices moves above the main supply and the secondary supply lines Down arrows will be shown when prices moves below the main demand and the secondary
The indicator detects and displays Shark harmonic pattern (see the screenshot). The pattern is plotted by the extreme values of the ZigZag indicator (included in the resources, no need to install). After detecting the pattern, the indicator notifies of that by a pop-up window, a mobile notification and an email. The indicator highlights the process of the pattern formation and not just the complete pattern. In the former case, it is displayed in the contour triangles. After the pattern is comple
RTSPattern
Tomas Belak
The indicator provides a superior alternative to price action analysis. It enables the identification of normalized patterns, which are then transformed into a graphical representation to forecast future steps within a time series. In the top-left corner, you'll find information regarding the expected prediction accuracy, determined through a complex MSQE calculation. You have the flexibility to adjust the time window, making it easy to validate the indicator's performance. Additionally, you can
Trendiness Index
Libertas LLC
5 (3)
"The trend is your friend" is one of the best known sayings in investing, because capturing large trendy price movements can be extremely profitable. However, trading with the trend is often easier said than done, because many indicators are based on price reversals not trends. These aren't very effective at identifying trendy periods, or predicting whether trends will continue. We developed the Trendiness Index to help address this problem by indicating the strength and direction of price trend
Owl smart levels
Sergey Ermolov
4.34 (35)
MT5版本  |  FAQ Owl Smart Levels Indicator   是一個完整的交易系統,包含   Bill Williams   的高級分形、構建正確的市場波浪結構的 Valable ZigZag 以及標記準確入場水平的斐波那契水平等流行的市場分析工具 進入市場和地方獲利。 策略的详细说明 指示灯使用说明 顾问-贸易猫头鹰助手助理 私人用户聊天 ->购买后写信给我,我会将您添加到私人聊天中,您可以在那里下载所有奖金 力量在於簡單! Owl Smart Levels   交易系統非常易於使用,因此適合專業人士和剛開始研究市場並為自己選擇交易策略的人。 策略和指標中沒有隱藏的秘密公式和計算方法,所有策略指標都是公開的。 Owl Smart Levels 允許您快速查看進入交易的信號,突出顯示下訂單的水平並向您發送有關已出現信號的通知。 優點很明顯: 清楚地顯示主要和更高時間框架的趨勢方向。 指示儀器信號的出現。 標記開單、止損設置和固定利潤的水平。 沒有多餘的,只有必要的結構! ZigZag   表示全球趨勢的方向,因此也表示貿易方向。 市場反轉點的短線清楚地表明在
Black series MT4
Dmitriy Kashevich
1 (1)
Black series MT4 - The indicator is designed for trading on binary options with Timeframe M1-M5-M15 Multicurrency (Works on cryptocurrency and currency pairs) The signal appears when the candle opens Up to 90% correct signals There is no signal redrawing at all Can be used with other indicators. Good for scalping! In Settings there is: -Indicator working methods -I Allert Arrow color Red signal down Blue signal up Also watch the video how the indicator works and signals
The Th3Eng PipFinite indicator is based on a very excellent analysis of the right trend direction with perfect custom algorithms. It show the true direction and the best point to start trading. With StopLoss point and Three Take Profit points. Also it show the right pivot of the price and small points to order to replace the dynamic support and resistance channel, Which surrounds the price. And Finally it draws a very helpful Box on the left side on the chart includes (take profits and Stop loss
Fractal Zig Zag
Mikhail Nazarenko
A   professional version of the ZigZag indicator for visualizing the structure of price movements by fractals. Fractal ZigZag fixes the flaws of the standard version of the ZigZag indicator MT4. It uses Price action and a unique filtering algorithm to determine fractals. Suitable for all types of trading. Ideal for trading according to the WM pattern "Sniper" strategy !!! Features Marks the place of price reversal during the formation of a new fractal with specified parameters. Suitable for
Next level of trend trading here. Possibility 75%, the indicator analyzes the current market to determine short (small dot), middle (circle with a dot inside) and long (cross with a circle and a dot inside) trends.  Wingdings characters of  Aqua color represents the beginning of the UP trend. Wingdings characters of  Orange color represents the beginning of the DOWN trend. Possibility 75% Indicator will improve your trading in the world of forex, commodities, cryptocurrencies and indices.
Trend Scanner
Vladimir Kalendzhyan
4.33 (6)
By purchasing this indicator, you have the right to receive a free copy of one of   my other indicator's or advisor’s!  (All future updates are included. No limits) . To get it , please contact me by  mql5 message ! The Trend Scanner trend line indicator displays the trend direction and its changes. The indicator works on all currency pairs and  timeframes. The indicator simultaneously displays multiple readings on the price chart: the support and resistance lines of the currency pair, the exist
This indicator is another variant of the famous powerful indicator Fibonacci-SS https://www.mql5.com/en/market/product/10136 but has different behaviour in placing Pending Order and TP Line. Automatically places Fibonacci retracement lines from the last highest and lowest visible bars on the chart with: An auto Pending Order (Buy/Sell). Taking Profit 1, Taking Profit 2 is pivot point and Taking Profit 3 for extended reward opportunity. The best risk and reward ratio. Simple and powerful indica
RenkoMaStoch
Sergey Deev
1 (1)
The indicator displays renko bars on a chart, uses them to plot the fast and slow moving average and Stochastic, as well as it provides buy/sell signals: a buy signal is generated when the fast moving is above the slow one, and the signal line of Stochastic crosses the lower level from bottom up; a sell signal is generated when the fast moving is below the slow one, and the signal line of Stochastic crosses the upper level from top to bottom; Renko is a non-trivial price display method. Instead
Before
Nadiya Mirosh
The Before indicator predicts the most likely short-term price movement based on complex mathematical calculations. Most of the standard indicators commonly used in trading strategies are based on fairly simple calculations. This does not mean that there were no outstanding mathematicians in the world at the time of their creation. It is just that computers did not yet exist in those days, or their power was not enough for the sequential implementation of complex mathematical operations. Nowa
FreqoMeterForecast
Stanislav Korotky
The main idea of this indicator is rates analysis and prediction by Fourier transform. Indicator decomposes exchange rates into main harmonics and calculates their product in future. You may use the indicator as a standalone product, but for better prediction accuracy there is another related indicator - FreqoMaster - which uses FreqoMeterForecast as a backend engine and combines several instances of FreqoMeterForecast for different frequency bands. Parameters: iPeriod - number of bars in the ma
该产品的买家也购买
FX Volume
Daniel Stein
4.58 (33)
通过 mql5 和 Telegram 上 的 " 晨间简报 "获取每日市场更新,包括详细信息和屏幕截图 ! 外汇交易量(FX Volume)是第一个也是唯一一个从经纪商角度真正洞察市场情绪的交易量指标。 直接在您的图表上看到这些信息是真正改变游戏规则和突破性的交易解决方案。 受益于独特的市场数据洞察,如 比率(Ratios )显示货币多头和空头头寸的比率(百分比 比率变化 显示所选时间段内的多头比率及其百分比变化 总交易量 显示货币的总交易量(多头和空头),以手为单位 多头 交易量显示货币所有多头头寸的交易量 空头 交易量显示所有货币空头头寸的交易量 净多头 显示净多头交易量,即所有多头头寸减去所有空头头寸(以手为单位)。 净多头百分比 显示货币净多头交易量的变化 请阅读我们的基本教程 -> "如何使用外汇交易量进行交易 " 获取更多信息,如常见问题、交易技巧和教程视频,请访问我们的 外汇交易量公共信息频道 请 安装并运行 SI Connect 以建立与我们数据中心的持续连接 背景信息 我们都知道,外汇是一个分散的市场。这就是为什么我们必须打破常规思维,开发一个独
Scalper Inside PRO
Alexey Minkov
4.73 (56)
An exclusive indicator that utilizes an innovative algorithm to swiftly and accurately determine the market trend. The indicator automatically calculates opening, closing, and profit levels, providing detailed trading statistics. With these features, you can choose the most appropriate trading instrument for the current market conditions. Additionally, you can easily integrate your own arrow indicators into Scalper Inside Pro to quickly evaluate their statistics and profitability. Scalper Inside
TPSproTREND PrO
Roman Podpora
4.79 (19)
TPSpro TREND PRO 是一个趋势指标,可以自动分析市场并提供有关趋势及其每次变化的信息,并给出进入交易的信号而无需重新绘制! 该指标使用每根蜡烛,分别对其进行分析。指不同的脉冲——向上或向下脉冲。货币、加密货币、金属、股票、指数交易的准确切入点! MT5版本                 指标的完整描述   我们建议将其与 指示器 -   RFI LEVELS 一起使用 主要功能: 准确的输入信号,无需渲染! 如果出现信号,它仍然相关!这是与重提指标的一个重要区别,重提指标可以提供信号然后改变信号,这可能导致存款资金的损失。现在您可以以更高的概率和准确度进入市场。还有一个功能是在箭头出现后为蜡烛着色,直到达到目标(止盈)或出现反转信号。 显示止损/获利区域 为了提高搜索切入点时的视觉清晰度,创建了一个模块,该模块最初显示买入/卖出区域,在该区域中搜索进入市场的最佳点。用于处理止损水平的附加智能逻辑有助于随着时间的推移减小其大小,从而降低进入交易(移动 sl)时的初始风险。 显示较高时间范围内的最小值/最大值(MTF 模式) 添加了一项功能,可以显示较高时间间隔的最小
FX Power MT4 NG
Daniel Stein
5 (13)
通过 mql5 和 Telegram 上 的晨间简报获取每日市场更新,包括详细信息和屏幕截图 ! FX Power MT4 NG 是我们长期以来非常受欢迎的货币强度计算器 FX Power 的下一代产品。 这款下一代强度计算器能提供什么?您所喜爱的原版 FX Power 的所有功能 附加功能 黄金/XAU 强度分析 更精确的计算结果 可单独配置的分析周期 可自定义计算限制,以获得更好的性能 为希望查看更多信息的用户提供特殊的多实例设置 无尽的图形设置,可在每个图表中设置您最喜欢的颜色 无数的通知选项,让您再也不会错过任何重要信息 采用 Windows 11 和 macOS 风格的全新圆角设计 神奇的移动指标面板 FX Power 主要功能 所有主要货币的完整强势历史 所有时间框架内的货币强弱历史 所有经纪商和图表的计算结果完全相同 100% 可靠的实时计算 -> 无重绘 可通过下拉列表选择分析时段 通过自定义模式单独配置分析时段 可在一个图表中使用多个实例 可移动 FX Power 显示屏(通过拖放) 适用于高分辨率 QHD、UHD 和 4K 显示器 自动终端配置 针对平板电脑
TPSpro RFI Levels
Roman Podpora
4.82 (22)
指示       俄罗斯 -        英语   建议 与指示器一起使用     -       TPSpro 趋势专业版 -   MT4版本       交易中的一个关键要素是做出买卖交易工具决定的区域或水平。尽管主要参与者试图隐藏他们在市场中的存在,但他们不可避免地会留下痕迹。我们的任务是学习如何识别这些痕迹并正确解释它们。 主要功能: 向卖家和买家显示活跃区域! 该指标显示所有正确的初始买入和卖出脉冲水平/区域。激活这些水平/区域后,开始寻找切入点,水平会改变颜色并填充特定阴影。此外,还会显示箭头,以便更直观地了解情况。 显示更高时间范围内的级别/区域(MTF 模式) 添加了使用更高时间间隔显示级别/区域的功能。此外,该指标还具有自动趋势检测功能(   TPSproTREND PRO   )。 用于交易的单独专业的逐步算法。 该算法专为日内交易而设计,既可顺势交易,也可逆势交易。每个活动模板均提供详细说明。 适用于多种时间范围 。 TPSpro RFI 水平指标可用于图表上的任何时间范围,从一分钟(M1)开始一直到每月(MN)。 图形和声音警报。 该指标提供图形和声音指示
Apollo Pips PLUS SP
Oleg Rodin
5 (4)
请在购买产品之前阅读下面的信息! Apollo Pips PLUS SP 是一款独特的产品!它适合那些想要获得我的新“APOLLO PIPS”指标以及“超级包”奖金以及访问我所有交易指标的人! 通过购买 Apollo Pips PLUS SP 产品,您实际上购买的是全新版本的 Apollo Pips 指标。此版本的指标具有改进的算法和易于使用的参数,使您有机会在任何市场和任何交易风格中使用该指标。 该产品的购买者还可以免费访问我的所有其他指标,作为我的超级奖励!如果您想获得我所有的交易工具,那么该产品非常适合您!:) 但这还不是全部!:) 该产品的所有购买者也有资格免费获得我的新指标!:) 如果我有一个新的交易指标可用,您将能够在我的特权“SUPER PACK”终身奖金计划中完全免费获得它! 购买后请联系我以获得我的交易提示和超级礼包奖金!
目前八折优惠! 对任何新手或专家交易者来说都是最好的解决方案! 这个仪表板软件适用于28种货币对。它基于我们的两个主要指标(高级货币强度28和高级货币冲动)。它对整个外汇市场提供了一个伟大的概述。它显示高级货币强度值,货币运动速度和28个外汇对在所有(9)时间段的信号。想象一下,当你可以使用图表上的单一指标观察整个市场,以确定趋势和或剥头皮的机会时,你的交易将得到改善 我们已经在这个指标中建立了一些功能,使你更容易识别强势和弱势货币,同时识别和确认潜在的交易。该指标以图形方式显示货币的强势或弱势是增加还是减少,以及它在所有时间段的表现。 增加的新功能是动态市场斐波那契水平,它适应当前的市场条件变化,这是一个已经在我们的高级货币强度28和高级货币冲动指标中使用的成熟的加分项。 在交易时,总是将弱势货币和强势货币配对,这个新指标将帮助你做到这一点。 用户手册:点击这里  https://www.mql5.com/en/blogs/post/708783 特点  显示每个时间段的ACS28和GAP-speed(冲动)的货币强度值。 列:颜色代码以7种颜色
Currency Strength Exotics
Bernhard Schweigert
4.87 (30)
目前8折优惠! 对任何新手或专家交易者来说都是最好的解决方案! 这个指标是专门用来显示任何符号的货币强度,如异国货币对、商品、指数或期货。它是同类产品中的第一个,任何符号都可以添加到第9行,以显示黄金、白银、石油、DAX、US30、MXN、TRY、CNH等的真实货币强度。这是一个独特的、高质量的、负担得起的交易工具,因为我们已经纳入了一些专有的功能和一个新的公式。想象一下,你的交易将如何改善,因为你能够准确地确定新趋势或剥头皮机会的触发点? 用户手册:点击这里   https://www.mql5.com/en/blogs/post/708876 它适用于所有时间框架。你将很快能够看到TREND! 根据新的基础算法设计,它使识别和确认潜在交易变得更加容易。这是因为它以图形方式显示了8种主要货币和一种符号的强弱。 该指标显示了8种主要货币(澳元加元瑞士法郎欧元英镑日元新西兰美元)的强弱线,再加上一个符号! 该指标显示了符号的真实价值。例如:对于XAUUSD(黄金):价格以美元报价。如果黄金在上涨,你怎么能知道是黄金的强势还是美元的弱势?只有当黄金走强时,我们才会进行
Gann Swing Structure
Kirill Borovskii
5 (1)
This indicator is based on the mathematics of the great trader W.D. Ganna. With its help, you can easily find strong levels by analyzing swings to find the optimal entry point. The indicator works on all instruments and all timeframes. The indicator is fully manual and has control buttons. All you need to do is press the NEW button, a segment will appear, which you can place on any movement, swing or even 1 candle that you want to analyze. By placing the segment, press the OK button. A grid (th
Gold Channel XAUUSD
Paulo Rocha
5 (2)
Gold Channel is a volatility-based indicator, developed with a specific timing algorithm for the XAUUSD pair, which consists of finding possible corrections in the market. This indicator shows two outer lines, an inner line (retracement line) and an arrow sign, where the theory of the channel is to help identify overbought and oversold conditions in the market. The market price will generally fall between the boundaries of the channel. If prices touch or move outside the channel it is a tra
首先,值得强调的是,这个交易工具是非重绘、非重画和非滞后的指标,非常适合专业交易。 在线课程,用户手册和演示。 智能价格行动概念指标是一个非常强大的工具,既适用于新手,也适用于经验丰富的交易者。它将超过20个有用的指标合并到一个指标中,结合了高级交易思想,如内圈交易员分析和智能资金概念交易策略。该指标侧重于智能资金概念,提供有关大型机构交易方式的见解,帮助预测它们的动向。 它在流动性分析方面尤其擅长,有助于理解机构的交易方式。它擅长预测市场趋势,并仔细分析价格波动。通过将您的交易与机构策略对齐,您可以更准确地预测市场走向。该指标多才多艺,擅长分析市场结构,识别重要的订单区块,并识别各种模式。 它擅长识别BOS和CHoCH等模式,理解动量的转变,并突出显示供需强劲的关键区域。它还擅长发现强大的不平衡,并分析价格创造更高高点或更低低点的模式。如果您使用斐波那契回撤工具,该指标可以满足您的需求。它还可以识别相等的高点和低点,分析不同的时间框架,并通过仪表板显示数据。 对于使用更高级策略的交易者,该指标提供了工具,如公平价值差指标和优惠和折扣区域的识别。它特别关注高时间框架订单
M1 Gold
Abdulkarim Karazon
Enigmera
Ivan Stefanov
5 (3)
ENIGMERA:市场核心 https://www.enigmera.com 简介 该指标和交易系统是金融市场的一种非凡方法。ENIGMERA 利用分形周期精确计算支撑位和阻力位。它能显示真实的累积阶段,并给出方向和目标。 该系统无论在趋势中还是在修正中都能发挥作用。 它是如何运行的? ENIGMERA 由三条线组成:支撑/阻力线、目标线和偏离线。与一般市场指标将过去的数据推断为现在和未来的情况不同,该系统能提供当前的完整情况。如果你处于支撑位,这意味着真正的支撑;如果你处于阻力位,这意味着真正的阻力。如果突破某一水平,则表示趋势发生变化。没有重绘。 由于市场在不断变化,ENIGMERA 不断调整其评估工具,定期修改策略。  这保证了每种情况都能得到全面评估。这一市场指标的独特性显而易见,其能力不言而喻。  ENIGMERA 为金融分析师和咨询师提供服务,他们需要可靠的见解与客户分享,也为投资者提供服务,他们需要最精确和最可靠的保证。 该系统能够达到最佳精度,使交易者能够自信、清晰地评估他们的选择。 ENIGMERA 将 20 年的交易专长和知识整合到一个综合软件
MetaBands M4
Vahidreza Heidar Gholami
5 (2)
MetaBands使用强大且独特的算法绘制通道并检测趋势,以便为交易者提供进出交易的潜在点。它是一个通道指标和强大的趋势指标。它包括不同类型的通道,可以通过使用输入参数简单地合并以创建新通道。MetaBands使用所有类型的警报通知用户市场事件。 功能 支持大多数通道算法 强大的趋势检测算法 能够合并不同类型的通道 多时间帧和多货币(信号矩阵) 所有类型的警报功能(声音、屏幕闪烁、推送通知、电子邮件、弹出窗口、箭头) 它永远不会重绘 趋势检测 MetaBands使用在通道内振荡的蓝色线来检测趋势。当该线遇到通道的上界时,表明开始下跌趋势,当它遇到下界时,表明开始上涨趋势。如果蓝线接近中线,则市场处于整理期。 该指标使用独特的方法来检测趋势。一开始可能看起来有些复杂,但如果您观看视频教程,您就会意识到它是多么强大且易于使用。 入场和出场信号 当趋势变化或价格穿过上下通道时,MetaBands会立即通过不同的方法提醒交易者,这些方法可以在指标设置中启用。 信号矩阵 要监视来自不同时间框架的多个符号并在一个地方查看信号,请单击右上角按钮或按键盘上的M键以打开信号矩阵。该矩阵可以
Shepherd Harmonic Pattern
Abdullah Alrai
4.65 (49)
这个指标将检测手动和自动方法在图表上绘制的谐波模式。 您可以从此链接查看用户手册: 添加您的评论并联系我们以获得它 有一个免费版本可以在mt4上尝试此产品。 您可以使用它来检测Gartley和Nenstar模式: https://www.mql5.com/en/market/product/30181 您可以从以下链接购买完整的MT4版本: https://www.mql5.com/en/market/product/15212 注意 指标具有控制面板,并将保存每个(图表和时间框架)设置。 您可以将其最小化以在图表上获得更多空间,并且如果您更喜欢使用其他分析工具,则可以按关闭按钮隐藏所有指标数据 当您使用此指标并更改设置,添加诸如移动平均线或布林带之类的指标时,此指标将自动保存您的模板编辑,并且您可以随时加载它们。 如果您使用的是Windows 10,请右键单击MetaTrader图标>兼容性>更改高DPI设置>系统(增强)以获得最佳屏幕设置(应在高清设备中完成)。 指标只是谐波交易理论的解释,用于检测图表上的谐波模式。 如果您想学习它,可以搜索Scott Carney的书,名为“Ha
介绍 ON Trade Waves Patterns Harmonic Elliot Wolfe,这是一款高级指标,旨在使用手动和自动方法检测各种市场模式。以下是它的工作原理: 谐波模式: 该指标可以识别出现在您图表上的谐波模式。这些模式对于练习谐波交易理论的交易者非常重要,正如Scott Carney的书《谐波交易第1卷和第2卷》所描述的那样。无论您是手动绘制它们还是依赖自动检测,ON Trade Waves Patterns都可以胜任。 控制面板: 我们配备了一个用户友好的控制面板,它会保存您的图表和时间帧设置,使您可以轻松切换不同配置。您甚至可以最小化它以最大化图表空间。如果您更喜欢使用其他分析工具,只需单击关闭按钮即可隐藏所有指标数据。 模板保存: 当您自定义设置或添加其他指标,如移动平均线或布林带时,该指标会自动保存您的模板。这意味着您可以随时轻松加载您喜欢的设置。 优化显示: 对于Windows 10用户,我们建议调整您的DPI设置以获得高清设备上的最佳屏幕体验。右键单击MetaTrader图标,选择“兼容性”,然后选择“更改高DPI设置”,将其设置为“系统(增强)”。
Quantum Trend Sniper Indicator MT4
Bogdan Ion Puscasu
4.64 (36)
介绍   量子趋势狙击指标 ,突破性的 MQL5 指标,正在改变您识别和交易趋势反转的方式!由拥有超过13年交易经验的资深交易员团队开发,     量子趋势狙击指标   旨在通过其创新的方式以极高的准确度识别趋势反转,将您的交易之旅推向新的高度。 ***购买量子趋势狙击指标,即可免费获得量子突破指标!*** 当量子突破指标识别出趋势反转时,它会向您发出警报和信号箭头,并建议您三个止盈水平。 它既适合新手交易者,也适合专业交易者。 量子 EA 通道:       点击这里 MT5版本:       点击这里 建议: 时间范围:  所有时间范围。为了获得最佳结果,我们建议在 M15、M30 和 H1 时间范围内使用它。 货币对:欧元兑美元、英镑兑美元、澳元兑美元、欧元兑英镑, EURAUD, XAUUSD 账户类型:ECN、Raw 或 Razor,点差极低 经纪时间:任意 经纪商:IC Markets、Pepperstone with Raw 和 Razor 的点差最低 建议止损:50 点 建议止盈水平:20 点、50 点和 1
All in One Trade
Alexey Minkov
4.48 (27)
The All-in-One Trade Indicator (AOTI) determines daily targets for EURUSD, EURJPY, GBPUSD, USDCHF, EURGBP, EURCAD, EURAUD, AUDJPY, GBPAUD, GBPCAD, GBPCHF, GBPJPY, AUDUSD, and USDJPY. All other modules work with any trading instruments. The indicator includes various features, such as Double Channel trend direction, Price channel, MA Bands, Fibo levels, Climax Bar detection, and others. The AOTI indicator is based on several trading strategies, and created to simplify market analysis. All-in-One
Dynamic Forex28 Navigator
Bernhard Schweigert
5 (1)
Dynamic Forex28 Navigator - 下一代外汇交易工具。 当前 49% 折扣。 Dynamic Forex28 Navigator 是我们长期流行的指标的演变,将三种功能合二为一: 高级货币强度 28 指标 (695 条评论)+ 高级货币 IMPULSE 带警报 (520 条评论)+ CS28 组合信号(奖励)。 有关指标的详细信息 https://www.mql5.com/en/blogs/post/758844 下一代强度指标提供什么? 您喜欢的原始指标的一切,现在通过新功能和更高的精度进行了增强。 主要特点: 专有货币强度公式。  所有时间范围内的平滑和准确的强度线。 非常适合识别趋势和精确进入。 动态市场斐波那契水平(市场斐波那契)。  此指标独有的独特功能。 斐波那契应用于货币强度,而不是价格图表。 适应实时市场活动以获得准确的反转区域。 实时市场动量。  第 9 行显示市场是活跃还是被动。 对于定时交易至关重要。 全面的警报和显示。  每种货币最强的买入和卖出动量。 ​​28 对的双重动量买入和卖出。 超买/超卖警告外部范围
MetaTrader 4 的 Ultimate Gold Advisor Ultimate Gold Advisor 是一个先进的技术工具,旨在优化 MetaTrader 4 上的交易体验。为了满足经验丰富的交易者的需求,该指标结合了精准度、复杂的分析和多功能性,为做出明智的交易决策提供支持。它不仅适用于黄金交易,还可用于广泛的资产类别,Ultimate Gold Advisor 能帮助你提升市场策略。 Ultimate Gold Advisor 为什么是交易者的好工具? 先进的性能: 结合多个指标,清晰显示每笔交易的结果,你可以透明地查看策略的表现。这让你能够优化你的方法,做出更明智的决策。 即时和可视的交易信号: 图表上的红色和蓝色箭头标记了潜在的买入和卖出机会。 这些视觉信号易于理解,能快速帮助你识别关键行动时刻。 实时点差追踪: Ultimate Gold Advisor 以点数(pips)测量价格变动,让你能够实时评估市场变化。这有助于你更准确地计划交易,并跟踪策略的进展。 趋势检测技术: 指标通过图表上的虚线跟踪主要市场趋势。 这使你能更好地理解市场波动和方向变化,基于市场
Automated Trendlines
Georgios Kalomoiropoulos
5 (16)
趋势线是外汇交易中最重要的技术分析工具。不幸的是,大多数交易者没有正确绘制它们。自动趋势线指标是专业交易者的专业工具,可帮助您可视化市场的趋势运动。 有两种类型的趋势线看涨趋势线和看跌趋势线。 在上升趋势中,外汇趋势线是通过价格变动的最低摆动点绘制的。 连接至少两个“最低点”将创建一条趋势线。 在下跌趋势中,趋势线是通过价格走势的最高摆动点绘制的。 连接至少两个“最高点”将创建一条趋势线。 趋势线何时突破? 当看跌蜡烛收于看涨​​趋势线下方并且蜡烛的高点在趋势线上方时,看涨趋势线会被打破。 当看涨蜡烛收于看跌趋势线上方并且蜡烛的低点低于趋势线时,看跌趋势线会被打破。 趋势线何时删除? 当一根完整的蜡烛在看涨趋势线下方形成时,看涨趋势线将被删除。 当完整的蜡烛在看跌趋势线上方形成时,看跌趋势线将被删除。 您可以从输入参数更改看涨和看跌趋势线的颜色和宽度。
Dear traders I am happy to introduce to you my new tool called "Brilliant Oscillator" Indicator. This is one of the indicators that can be used as a stand alone indicator. WHAT I LIKE ABOUT THIS TOOL IS Fast and reliable signals Purpose The purpose of this tool is to assist both newbie and Advanced traders to analyze the market with high level of accuracy in both bearish and bullish market trends. The inputs In the input section you will be able to change colors of the indicator only. Currency p
Wave Scalping
Vitalyi Belyh
Wave Scalping indicator is a short-term trading strategy based on a wave system. It includes a wave line, entry points and position tracking. Signal arrows appear when a candle closes. It works without repainting. It consists of a wave line along which signal arrows are built, and arrows - confirmation of directions after the signal arrows. Signal arrows are built taking into account the direction of the trend direction. When confirming signal arrows, there are several types of alerts. To
Cycle Sniper
Elmira Memish
4.39 (36)
NEW YEAR SALE PRICE FOR LIMITED TIME!!! Please contact us after your purchase and we will send you the complimentary indicators to complete the system Cycle Sniper is not a holy grail but when you use it in a system which is explained in the videos, you will feel the difference. If you are not willing to focus on the charts designed with Cycle Sniper and other free tools we provide, we recommend not buying this indicator. We recommend watching the videos about the indiactor and system before pu
Th3Eng PipFinite Pro
Ahmed Farag
5 (2)
Th3Eng PipFinite PRO Indicator This product is distinct from the Th3Eng PipFinite Original, utilizing a different logic and algorithms. The Th3Eng PipFinite Pro indicator offers analysis of trend directions using custom algorithms. It provides indications of trend direction, entry points, a stop loss point, and three take profit points. The indicator also displays pivot points, dynamic support and resistance channels, and a side-box with detailed current signal information. How to Trade with
TrendfollowerSR
Paul Reymkhe
4.88 (90)
Take Your Trading Experience To the Next Level ! and get the exclusive TFSR-Analyzer for free !    So you have all these outstanding features  on up to 20 symbols and all timeframes in a smart and clear Design. Correct identification of the trends  in stock investments are pivotal and TrendFollowerSR ensures this perspective while displaying the correct trend on multiply timeframes to help you go long way as much as possible. The latest technology of the Indicator enables to track whether if
TrendMaestro
Stefano Frisetti
5 (3)
note: this indicator is for METATRADER4, if you want the version for METATRADER5 this is the link:  https://www.mql5.com/it/market/product/108106 TRENDMAESTRO ver 2.4 TRENDMAESTRO recognizes a new TREND in the bud, he never makes mistakes. The certainty of identifying a new TREND is priceless. DESCRIPTION TRENDMAESTRO identifies a new TREND in the bud, this indicator examines the volatility, volumes and momentum to identify the moment in which there is an explosion of one or more of these data a
Volume by Price MT4
Brian Collard
4.64 (11)
The Volume by Price Indicator for MetaTrader 4 features Volume Profile and Market Profile TPO (Time Price Opportunity). Volume and TPO histogram bar and line charts. Volume Footprint charts. TPO letter and block marker collapsed and split structure charts. Static, dynamic and flexible range segmentation and compositing methods with relative and absolute visualizations. Session hours filtering and segment concatenation with Market Watch and custom user specifications. Graphical layering, positio
GOLD Impulse with Alert
Bernhard Schweigert
4.56 (9)
这个指标是我们2个产品 Advanced Currency IMPULSE with ALERT  +   Currency Strength Exotics 的一个超级组合。 它适用于所有时间框架,并以图形方式显示8种主要货币和一种符号的强势或弱势冲动! 该指标专门用于显示任何符号的货币强度加速,如黄金、异国货币对、商品、指数或期货。这是它的第一个指标,任何符号都可以被添加到第9行,以显示黄金、白银、石油、DAX、US30、MXN、TRY、CNH等的真实货币强度加速(冲动或速度)。 建立在新的基础算法上,它使识别和确认潜在的交易更加容易。这是因为它以图形方式显示了一种货币的强势或弱势是否正在加速,并测量了这种加速的速度--把它想象成你汽车中的速度表。当你加速时,事情显然会发生得更快,这在外汇市场上也是一样的,即如果你配对的货币正在向相反的方向加速,你就会发现一个潜在的有利可图的交易。 动态市场斐波那契28水平被用作警报触发器,将适应市场活动。如果冲动击中黄色触发线,你将收到警报。然后你就知道作为一个交易员应该做什么。货币对和方向已经给出。只需点击警报按钮,就可以
Supply and Demand Dashboard PRO
Bernhard Schweigert
4.8 (20)
目前八折优惠! 这个仪表板是一个非常强大的软件,可用于多个符号和多达9个时间段。 它是基于我们的主要指标(最佳评论:高级供应需求)。 Advanced Supply Demand 该仪表板提供了一个伟大的概述。它显示。   筛选后的供需值,包括区域强度评级。 区间内和区间外的点位距离。 它突出了嵌套的区域。 在所有(9个)时间段内,它对所选符号发出4种警报。 它是高度可配置的,以满足您的个人需求! 您的利益! 对每个交易者来说,最重要的问题是。 什么是入市的最佳水平? 在强大的供应/需求区域内或附近进入你的交易,以获得最佳的成功机会和风险/回报。 我的止损的最佳位置是哪里? 把你的止损放在强势供应/需求区的下方/上方是最安全的。 我的最佳盈利目标是什么? 你的退出策略和你的进入策略一样重要,了解更高的时间框架图可以帮助你。对于买入,使用下一个供应区作为目标,对于卖出,使用下一个需求区作为目标。在回撤到供应区或需求区时进场,以确保有足够的利润空间,达到更高的时间框架的供应和需求,将增加你的利润。 为什么我们要过滤强区和
作者的更多信息
目前八折优惠! 对任何新手或专家交易者来说都是最好的解决方案! 这个仪表板软件适用于28种货币对。它基于我们的两个主要指标(高级货币强度28和高级货币冲动)。它对整个外汇市场提供了一个伟大的概述。它显示高级货币强度值,货币运动速度和28个外汇对在所有(9)时间段的信号。想象一下,当你可以使用图表上的单一指标观察整个市场,以确定趋势和或剥头皮的机会时,你的交易将得到改善 我们已经在这个指标中建立了一些功能,使你更容易识别强势和弱势货币,同时识别和确认潜在的交易。该指标以图形方式显示货币的强势或弱势是增加还是减少,以及它在所有时间段的表现。 增加的新功能是动态市场斐波那契水平,它适应当前的市场条件变化,这是一个已经在我们的高级货币强度28和高级货币冲动指标中使用的成熟的加分项。 在交易时,总是将弱势货币和强势货币配对,这个新指标将帮助你做到这一点。 用户手册:点击这里  https://www.mql5.com/en/blogs/post/708783 特点  显示每个时间段的ACS28和GAP-speed(冲动)的货币强度值。 列:颜色代码以7种颜色
Currency Strength Exotics
Bernhard Schweigert
4.87 (30)
目前8折优惠! 对任何新手或专家交易者来说都是最好的解决方案! 这个指标是专门用来显示任何符号的货币强度,如异国货币对、商品、指数或期货。它是同类产品中的第一个,任何符号都可以添加到第9行,以显示黄金、白银、石油、DAX、US30、MXN、TRY、CNH等的真实货币强度。这是一个独特的、高质量的、负担得起的交易工具,因为我们已经纳入了一些专有的功能和一个新的公式。想象一下,你的交易将如何改善,因为你能够准确地确定新趋势或剥头皮机会的触发点? 用户手册:点击这里   https://www.mql5.com/en/blogs/post/708876 它适用于所有时间框架。你将很快能够看到TREND! 根据新的基础算法设计,它使识别和确认潜在交易变得更加容易。这是因为它以图形方式显示了8种主要货币和一种符号的强弱。 该指标显示了8种主要货币(澳元加元瑞士法郎欧元英镑日元新西兰美元)的强弱线,再加上一个符号! 该指标显示了符号的真实价值。例如:对于XAUUSD(黄金):价格以美元报价。如果黄金在上涨,你怎么能知道是黄金的强势还是美元的弱势?只有当黄金走强时,我们才会进行
Dynamic Forex28 Navigator
Bernhard Schweigert
5 (1)
Dynamic Forex28 Navigator - 下一代外汇交易工具。 当前 49% 折扣。 Dynamic Forex28 Navigator 是我们长期流行的指标的演变,将三种功能合二为一: 高级货币强度 28 指标 (695 条评论)+ 高级货币 IMPULSE 带警报 (520 条评论)+ CS28 组合信号(奖励)。 有关指标的详细信息 https://www.mql5.com/en/blogs/post/758844 下一代强度指标提供什么? 您喜欢的原始指标的一切,现在通过新功能和更高的精度进行了增强。 主要特点: 专有货币强度公式。  所有时间范围内的平滑和准确的强度线。 非常适合识别趋势和精确进入。 动态市场斐波那契水平(市场斐波那契)。  此指标独有的独特功能。 斐波那契应用于货币强度,而不是价格图表。 适应实时市场活动以获得准确的反转区域。 实时市场动量。  第 9 行显示市场是活跃还是被动。 对于定时交易至关重要。 全面的警报和显示。  每种货币最强的买入和卖出动量。 ​​28 对的双重动量买入和卖出。 超买/超卖警告外部范围
Advanced Currency Strength28 Indicator
Bernhard Schweigert
4.9 (651)
目前26%的折扣 任何新手或专家交易者的最佳解决方案! 这个指标是一个独特的、高质量的、可负担得起的交易工具,因为我们纳入了一些专有的功能和一个新的公式。只需一个图表,你就可以读出28个外汇对的货币强度!想象一下,你的交易将如何得到改善,因为你的交易是在你的手中进行的。想象一下,你的交易将如何改善,因为你能够准确地确定新趋势或剥头皮机会的触发点? 用户手册:点击这里  https://www.mql5.com/en/blogs/post/697384 这是第一本,原版的! 不要买一个毫无价值的崇拜者的克隆品。 特别的 子窗口中的箭头显示强劲的货币势头GAP将指导你的交易! 当基础货币或报价货币处于超卖/超买区域(外盘斐波那契水平)时,在个人图表的主窗口中出现警告信号。 当货币力量从外围区间回落时,回撤/反转警报。 十字星模式的特别警报 可选择多个时间框架,以快速查看趋势! 货币强度线在所有的时间框架中都非常平稳,当使用较高的时间框架来识别总体趋势,然后使用较短的时间框架来确定精确的入口时,效果非常好。你可以根据自己的意愿选择任何时间框架。每个时间框架都由其自身进
Advanced Currency Strength28 MT5
Bernhard Schweigert
5 (1)
任何新手或专家交易者的最佳解决方案! 这个指标是一个独特的、高质量的、可负担得起的交易工具,因为我们纳入了一些专有的功能和一个新的公式。只需一个图表,你就可以读出28个外汇对的货币强度!想象一下,你的交易将如何得到改善,因为你的交易是在你的手中进行的。想象一下,你的交易将如何改善,因为你能够准确地确定新趋势或剥头皮机会的触发点? 用户手册:点击这里  https://www.mql5.com/en/blogs/post/697384 这是第一本,原版的! 不要买一个毫无价值的崇拜者的克隆品。 特别的 子窗口中的箭头显示强劲的货币势头GAP将指导你的交易! 当基础货币或报价货币处于超卖/超买区域(外盘斐波那契水平)时,在个人图表的主窗口中出现警告信号。 当货币力量从外围区间回落时,回撤/反转警报。 十字星模式的特别警报 可选择多个时间框架,以快速查看趋势! 货币强度线在所有的时间框架中都非常平稳,当使用较高的时间框架来识别总体趋势,然后使用较短的时间框架来确定精确的入口时,效果非常好。你可以根据自己的意愿选择任何时间框架。每个时间框架都由其自身进行了优化。 建立在
Advanced Supply Demand MT5
Bernhard Schweigert
4.5 (14)
任何新手或专业交易者的最佳解决方案! 该指标是一款独特、高质量、且价格合理的交易工具,因为我们已经整合了许多专有功能和新公式。 依据此更新,您将能够显示双重时间帧区域。 您不仅可以显示一个较高的时间帧,还可以同时显示图表时间帧,加上更高的时间帧:显示嵌套时区。 供需双方所有交易者都会喜欢它。 :) 重要信息披露 高级供需的最大潜力,请访问 https://www.mql5.com/zh/blogs/post/720245   想象您的交易如何得以改善,是因为您能够精准定位入场或目标位吗? 构建于新的底层算法,它可以更轻松地识别出买卖双方之间的潜在失衡。 这是因为它以图形方式展示供需最强劲区域,及其过去的表现(显示旧区域)。 这些功能旨在帮助您更轻松地发现最佳入场区域和价位。 现在您可以针对您的交易品种和时间帧来优化和编辑区域强度! 高级供需指标适用于所有产品和时间帧。 它是一个新的公式,非常新的功能是两个区域强度函数可由用户输入进行调整! 这在交易中是一大优势。 当您学习如何使用专有功能,例如带有价格游离最小 X 因子的区域强度时,您能够判断该区域强劲与否。 供需区域用作警报触发器
Advanced Accumulated Currency Volume
Bernhard Schweigert
4.54 (48)
目前8折优惠! 对任何新手或专家交易者来说都是最好的解决方案! 这个指标是一个经济实惠的交易工具,因为我们结合了一些专有功能和新的公式。 高级累积货币量指标专门针对主要的28个外汇对,并在所有的时间框架内工作。它是一个新的公式,在一个图表上提取澳元、加元、瑞士法郎、欧元、英镑、日元、新西兰元和美元的所有货币量(C-Volume)。这在交易中是一个很大的优势。成交量交易者会知道如何使用它。如果你是新手,那么学习如何阅读极端值,并将其加入你的交易武库。 把C-Volume看作是一个盾牌,而不是一把枪。 在主图上会显示一个警告标志,警告你进入错误的交易。 这不是常用的简单的交易量。外汇市场被扫描,每个货币的交易量被提取并累积到C-Volume。我们现在可以看到哪些货币有最高或最低的交易量。我们可以在一张图表上看到所有28个外汇对的情况。如果欧元有一个强大的峰值,检查欧元对的可能交易。如果英镑有一个强大的峰值,那么检查英镑对。 建立在新的基础算法上,它使识别潜在的转折点更加容易。这是因为它以图形方式显示货币的C-Volume峰值。这些功能的设计是为了帮助并使你远离
Advanced Currency IMPULSE with ALERT
Bernhard Schweigert
4.9 (482)
目前31%的折扣!! 对任何新手或专家交易者来说都是最好的解决方案! 这个指标是一个独特的、高质量的、负担得起的交易工具,因为我们已经纳入了一些专有的功能和一个秘密的公式。只需一张图表,它就能给出所有28种货币对的警报。想象一下,你的交易将如何改善,因为你能够准确地确定新趋势或剥头皮机会的触发点 建立在新的基础算法上,它使识别和确认潜在交易变得更加容易。这是因为它以图形方式显示了一种货币的强势或弱势是否正在加速,并测量了这种加速的速度--把它想象成你汽车中的速度表。当你加速时,事情显然会发生得更快,这在外汇市场上也是一样的,即如果你配对的货币正在向相反的方向加速,你就会发现一个潜在的有利可图的交易。 货币动量的垂直线和箭头将指导你的交易! 动态的市场斐波那契23水平被用作警报触发器,将适应市场活动。如果冲动触及黄色触发线,您将在MetaTrader或您的电子邮件或推送警报中收到警报。然后你就知道作为一个交易员应该做什么。货币对和方向已经给出。只要点击警报按钮,就可以切换到该货币对或打开一个新的图表,以便进一步分析。警报级别可以通过用户输入来改变,可以选择3个敏感度级别
GOLD Impulse with Alert
Bernhard Schweigert
4.56 (9)
这个指标是我们2个产品 Advanced Currency IMPULSE with ALERT  +   Currency Strength Exotics 的一个超级组合。 它适用于所有时间框架,并以图形方式显示8种主要货币和一种符号的强势或弱势冲动! 该指标专门用于显示任何符号的货币强度加速,如黄金、异国货币对、商品、指数或期货。这是它的第一个指标,任何符号都可以被添加到第9行,以显示黄金、白银、石油、DAX、US30、MXN、TRY、CNH等的真实货币强度加速(冲动或速度)。 建立在新的基础算法上,它使识别和确认潜在的交易更加容易。这是因为它以图形方式显示了一种货币的强势或弱势是否正在加速,并测量了这种加速的速度--把它想象成你汽车中的速度表。当你加速时,事情显然会发生得更快,这在外汇市场上也是一样的,即如果你配对的货币正在向相反的方向加速,你就会发现一个潜在的有利可图的交易。 动态市场斐波那契28水平被用作警报触发器,将适应市场活动。如果冲动击中黄色触发线,你将收到警报。然后你就知道作为一个交易员应该做什么。货币对和方向已经给出。只需点击警报按钮,就可以
Supply and Demand Dashboard PRO
Bernhard Schweigert
4.8 (20)
目前八折优惠! 这个仪表板是一个非常强大的软件,可用于多个符号和多达9个时间段。 它是基于我们的主要指标(最佳评论:高级供应需求)。 Advanced Supply Demand 该仪表板提供了一个伟大的概述。它显示。   筛选后的供需值,包括区域强度评级。 区间内和区间外的点位距离。 它突出了嵌套的区域。 在所有(9个)时间段内,它对所选符号发出4种警报。 它是高度可配置的,以满足您的个人需求! 您的利益! 对每个交易者来说,最重要的问题是。 什么是入市的最佳水平? 在强大的供应/需求区域内或附近进入你的交易,以获得最佳的成功机会和风险/回报。 我的止损的最佳位置是哪里? 把你的止损放在强势供应/需求区的下方/上方是最安全的。 我的最佳盈利目标是什么? 你的退出策略和你的进入策略一样重要,了解更高的时间框架图可以帮助你。对于买入,使用下一个供应区作为目标,对于卖出,使用下一个需求区作为目标。在回撤到供应区或需求区时进场,以确保有足够的利润空间,达到更高的时间框架的供应和需求,将增加你的利润。 为什么我们要过滤强区和
My Trades in Pips
Bernhard Schweigert
4.81 (16)
一个你不希望错过的交易工具。该指标在图表中显示所有的交易/交易,以及它所连接的符号。它打印出盈利或亏损的点数。根据选择,它通过子窗口打印一条垂直线,以便更好地进行分析。 也可以在这里查看专业版。我的交易历史专业版 https://www.mql5.com/en/market/product/50206 此外,它还增加了关于存款货币交易的总结果和总点数的信息。 你可以选择只显示当天的交易,或只显示一定数量条内的交易。 它可以显示有指定魔数的交易。如果该值被设置为0,指标将显示所有交易。如果您指定了一个专家顾问的魔数,它将只显示该专家顾问的交易。鼠标放在入口处的箭头会显示订单号,评论和魔力号码。 该指标主要与我的其他专门的货币强度指标之一一起使用。 https://www.mql5.com/en/blogs/post/679077 指标参数 ===指标设置 显示垂直线(线穿过子窗口) 显示总利润(利润或损失,包括佣金和掉期)。 显示总点数 只显示今天 在条形图中显示(0=全部)(限制条形图的数量,0将显示全部)。 在角落里显示总结果(改变结果的
FREE
目前有26%的折扣!! 这个指标是我们两个主要指标( Advanced Currency Strength 28   &  Advanced Currency IMPULSE with ALERT )的一个超级组合。它显示了28个外汇对的TICK-UNITS货币强度值和警报信号。可以使用11种不同的Tick-Units。它们是1、2、3、4、5、6、10、12、15、20和30秒。子窗口中的Tick-Unit栏将被显示并向左移动,当在一秒钟的定时器中至少有一个Tick。 只用一个图表,你就可以剥28个外汇货币对的头皮!想象一下,你的剥头皮将如何提高。想象一下,你的剥头皮将如何改善,因为你能够准确地确定剥头皮机会的触发点? 这是市场上第一个在比1分钟更短的时间内工作的货币强度指标! 它是为那些希望快速进出并从市场中切出小点数的快速剥头皮者准备的。 用户手册:点击这里 https://www.mql5.com/en/blogs/post/727178 特点。 为28个货币对提供嘀嗒单位的卖出/买入警报,有一个按钮可以快速打开目标图表。 在3种敏感模式中选择
对任何新手或专家交易者来说都是最好的解决方案! 这个指标是一个独特的、高质量的、负担得起的交易工具,因为我们已经纳入了一些专有的功能和一个秘密的公式。只需一张图表,它就能给出所有28种货币对的警报。想象一下,你的交易将如何改善,因为你能够准确地确定新趋势或剥头皮机会的触发点 建立在新的基础算法上,它使识别和确认潜在交易变得更加容易。这是因为它以图形方式显示了一种货币的强势或弱势是否正在加速,并测量了这种加速的速度--把它想象成你汽车中的速度表。当你加速时,事情显然会发生得更快,这在外汇市场上也是一样的,即如果你配对的货币正在向相反的方向加速,你就会发现一个潜在的有利可图的交易。 货币动量的垂直线和箭头将指导你的交易! 动态的市场斐波那契23水平被用作警报触发器,将适应市场活动。如果冲动触及黄色触发线,您将在MetaTrader或您的电子邮件或推送警报中收到警报。然后你就知道作为一个交易员应该做什么。货币对和方向已经给出。只要点击警报按钮,就可以切换到该货币对或打开一个新的图表,以便进一步分析。警报级别可以通过用户输入来改变,可以选择3个敏感度级别。 尽早获得新趋势的初
My Trade History PRO
Bernhard Schweigert
5 (3)
目前有20%的折扣!! 对任何新手或专家级交易者来说都是最好的解决方案! 回顾你的交易是成功交易者的第一步。 成功的交易者都有定期回顾其交易业绩的习惯。 这个工具将帮助你做到这一点。 有了这个工具来跟踪你的交易,审查过程将是最有效的。 分析你的手动交易或你的EA的交易。 使用3个一般视图。要在两者之间切换,只需点击按钮。 关闭的交易 开放交易 平仓+开仓交易 每个符号的所有交易都将被列出。要转到另一个符号,只需点击符号名称按钮。 对新开张和关闭的交易使用警报。这对观察你的未平仓交易非常有用。它可能是由EA、信号或手动启动的。 要切换利润或PIPs的结果,只需点击按钮。 利润 PIPs 然后切换3种分析类型。只需点击该按钮。 所有符号模式 1-符号模式 1-交易模式 在使用所有符号和单一符号模式时,将列出其特殊的分析结果。 在使用1-交易模式时,点击后退/下一个按钮,将图表移动到每个交易条目,它将列出该特定交易的特殊交易分析。 返回 下一个 输入参数 ===主要设置 只获取今天|快速检查今天的交易。
筛选:
richard lindstrom
143
richard lindstrom 2024.10.02 13:10 
 

Great indicator & great support.

Bernhard Schweigert
82012
来自开发人员的回复 Bernhard Schweigert 2024.10.02 14:55
Hi Richard, Thank you so much for your kind words! We're happy to hear that you're enjoying the indicator and that our support has met your expectations. Wishing you continued success in your trading journey!
jrrichardson83
421
jrrichardson83 2024.08.01 21:16 
 

Talk about being scumbags. I purchased this indicator a little over a year ago. Maybe longer. I have several computers and I went to update the indicator on one of them only to find out I 1) had no more activations, which is fine, whatever. But then 2) the indicator is no longer able to be purchased, only rented. Literally acting like a landlord for an indicator. Rubbish. Greedy.

Edit: The seller is a clown. Yes, I lost my activation on one of my computers due to a change in hard-drive. However, I also lost an activation recently due to MT4 not loading the indicator properly on my other machine. This has happened before for other indicators, which I've solved by just uninstalling and reinstalling the indicator. However, when I did that this time, lo and behold, I lost another activation. So, yeah, totally grounds to complain.

Bernhard Schweigert
82012
来自开发人员的回复 Bernhard Schweigert 2024.08.04 18:54
Initially, our indicators were available only for rent. The purchase option was a temporary offer. I understand your frustration, but don’t worry, I can find a solution for you. Please check your messages for further assistance.
Edit: The customer lost an activation due to changing a hard drive, which is expected in such situations. He still has the product active on other computers, meaning he has access. No reason to to complain!
tgkaranja74
82
tgkaranja74 2024.06.21 00:22 
 

Loving this indicator so far. Excited at the possibilities.

MILLION MONEY
24
MILLION MONEY 2024.06.11 12:40 
 

用户没有留下任何评级信息

Darryl Brown
248
Darryl Brown 2024.05.26 16:48 
 

This indicator is the best on MQL5 in my opinion. The reason why I believe that is because when you can combine it with other indicators it will improve your trading. If you want accurate entries and exits this is the indicator for you. Bravo Bernhard.....Bravo.

Bernhard Schweigert
82012
来自开发人员的回复 Bernhard Schweigert 2024.05.29 12:50
I appreciate your feedback! I'm happy to know the indicator helps with accurate trading decisions. Thanks for the support! 💖
Ferrari888
598
Ferrari888 2024.04.10 23:15 
 

Отличная поддержка, Bernhard спасибо за хорошие индикаторы. Я являюсь постоянным клиентом. Все супер

Bernhard Schweigert
82012
来自开发人员的回复 Bernhard Schweigert 2024.04.27 12:23
Thank you for your loyal support and kind words! We truly appreciate having you as a valued member of our community over the years. 💖
egoli55
39
egoli55 2024.02.29 08:40 
 

After over 5 years of being an active MT4/MT5 user, this is arguably the most accurate Supply and demand indicator I have ever used. I just love it; and for the most part, price react at the levels printed by this wonderful indicator, especially when a higher and lower timeframe S/D lines insect. I wish I have been using it over the years. The author gave a very good illustrations and description of how to adjust the indicator for optimum settings.

Bernhard Schweigert
82012
来自开发人员的回复 Bernhard Schweigert 2024.03.07 11:57
We appreciate your review of our Supply and Demand indicator. It's gratifying to hear that after over 5 years of trading experience, you find it to be one of the most accurate indicators you've used. We're glad the illustrations and descriptions have aided in optimizing its settings. 💖 💖
Ravi Chandiran
590
Ravi Chandiran 2024.02.08 01:12 
 

Excellent Indicator in terms of Entry, Exit& Risk Avoidance!!!

Bernhard Schweigert
82012
来自开发人员的回复 Bernhard Schweigert 2024.02.20 13:45
Thank you for review 🙏💖
Baban_1970
20
Baban_1970 2024.01.08 21:47 
 

I just purchased the indicator, and so far so good

uvstockstrades
259
uvstockstrades 2024.01.05 12:27 
 

Saves Time. Helps a lot. Thanks and keep it up.

Bernhard Schweigert
82012
来自开发人员的回复 Bernhard Schweigert 2024.01.26 14:03
Thanks for the review! 👍
Harakty
347
Harakty 2023.12.21 10:50 
 

Simply the best S&D indicator in the market, it gets super powers when used as a fundamental part of the CS Strategy. Now it became pretty easy to spot where the price action is going to move when approaching a POI. Thanks Bernhard!

Bernhard Schweigert
82012
来自开发人员的回复 Bernhard Schweigert 2024.01.12 13:52
I'm glad that you're finding the S&D indicator to be a valuable tool in your trading arsenal, friend. Your success is my success. 💖
denisjohn
224
denisjohn 2023.12.18 22:04 
 

Hi, just an update on my experience with bernhards indicators. I started a couple of years ago with 3 of his indicators - CS28, Impulse and S & D with alerts. I had mixed results. This was probably due to inexperience and not studying the products enough. I then gave up for over a year. Came back and decided there was definitely something in this so I studied and tested it properly and my results have improved massively. So, great job Bernhard .

Bernhard Schweigert
82012
来自开发人员的回复 Bernhard Schweigert 2023.12.21 13:15
It's great to hear that thorough study and testing have led to a significant improvement in your trading results. 💖
JAMEEL ZAKI J ALFAQIH
564
JAMEEL ZAKI J ALFAQIH 2023.11.30 04:15 
 

Very bad

Bernhard Schweigert
82012
来自开发人员的回复 Bernhard Schweigert 2023.12.21 12:56
It was evident in our conversation that the issues in your trading were not related to the accuracy of the indicator but rather resulted from engaging in high-risk trading with elevated lots. Hundreds of traders have found great success with this product.
Malik Cole
29
Malik Cole 2023.11.01 01:31 
 

Great indicator made profit from it already. How do I scan all the pairs that are entering the support zones, and also how do I get the bonus?

Bernhard Schweigert
82012
来自开发人员的回复 Bernhard Schweigert 2023.11.14 13:41
I appreciate your positive feedback on the indicator and your profitable experience. I've sent you an email providing details on how to scan multiple pairs. Our dashboard is a powerful tool for scanning various pairs simultaneously. 👍
Duy Thanh Trinh
189
Duy Thanh Trinh 2023.09.30 16:02 
 

用户没有留下任何评级信息

Bernhard Schweigert
82012
来自开发人员的回复 Bernhard Schweigert 2023.09.30 17:27
You're welcome, friend. I have sent you a personal message to your MQL5 inbox. Please take a moment to check it. Best regards, Bernhard www.CurrencyStrength28.com
Matthew Kotecki
227
Matthew Kotecki 2023.09.06 03:03 
 

indicator is very accurate, and saves me time when marking up my charts. has improved my trading immensely

Bernhard Schweigert
82012
来自开发人员的回复 Bernhard Schweigert 2023.09.06 20:00
We appreciate your feedback. It's great to hear that our indicator's accuracy and time-saving features have had a positive impact on your trading. 💖
Noboru Sato-
189
Noboru Sato- 2023.08.23 07:09 
 

色々と悩みましたが、こちらのインジケータは抵抗帯、しかも時間足を1つに集約してもらえるので、トレードするのが非常に助かります。スイングが多いので、1時間足に4時間足の抵抗帯が見えまた大抵は消えがちですが、過去に意識された(ブレイクした)抵抗も見えるので、振り返りにも役立ちます。

Bernhard Schweigert
82012
来自开发人员的回复 Bernhard Schweigert 2023.08.27 12:24
あなたのレビューと共有された洞察に感謝しています。需給ゾーンとタイムフレームを統合できる機能が、あなたの取引スタイルにとって画期的なものであることは明らかです。過去のブレイクアウトを識別し、十分な情報に基づいた意思決定ができることは、トレードを成功させるために不可欠です。 💖
We're grateful for your review and the insights you've shared. It's clear that the feature allowing you to bring together Supply and Demand zones and timeframes has been a game-changer for your trading style. Being able to identify past breakouts and make well-informed decisions is essential for successful trading.
Henry Manuel Chavez Hidalgo
59
Henry Manuel Chavez Hidalgo 2023.08.10 12:42 
 

Great indicator....I am learning how to adapt it to my trading plan.

muzzu-qureshi
57
muzzu-qureshi 2023.07.21 18:52 
 

Best indicator I love it just one thing is missing (buy and sell signals alert) It is a great way to enter, exit and put your stop losses. Once I got this indicator I was so impressed

Bernhard Schweigert
82012
来自开发人员的回复 Bernhard Schweigert 2023.07.23 11:07
Thank you for the great review! We're glad to hear that you love our indicator and find it helpful in your trading journey. It currently provides alerts for reverse candles and zone breaks, which can be used for entry buy and sell signals. Always check the signals on your chart for final trade execution. We appreciate your feedback, and we're continuously improving our indicator to meet your needs. Happy trading! 💖
Probability_Trader
71
Probability_Trader 2023.07.20 23:32 
 

Amazing indicator that is very helpful in finding imbalances in the market in order to trade in line with big banks.

回复评论
版本 7.3 2024.09.22
Best-Rated Supply and Demand Zone Indicator on the Market

We’ve introduced several key improvements tailored for the latest Metatrader update, ensuring smoother performance and enhanced accuracy.

Why update?

Seamless compatibility with the latest Metatrader version
Improved speed and responsiveness
Optimized zone detection for even sharper entries and exits

Stay ahead of the market—update now! It’s free and only takes a few clicks.
版本 7.2 2024.07.21
We are excited to announce the release of version 7.2 of our highly acclaimed Advanced Supply Demand Indicator, bringing you a host of enhancements to optimize your trading performance!

Enhanced Performance: Our latest update ensures compatibility with the newest version of MetaTrader, providing a smoother and more responsive experience.
We strongly recommend keeping your indicators up to date to take full advantage of these free improvements.
版本 7.1 2024.05.21
Version 7.1 Update**

We are excited to announce the release of Version 7.2 of our Advanced Supply Demand Indicator! This update brings a suite of enhancements designed to further improve your trading experience and performance.

### What’s New in Version 7.1:
1. **Enhanced Algorithm Precision:** Our updated algorithm delivers even more accurate calculations, allowing for sharper and more reliable trading signals.
2. **Faster Data Processing:** Experience reduced lag and faster updates, ensuring you’re always working with the most current market information.

### Why Upgrade?
Maximize your trading potential with the latest features and improvements. Our Indicator continues to set the standard for accuracy and functionality in the market. Don’t miss out on these crucial updates—upgrade to Version 7.1 today and take your trading to the next level!

Upgrade now and join the ranks of successful traders who trust our leading-edge tools to achieve their financial goals. Your journey to more informed and profitable trading starts here.

Happy trading!
版本 7.0 2024.03.22
Our Supply and Demand Zone Indicator has earned its reputation as the top choice among traders for its unparalleled accuracy and comprehensive features. Don't miss out on the opportunity to elevate your trading strategy and maximize your profits. Update now and experience the difference firsthand.
版本 6.9 2024.01.22
Best rated Supply and Demand Zone Indicator in the Market.

Various improvements for new Metatrader version.

Please keep your indicators up to date. It's free.
版本 6.8 2023.12.20
**Upgrade Today and Trade with Confidence!**

Don't miss out on these game-changing improvements. Update your Advanced Supply Demand Indicator now and elevate your trading journey.
版本 6.7 2023.11.17
Best rated Supply and Demand Zone Indicator in the Market.

Various improvements for new Metatrader version.

Please keep your indicators up to date. It's free.
版本 6.6 2023.10.20
We've just released an exciting update for our indicator, packed with enhancements that take your trading to the next level.

Upgrading your indicator is a smart move. It ensures you're leveraging the latest features, giving you a competitive edge in the market. Don't miss out!

Should you have questions or need help with the update, our team is here for you. Reach out anytime; we're committed to your success.

www.CurrencyStrength28.com
版本 6.5 2023.09.23
Please update to Version 6.4

Best rated Supply and Demand Zone Indicator in the Market.

Various improvements for new Metatrader version.

Please keep your indicators up to date. It's free.
版本 6.4 2023.08.21
Upgrade to Version 6.4 for Enhanced Trading Insights

+ We're thrilled to introduce Version 6.4, featuring the industry's highest-rated Supply and Demand Zone Indicator. Elevate your trading strategy with this powerful tool, designed to help you identify critical price reversal areas.

+ In response to valuable feedback from traders like you, we've added a new feature – the "Price Label." Now, when you explore higher timeframe zones, this label serves as a helpful reminder, providing context for the purpose of each empty rectangle zone.

New input:
+ display MTF names left (default = true)

+ Don't miss out on these exciting updates. Keep your indicators up to date effortlessly and at no cost. By staying current with our latest version, you're ensuring that your trading arsenal remains at the cutting edge of the market.

+ Upgrade to Version 6.4 now and access the best-rated Supply and Demand Zone Indicator available. With the new Price Label feature, trading on higher timeframes becomes even more insightful. Join the community of savvy traders who are enhancing their strategies with our free, top-notch tools.
版本 6.3 2023.07.21
Please update to Version 6.3

Best rated Supply and Demand Zone Indicator in the Market.

Various improvements for new Metatrader version.

Please keep your indicators up to date. It's free.
版本 6.2 2023.06.21
We are thrilled to announce the highly anticipated release of Version 6.2 of our Advanced Supply Demand Indicator – the top-rated tool for traders like you. With its advanced capabilities, this powerful indicator will revolutionize your trading strategy by identifying critical price reversal areas, giving you a significant edge in the market.

Discover the latest enhancements we have made to ensure seamless compatibility with the newest Metatrader version. By upgrading to Version 6.2, not only do you gain access to cutting-edge features, but you also stay ahead of the competition. And the best part? These updates are completely free, so you can maximize your trading potential without any additional cost.

Upgrade now to Version 6.2 and experience firsthand the unparalleled benefits of our top-rated Supply and Demand Zone Indicator. Take control of your trading journey, make informed decisions, and elevate your profitability. Don't miss out on this opportunity to improve your trading strategy – all for free.
版本 6.1 2023.05.25
Various improvements.
Please update.
版本 6.0 2023.04.20
We're excited to announce the release of Version 6.0, featuring the best-rated Supply and Demand Zone Indicator on the market. This powerful tool helps you spot key areas of price reversal, giving you an edge in your trading strategy.

Our team has made various improvements to ensure compatibility with the latest Metatrader version, so you can take advantage of new features and stay ahead of the competition. Plus, keeping your indicators up to date is completely free and ensures that you're always using the most advanced tools available.

Upgrade now to Version 6.0 and experience the benefits of our best-rated Supply and Demand Zone Indicator. Stay ahead of the competition and improve your trading strategy with the latest updates, all for free.
版本 5.9 2023.03.22
Our indicator has been updated with more improvements. We made overall enhancements to its functionality.

We highly recommend that you update your indicator to take advantage of these improvements. This will ensure that you are using the latest version of our software and that you can benefit from the latest enhancements and features.

If you need assistance with the update process or have any questions, please do not hesitate to contact us. We are always here to help.
版本 5.8 2023.02.24
We are proud to announce that our Supply and Demand Zone Indicator continues to be the highest rated tool of its kind in the market. Our team has worked hard to develop and refine this powerful tool, and we believe it will help you identify profitable trading opportunities with greater accuracy.
With the recent release of the new Metatrader version, we have made various improvements to ensure that our software continues to integrate seamlessly with this popular trading platform. These changes include performance enhancements, so you can expect even smoother and more reliable performance from our indicators.
版本 5.7 2023.01.24
Please update to Version 5.7

Best rated Supply and Demand Zone Indicator in the Market.

Various improvements for new Metatrader version.

Please keep your indicators up to date. It's free.
版本 5.6 2022.12.22
Various improvements for new Metatrader version.
Please update.
版本 5.5 2022.11.21
Best rated Supply and Demand Zone Indicator in the Market.
Various improvements.
Please update.
版本 5.4 2022.10.21
Added more improvements.
Updating is recommended.
版本 5.3 2022.09.22
Added more improvements,
Updating is recommended.

版本 5.2 2022.08.20
More improvements.
Please update.
版本 5.1 2022.07.21
Best rated Supply and Demand Zone Indicator in the Market.
Various improvements.
Please update.
版本 5.0 2022.06.22
Various improvements for new Metatrader version.
版本 4.9 2022.05.18
A useful feature has been added at the request of a trader.
A trader can have only buy or sell preferences for an instrument. This selects the alarms that are chosen. The graph and alert when entering a zone are unaffected.

==== General Alert Settings ====
New input:
+ Traders preference alerts buy-sell-both

Please update.
版本 4.8 2022.04.20
Various improvements.
Please update.
版本 4.7 2022.03.20
Various improvements.
Please update.
版本 4.6 2022.02.18
Various improvements.
Please update.
版本 4.5 2022.01.17
Various improvements for new Metatrader version.
Please update.
版本 4.4 2021.12.17
Various improvements.
Please update.
版本 4.3 2021.11.18
More improvements.
A "Must" update.
Another bridge for EA import has been added.
版本 4.2 2021.10.11
Best rated Supply and Demand Zone Indicator in the Market.
Various improvements.
Please update.
版本 4.1 2021.08.23
Various improvements.
版本 4.0 2021.06.13
IMPORTANT UPDATE!
VERSION 4 !!!
版本 3.7 2021.05.09
Various improvements.
版本 3.6 2021.03.14
Best rated Supply and Demand Zone Indicator in the Market.
Various improvements for new Metatrader version.
版本 3.5 2020.10.20
MAJOR UPDATE 2020 SERIES 03
==================

The new update brings:
MODIFICATION FOR ZONE SIZE (optional)

Some traders of supply and demand zones asked for a new function. It was added optionally: Including a wick for the width of the supply and demand zones.

New input:
+ Include wick 1 for the zone size
By default, the function is not used. To use the function, you must set the new input = true (the selection is also copied to the higher time frame).
Since the zones will be wider, some zones could be filtered. You may want to use lower XY factors.

This is possibly the last update from a 2020 series.
From now on I will add the new features to "Supply and Demand Dashboard PRO".
版本 3.4 2020.10.10
The new update brings:
1) Graphical improvements and
2) Some traders of supply and demand zones requested a new function. It was added optionally: Draw supply and demand zones only at major highs and lows.
New input:
+ use only major highs and lows
By default, the function is not used. To use the function, you must set the new input = true. (The choice will be copied to the higher timeframe as well.
To show all zones at highs and lows you might want to set all XY-factors = 1.0, but it can be combined.)
版本 3.3 2020.10.04
MAJOR UPDATE 2020
==================

Added optional: Supply and Demand zones with ENGULFING BARS pattern at the beginning of the zone.
Use reversal candle color for bar 1 or bar 2 (the one before). Use either ones or both.
Use true engulfing pattern for above mentioned bars. (Must choose above.)

By default the use is false. To use the function you must set the new inputs = true.

New inputs:
==== Candle pattern
+ use reversal candle color bar 1
+ use reversal candle color bar 2 (both or either)
+ use true engulfing pattern (choose above)
版本 3.2 2020.09.17
Various improvements and graphic options for counter of broken zones.
版本 3.1 2020.07.23
Thanks to client report, fixed an issue with show old zones and number of broken Sup/Dem in a row.
版本 3.0 2020.02.10
Added zone size info in point. As requested by trader.
It will show in the right corner of the rectangles. The size of the higher timeframe is shifted a few bars to the left.
new inputs:
=== Chart settings
+ show zone size (point)
+ show zone size MTF (point)

associated inputs:
+ color price labels
=== other settings
+ font size zone
+ Label font 1
版本 2.90 2020.01.14
Various improvements.
版本 2.80 2019.10.18
At the request of a trader:
Added room in points for HIT-alert. Now the trader can receive an earlier alert when price is NEAR a zone. Then he can take action or watch. This input should be applied according to the symbol and timeframe. The trader can make it bigger to suit his needs. The default value is 5 points. (10 point = 1 pip.)
new input:
+ room in points for HIT-alert
版本 2.70 2019.09.21
1) A new alert for a fake (or false) breakout has been added with several variables:
new inputs:
==== FBO Alert settings
+ Alert Fake Breakout (FBO)
+ FBO min bar Size Point
+ FBO bar closes back % (20-90)
+ FBO pattern bar count (1-3)

2) For old zones a new candle limit was added. If there is a strong trend, zones with only 2000 bars lookback may not be within range. Therefore, this limit has been increased to 5000. But so far we don't have to draw old zones. Therefore, a new limit has been added for old zones with 1000 bars.
new input:
+ Show Bars back for old zones

3) Now you can edit the size for arrow as requested by trader.
new input:
+ reverse candle arrow size (1 to 5)
版本 2.60 2019.05.29
1) Optimized some issue with old zones and counter.

2) As requested by a trader the reversal arrow will now only draw on nested zones if the filter "alert only nested" is true.

3) A new filter for alerts has been added to alert only if the zone is new or untouched. (Excluding break alert.)
New input:
+ reverse candle: use only new zones (default = false)
To activate the filter set above input to true;

4) A new candle limit has been added for old zones. If there is a strong trend the zones might not be in range with only 2000 bars look back. So this limit was set higher to 5000 bars. But we do not need to draw old zones so far. That's why a new limit for old zones has been added. (Default = 1000 bars.)
New input:
+ show Bars back for old zones
版本 2.50 2019.04.25
Optimized diverse functions and graphics.
版本 2.40 2018.12.06
Optimized XY-filter for higher timeframe MTF.
To make sure the higher timeframe filters out weak S/D zones the same way as the lower timeframe (chart) does.
Also you can setup different values for each timeframe.
Default values are now set to:
+ min X-factor of price travel away (ATR) = 1.4
+ min Y-factor of price travel away (zone size) = 2
版本 2.30 2018.11.04
New features added!

Added an optional filter to alert only nested zones. (The lower timeframe zone must be within a higher timeframe zone.)
It applies to all 3 actual alerts (hit - reverse - break).
If turned off the alerts will still tell if the alerted zone was nested or not.
New input:
+ alert only NESTED zones! (within MTF)

Added an optional pause in seconds for less CPU use. (Set to 0 to turn it off) At least on each new candle new zones will be checked.
New input:
+ pause runs in seconds to next update (for less CPU use) (0=not)
版本 2.20 2018.10.25
Added a new visual option for higher timeframe zones rectangles.
If the square is not filled and the width is 1 it can be used as dashed/dotted etc...

New input below other settings:
+ rectangle line style MTF (width must be 1)
版本 2.10 2018.10.01
Added XY-filter for higher timeframe.
If you want the higher timeframe to show like before set XY-filter MTF = 1.0

New input parameters:
==== MTF settings
+ min HTF!-candles before a zone is printed
+ min X-factor of price travel away (ATR) MTF
+ min Y-factor of price travel away (zone size) MTF

Added pre-name for objects. In case you want to use the indicator twice on a chart, enter here a letter for the 2nd.

New input parameters:
==== other settings
+ prename for additional objects
版本 2.0 2018.09.25
Version 2.0 - 2018.09.24
Final upgrade with faster calculations.
It just got hypersonic speed to draw all levels and zones !!!

+ added "usePIN" for developments (Global variables)
Gives access to the first 5 supply and demand zones (outer price, inner price, if it is used or not, the timeframe, and the symbol).

版本 1.22 2017.07.17
Added an input to draw the higher timeframe squares extended to the right to not cover the live candle.
Optimized alerts.
Minimized CPU usage with a timer.
Reorganized inputs.

New input parameters:
+ draw rectangle extended over live candle (1 to 5 bars)
+ zone print delay seconds for redraw (5 to 60 sec)
版本 1.14 2017.04.24
On customers request, I added different colors for broken (old) zones.
+ color supply old
+ color demand old
Repeating alerts on M1 are been fixed.
版本 1.13 2017.03.30
With this update, we have a small add for better graphic.
Now you can choose empty squares for the higher timeframe (MTF) and edit the line width. This makes it graphically easier to differentiate between chart timeframe zones and higher timeframe zones.
+ rectangle style full MTF (default=false)
+ rectangle width (1-5) MTF (default=3)
The colors have been modified for the higher TF to be more beautiful.
版本 1.12 2017.03.16
With this update, you will be able to show double time frame zones. You will not only be able to show a higher TF but to show both, the chart TF, PLUS the higher TF: SHOWING NESTED ZONES.

Indicator parameters added:
==== MTF settings
+ ADD higher TF
+ higher TF period (or one more if chart TF)
+ show inner price labels MTF
+ show outer price labels MTF
+ limited size of a big zone. Max factor (ATR) MTF
+ color supply MTF
+ color supply used MTF
+ color demand MTF
+ color demand used MTF
+ color price labels MTF
+ size price labels MTF
版本 1.11 2017.02.06
Corrected count of broken supply/demand zones and start of daily lines.