PZ Swing Trading
- 指标
- PZ TRADING SLU
- 版本: 6.2
- 更新: 27 四月 2021
- 激活: 20
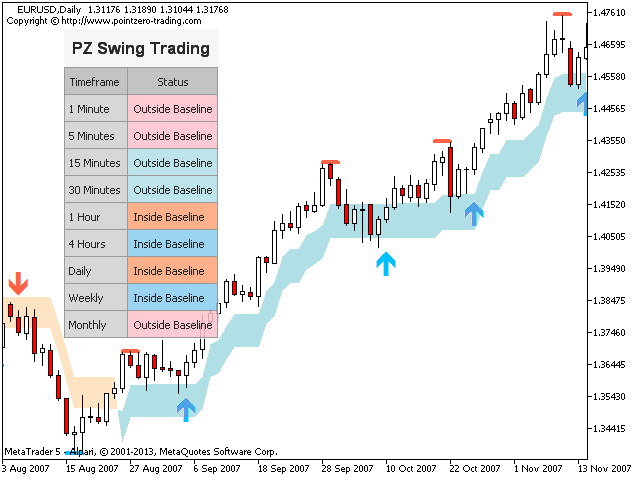
Swing Trading是第一个旨在检测趋势方向的波动和可能的反转波动的指标。它使用在交易文献中广泛描述的基准摆动交易方法。该指标研究多个价格和时间向量,以追踪总体趋势方向,并检测市场超卖或超买并准备好进行修正的情况。
[ 安装指南
| 更新指南
| 故障排除
| 常见问题
| 所有产品
]
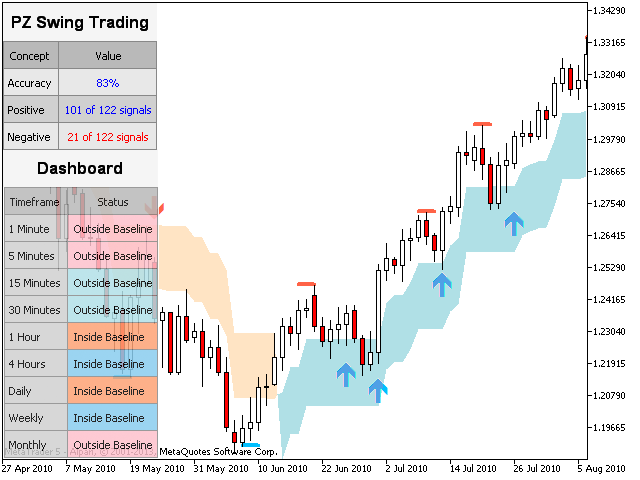
- 市场波动的利润不会被窃取
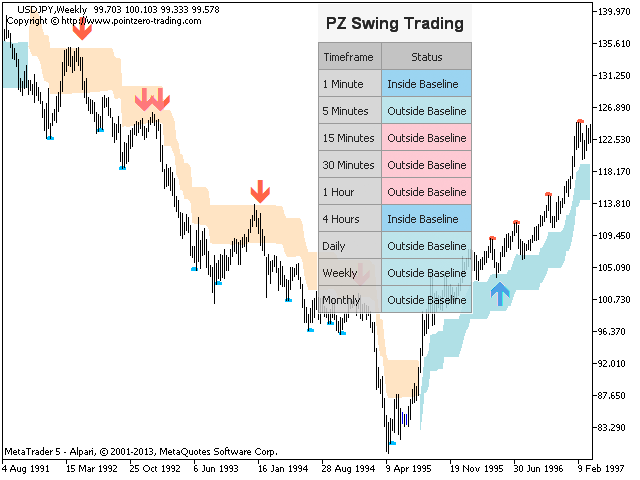
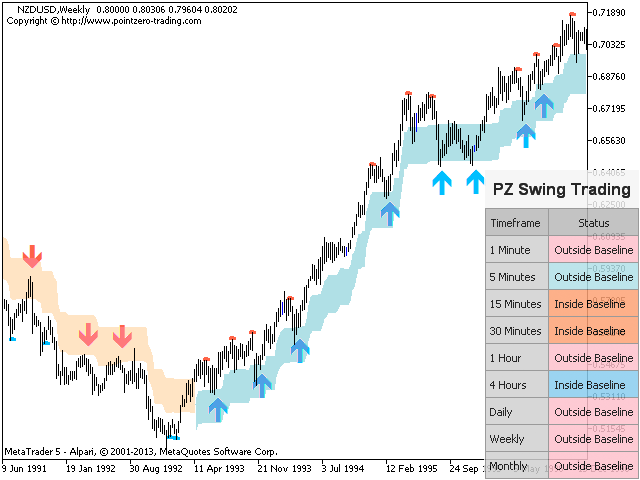
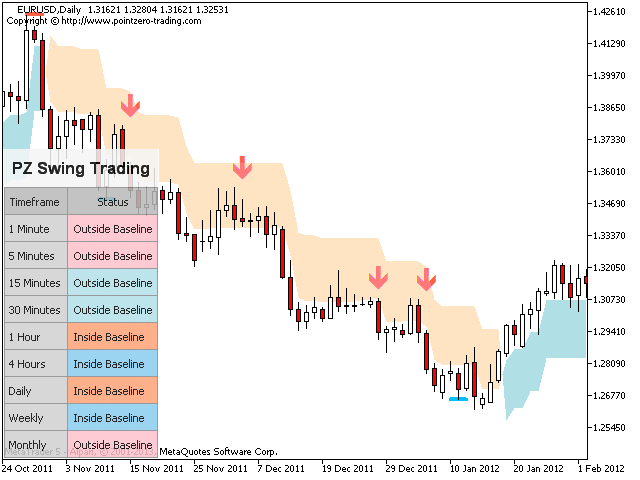
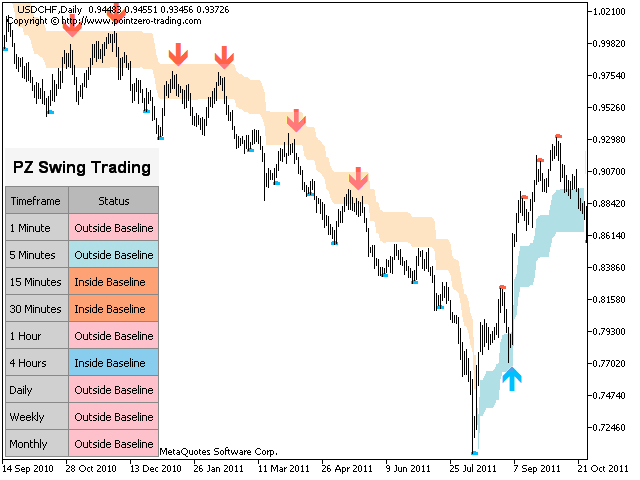
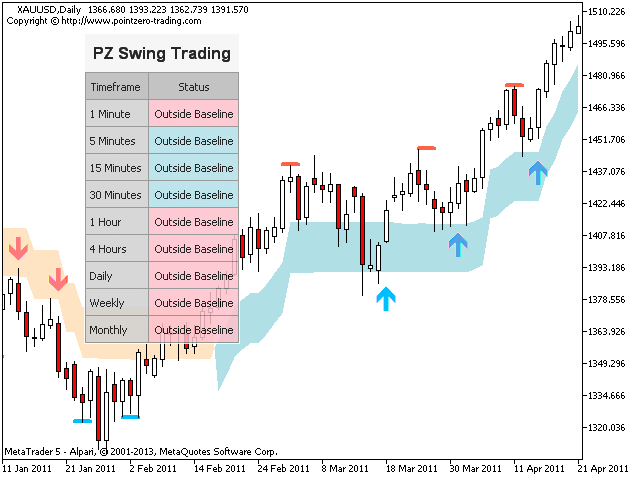
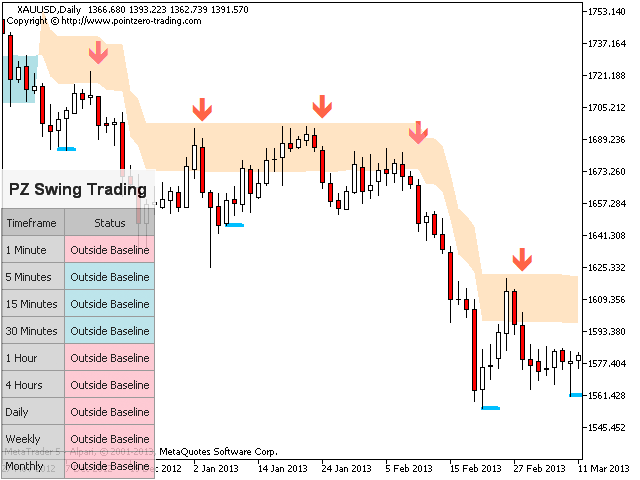
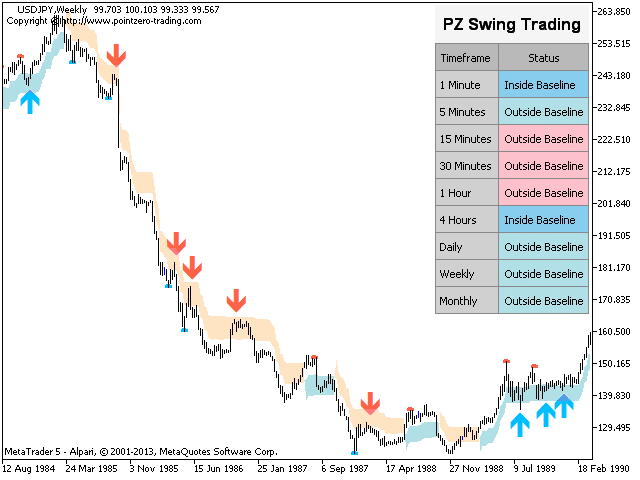
- 指示器始终显示趋势方向
- 彩色价格带代表机会基准
- 彩色虚线表示可能的反转波动
- 该指标分析其自身的质量和性能
- 它实现了一个多时间仪表板
- 可定制的趋势和波动周期
- 它实现了电子邮件/声音/推送警报
- 指示器为非重涂或重涂
什么是摇摆交易
摇摆交易是一种尝试在一天到一周内从证券中获得收益的交易方式,尽管某些交易最终可以保持更长的寿命。摇摆交易者使用技术分析来买入弱点和卖出力量,并有耐心等待这些机会的发生,因为在发生一波抛售浪潮之后购买证券而不是陷入抛售更有意义。
机会基准
关于历史数据的大量研究证明,适合于波动交易的市场倾向于在基线价格带上下交易,基线价格带由图表显示,使用平均真实区间计算得出。波动交易者使用基线,该策略是购买常态和卖出躁狂,或做空常态并掩盖沮丧。在没有疲惫模式的情况下,当股票上涨时,摇摆交易者会在基线做多,而当股票下跌时,摇摆交易者会在基线做空。
摇摆交易者并不希望单笔交易就能达到本垒打,他们也不关心完美时机恰好在其底部买入股票并在其最高处卖出。在理想的交易环境中,他们等待股票达到基准并确定其方向,然后再采取行动。
当在当前或更高的时间范围内有较强的上升趋势或下降趋势时,情况变得更加复杂:交易者可能在股票跳升至其基准线以下时反常地走了很长时间,然后等待股票以上升趋势回升,或者他可能卖空超过基准线的股票,如果较长的趋势下降,则等待其下跌。为此,指示器以彩色虚线显示反转。
输入参数
- 趋势周期-此参数控制对趋势变化的敏感性。大趋势期将导致捕获更长的趋势。较小的趋势周期将导致捕获较短的趋势,但更快地识别趋势变化。
- 基线期-此参数控制基线的敏感性。基线期应始终低于趋势期。增加它以使用较大的机会带进行交易,并减少它以使其变得更小。
- 显示摆动信号-启用此参数可在价格回撤至基线并突破该基线时显示箭头。
- 显示校正-启用此参数后,趋势开始校正时将显示彩色虚线。
- 显示仪表板-启用此参数可以在图表上查看多时间框架仪表板。
- 显示统计信息-启用此参数可以在统计图上显示统计信息仪表板。
- 图纸设置-选择您自己的颜色和尺寸来绘制箭头和反折线。
- 警报-启用模式的显示/电子邮件/推送/声音警报。
支持和问题
向服务台咨询问题或及时获得支持。写电子邮件至:help@pointzero-trading.com 作者
ArturoLópezPérez,私人投资者和投机者,软件工程师,零零点交易解决方案的创始人。


good work