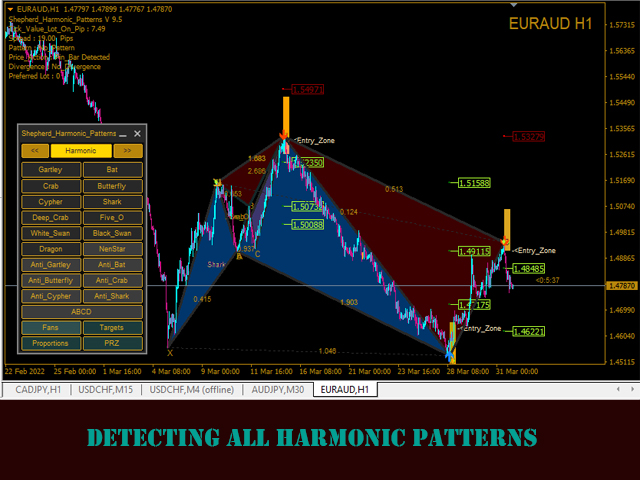
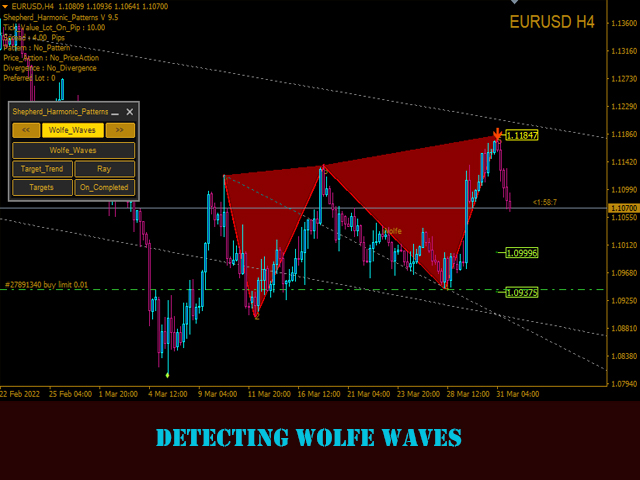
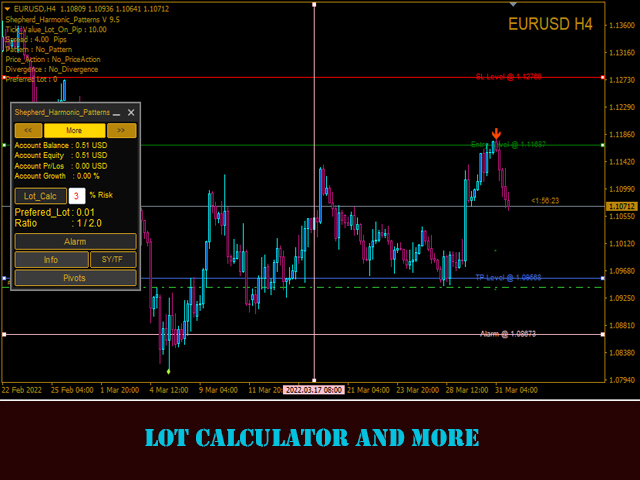
Shepherd Harmonic Pattern
- 指标
- Abdullah Alrai
- 版本: 9.6
- 更新: 4 六月 2023
- 激活: 5
这个指标将检测手动和自动方法在图表上绘制的谐波模式。 您可以从此链接查看用户手册:
添加您的评论并联系我们以获得它
有一个免费版本可以在mt4上尝试此产品。 您可以使用它来检测Gartley和Nenstar模式:
https://www.mql5.com/en/market/product/30181
您可以从以下链接购买完整的MT4版本:
https://www.mql5.com/en/market/product/15212
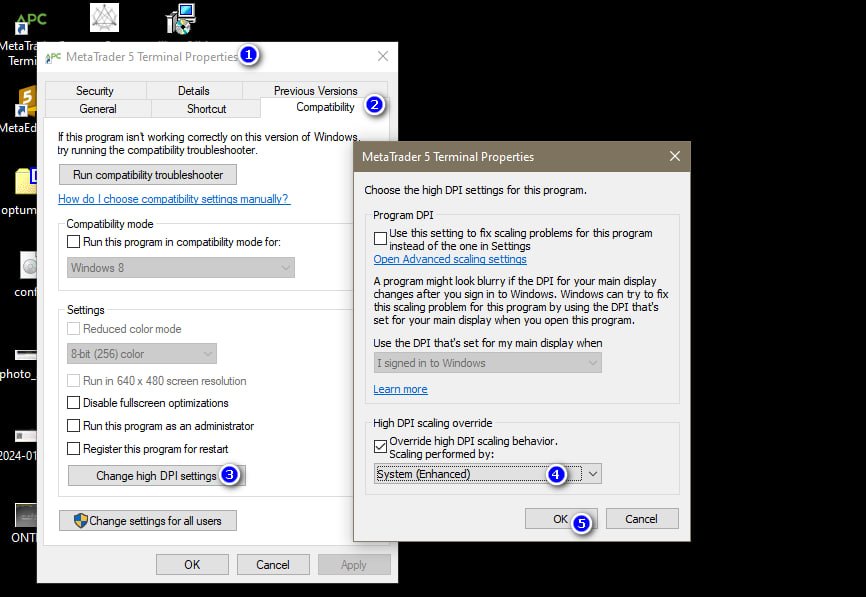
注意 指标具有控制面板,并将保存每个(图表和时间框架)设置。 您可以将其最小化以在图表上获得更多空间,并且如果您更喜欢使用其他分析工具,则可以按关闭按钮隐藏所有指标数据 当您使用此指标并更改设置,添加诸如移动平均线或布林带之类的指标时,此指标将自动保存您的模板编辑,并且您可以随时加载它们。 如果您使用的是Windows 10,请右键单击MetaTrader图标>兼容性>更改高DPI设置>系统(增强)以获得最佳屏幕设置(应在高清设备中完成)。 指标只是谐波交易理论的解释,用于检测图表上的谐波模式。 如果您想学习它,可以搜索Scott Carney的书,名为“Harmonic Trading vol 1&2”。 指标具有价格和时间警报线。 指标将在检测到的模式上绘制斐波那契风扇。 指标将绘制中心点/卡马雷拉/模式射线。 您可以将手动绘制的对象从更高的时间框架加载到较低的时间框架中。 重置按钮将清除所有保存的设置(全部/当前)时间框架。 指标具有警报/通知系统,可以向您提供目标/停止/入场点作为信号。 指标将检测分歧(黄色和橙色箭头),它们作为良好的确认。 指标将为每个模式计算最佳手数大小,因为它对您的余额和风险值有益,您可以在设置中插入。 指标还将检测价格行为模式(Pinbar、InsideBar、OutSideBar)。 您可以使用此指标缓冲区在EA中使用此代码: double buy_signal = iCustom(NULL,0,“Market \ Shepherd_Harmonic_Patterns”,0,1); // if(buy_signal!= EMPTY_VALUE){// buy} double sell_signal = iCustom(NULL,0,“Market \ Shepherd_Harmonic_Patterns”,1,1); // if(buy_signal!= EMPTY_VALUE){// sell} double bull_divergence = iCustom(NULL,0,“Market \ Shepherd_Harmonic_Patterns”,2,1)


Thanks for the new update