版本 3.7
2023.11.05
The indicator has been recompiled with a new version number (to match the version number in MT5).
版本 3.6
2022.12.02
The indicator is recompiled in MT4 build 1367.
版本 3.5
2022.05.06
The indicator is recompiled in MT4 build 1355.
版本 3.4
2021.09.23
The indicator is recompiled in MT4 build 1345.
版本 3.3
2020.12.01
The indicator is recompiled in MT4 build 1310.
版本 3.2
2020.10.14
The list of input variables is divided into sections.
The indicator is compiled in MT4 build 1280.
版本 3.1
2020.03.24
The indicator is recompiled in MT4 build 1260.
版本 3.0
2018.05.18
Improved the algorithm of the DivergenceConfirmation function. The function has been renamed to a more appropriate name – VolumeIncreaseRefutation.
Added the BackwardBalanceRefutation function, which checks the balance of a price movement, from the moment the price leaves a volume level and up to the moment the price returns to this level after a certain time.
版本 2.9
2016.12.22
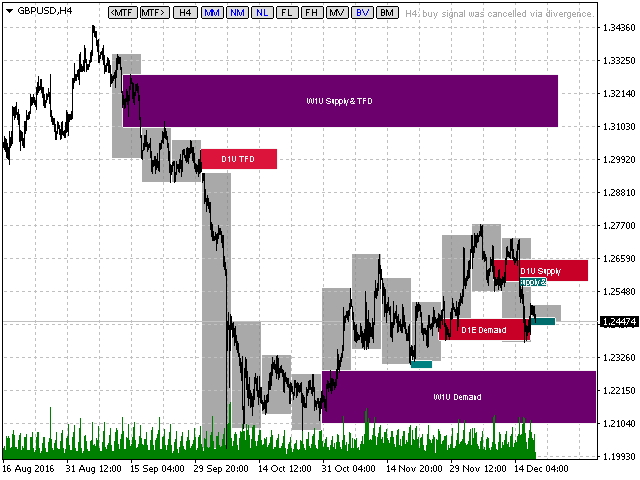
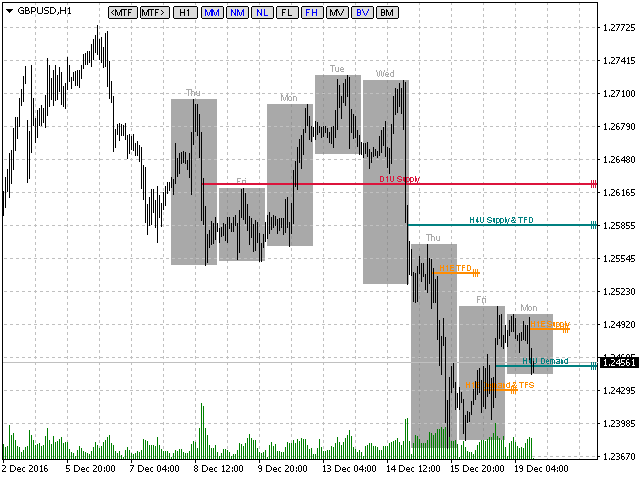
The width of the level zones is adjusted for the display mode using broader levels. Note that the level retest level is not only price touching the upper or lower edge, but also penetration up to the middle.
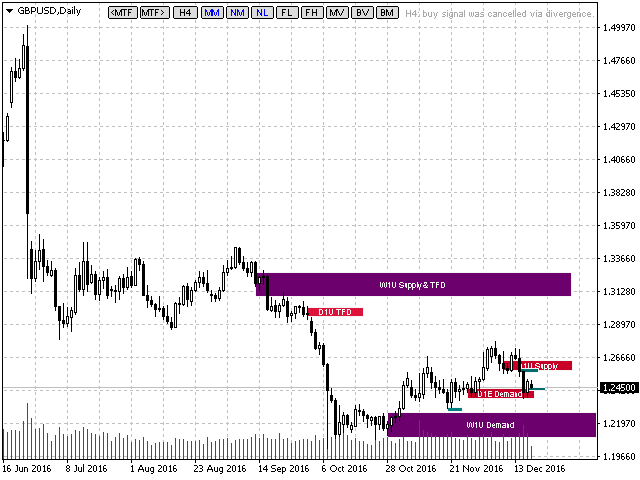
Updated algorithm of assigning the Demand or Supply status to levels relative to the trend direction based model. A trade recommendation is formed in accordance with the new algorithm. The algorithm of a reverse model remains unchanged.
Before generating a trading signal, the indicator checks for divergence - if the price is close to the level and volumes are rapidly growing, or if the price is approaching the level and the volumes are too low, the trading signal will be canceled, and an appropriate text message will be displayed.
版本 2.8
2016.12.01
Improved Demand and Supply calculation algorithm, and the algorithm of trade signal generation.
A trade signal which has become irrelevant due to market reasons (or temporarily irrelevant) does not disappear, but is dimmed instead.
版本 2.7
2016.10.07
In version 2.7, the volume level can also be formed on the last (current) candlestick, provided that the volume of the candlestick before completion has become greater than the volume of the previous candlesticks on this timeframe.
版本 2.6
2016.09.29
An additional literal is added to level names. It specified the trading sessions the current level belongs to, a-Asia, E-Europe, U-America. For example, the D1A name level means that this level has been formed on the candle with a peak volume on the D1 timeframe, and the peak volume within that day came during the Asian session.
The field, where the period set using the MTF buttons, is now also a button. When this button is pressed, only the levels of this period are displayed. In this mode the trade recommendation is formed only relative to the specified timeframe as well, without checking the correlation with the higher timeframe.
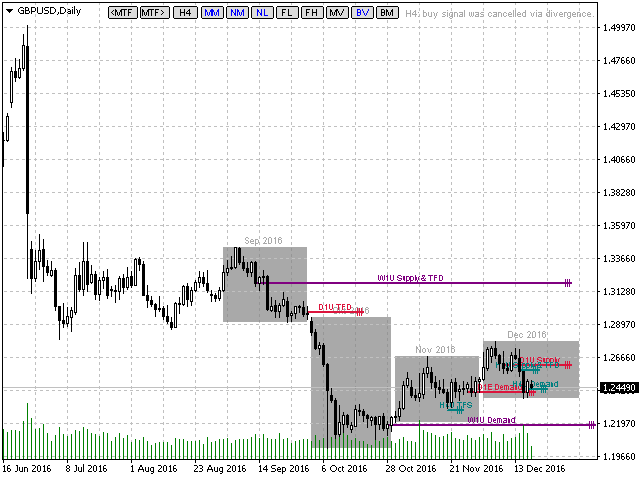
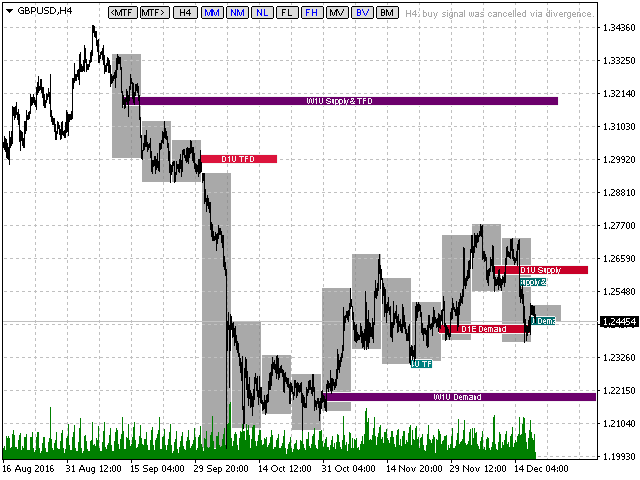
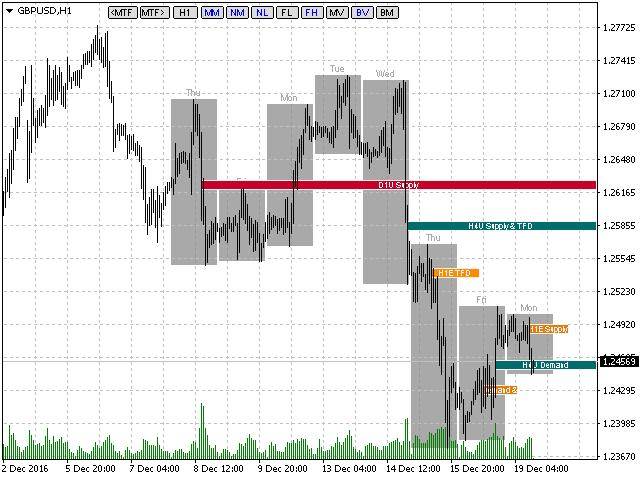
Added new mode for displaying levels - as thin lines with labels above. Due to this, the SV button has been renamed to MV (Markers View) and successively toggles three modes for displaying levels.
版本 2.5
2016.08.30
The indicator provides trading recommendations based on the correlation of Demand and Supply levels on the current and higher timeframes.
The current timeframe is the one set by MTF buttons in the indicator settings. The higher one is the next timeframe after the current one. H1 is a higher timeframe for M15, while H4 is a higher timeframe for M30.
Trading recommendations are displayed on the chart, as well as in alerts and push notifications.
The text contains:
Operation type – buy or sell, as well as recommended entry price, long-term target – tp, short-term target – ntp and profit factor – pf.
The long-term target is the target level (TFS or TFD) of a higher timeframe, while the short-term target is a target level (TFS or TFD) of the current timeframe. The profit factor is calculated relative to stop loss and short-term target levels when entering at a recommended price.
版本 2.4
2016.08.11
The version 2.4 displays the period frames:
М1 – quarter hour frame.
М5 – hour frame.
М15 – four-hour frame.
М30 – session (eight-hour) frame.
H1 – day frame.
H4 – week frame.
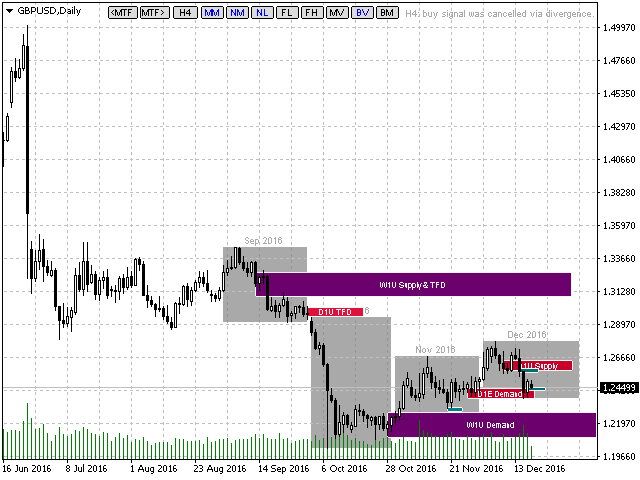
D1 – month frame.
W1 – quarter frame.
Period frames are displayed/hidden by the new button BV (BordersVisible). Frame color and text above the frames are set by BordersColor variable. Text font size above the frames is set by BordersFontSize input.
Besides, the volume level may also appear on the second to last candle providing that the candle volume exceeds the previous candle one. The level remains only if the current candle volume is less than the second to last candle one. Such a level is additionally marked by * character in its name, for example *D1 or *H4-Demand, hinting at the fact that the level is preliminary and may cease to exist.
版本 2.3
2016.07.19
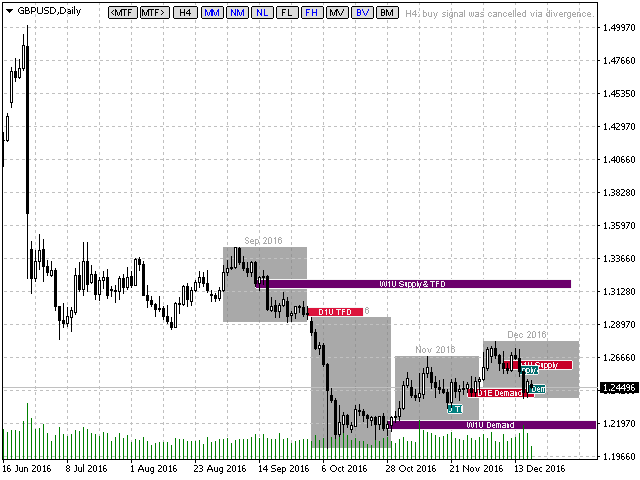
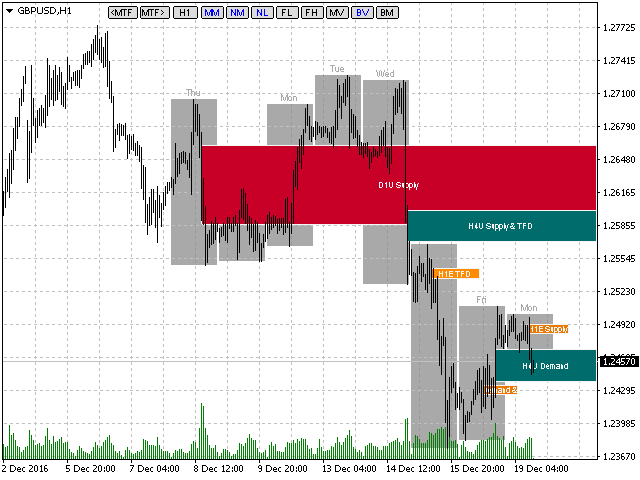
In the version 2.3, apart from supply and demand levels, the indicator finds target levels – TFD (Target For Demand) and TFS (Target For Supply). A target level for a demand one is the nearest level located to the left and above and not broken upwards. A target level for a supply one is the nearest level located to the left and below and not broken downwards. Target levels may coincide with supply and demand ones. In that case, they are labeled Demand&TFS or Supply&TFD.
版本 2.2
2016.05.10
Improved the identification algorithm of the supply and demand levels.
Changed the design of the indicator control buttons, therefore added new color variables:
ButtonsColor – background of the control buttons,
ButtonsTrueTextColor – text color of the active button,
ButtonsFalseTextColor – text and border color of the inactive button.
Added new button – SV (Surround View), in this mode the levels gain a volumetric appearance and seem to rise above the chart.
版本 2.1
2016.04.29
Fixed a minor bug and improved the identification algorithm of the supply and demand levels.
版本 2.0
2016.04.27
The indicator marks supply and demand levels.
The volume level receives Demand status if the closest volume level located above and to the left has been broken through upwards.
The volume level receives Supply status if the closest volume level located below and to the left has been broken through downwards.
The level status appears, changes, or remains unchanged only at the opening of a new candle of the timeframe it belongs to.
Overlaying of the same-status volume levels from different timeframes provides a good and accurate entry signal.
版本 1.9
2016.04.22
Added new button "FL – FixLength", in this mode the markers have a fixed length in monitor pixels, specified in the MarkersFixLength input variable.
Added new button "FL – FixHeight", in this mode the markers have a fixed height in monitor pixels, specified in the MarkersFixHeight input variable.
版本 1.8
2016.04.18
Improved graphical representation of volume levels (markers). The levels now fit together visually quite well. Each level is signed in accordance with the timeframe it belongs to.
Added the new inputs:
MarkersFontSize – font size of the marker on a volume level. If 0, the marker is not displayed. If the level width is less than the specified font size, the marker is automatically hidden as well.
MarkersBorderColor – marker and volume level border color.
版本 1.7
2016.03.24
Volume levels (markers) are now highlighted in different colors depending on a timeframe they belong to. Therefore, the color inputs have been added: MarkersW1Color, MarkersD1Color, MarkersH4Color, MarkersH1Color, MarkersM30Color, MarkersM15Color, and MarkersM5Color.
Added the new button/function "NL" - Normalization Length. If 'true', the marker length is proportional to the volumes of the candles in the timeframe they belong to. Thus, the markers of higher timeframes become longer for better visibility of the levels. If 'false', the marker length is proportional to the current timeframe volumes.
版本 1.6
2016.03.08
Improved the volume levels (markers) calculation algorithm.
版本 1.5
2016.02.15
In the Nearest Markers mode, the indicator now displays three markers that are the closest by time and located above and below the current price.
版本 1.4
2016.02.08
Markers are now displayed on the M5 period.
The main indicator management functions have been moved to the buttons:
MTF – Markers Time Frame, MM – Markers Mode, NM – Nearest Markers, BM – Box Mode.


Хороший индикатор.