PZ Day Trading
- 指标
- PZ TRADING SLU
- 版本: 7.0
- 更新: 27 六月 2021
- 激活: 20
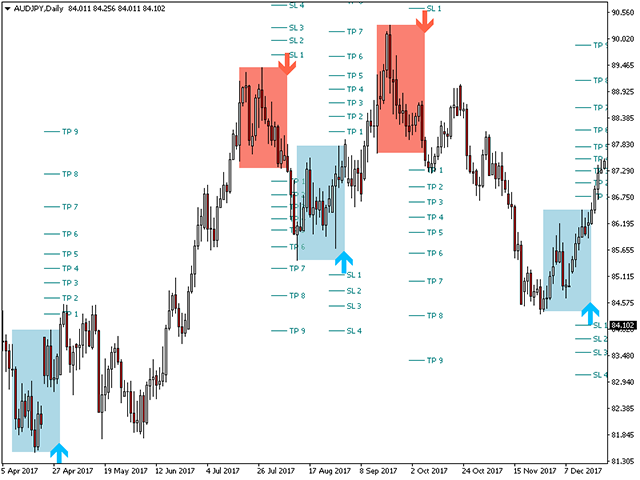
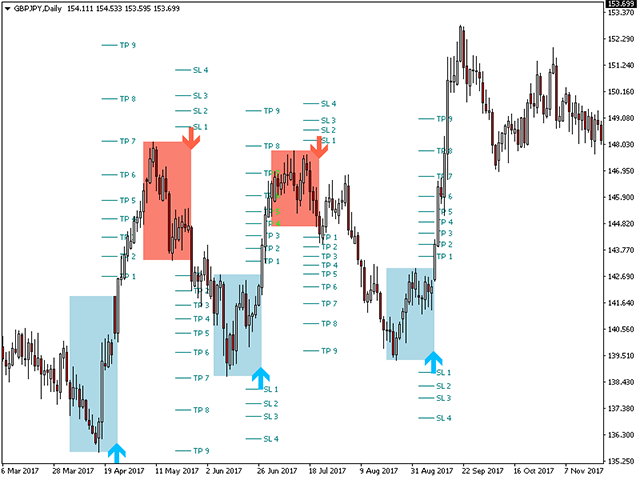
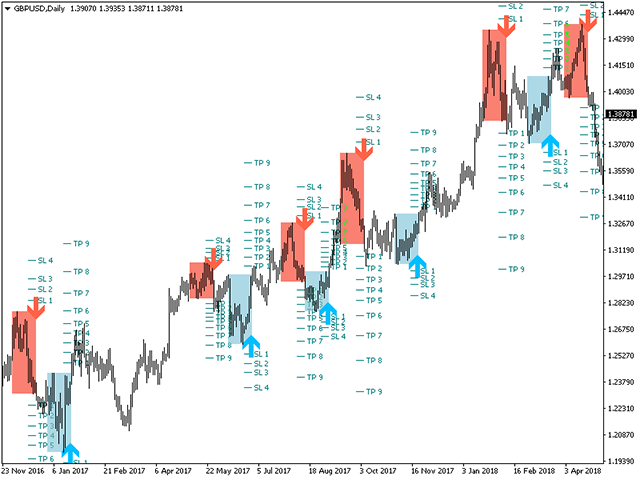
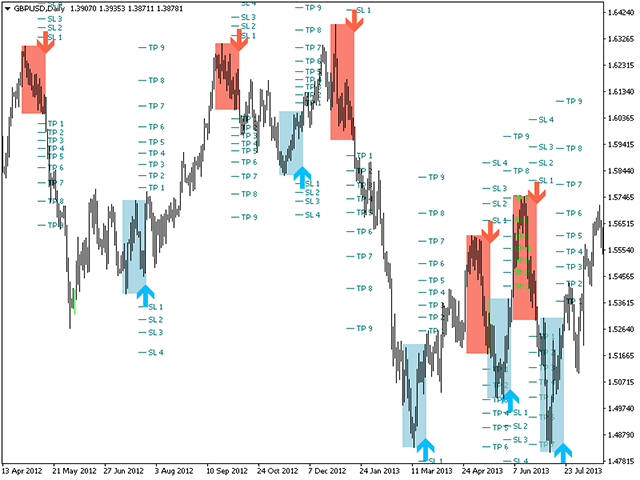
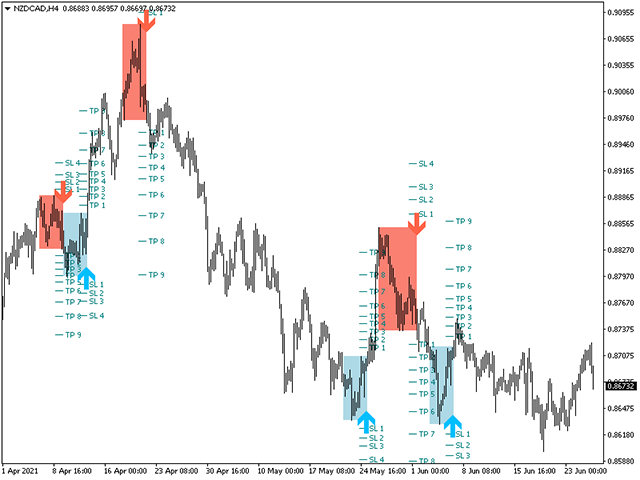
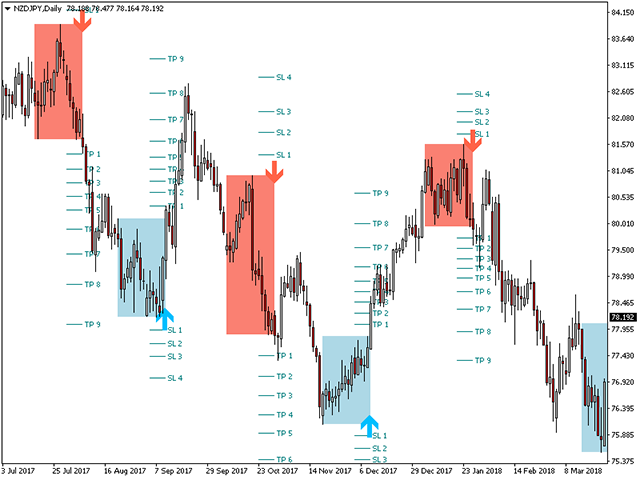
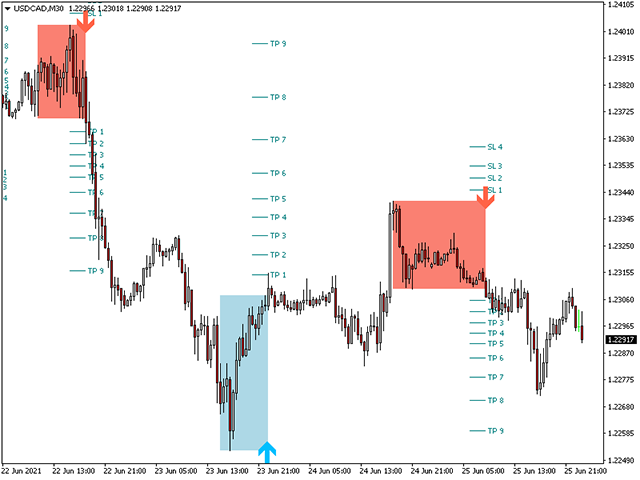
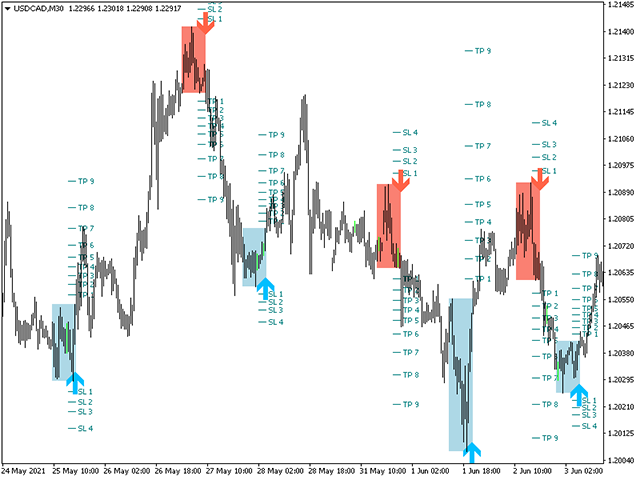
该指标仅使用价格行为分析和donchian渠道以锯齿形检测价格反转。它是专门为短期交易而设计的,根本不需要重新粉刷或补漆。对于精明的交易者来说,这是一个绝佳的工具,旨在增加他们的运作时间。
[ 安装指南 | 更新指南 | 故障排除 | 常见问题 | 所有产品 ]
- 极易交易
- 它在每个时间段都提供价值
- 实施自我分析统计
- 它实现了电子邮件/声音/视觉警报
基于可变长度的突破和拥挤区域,该指标仅使用价格行为来选择交易并对市场快速做出反应。
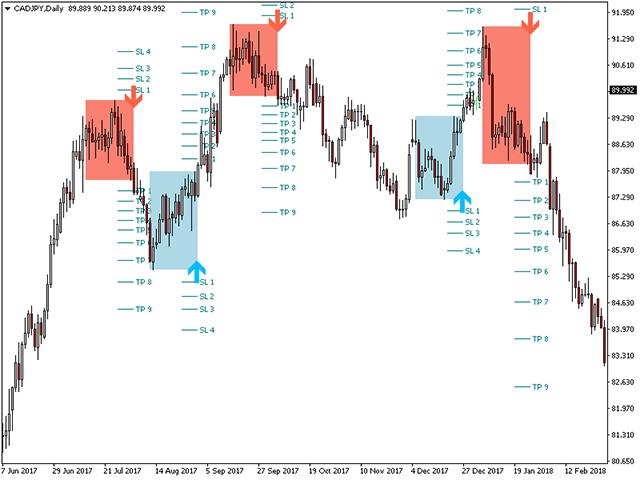
- 显示过去信号的潜在利润
- 该指标分析其自身的质量和性能
- 突围的损失突出显示并解决
- 该指标是不可重涂和不可重涂的
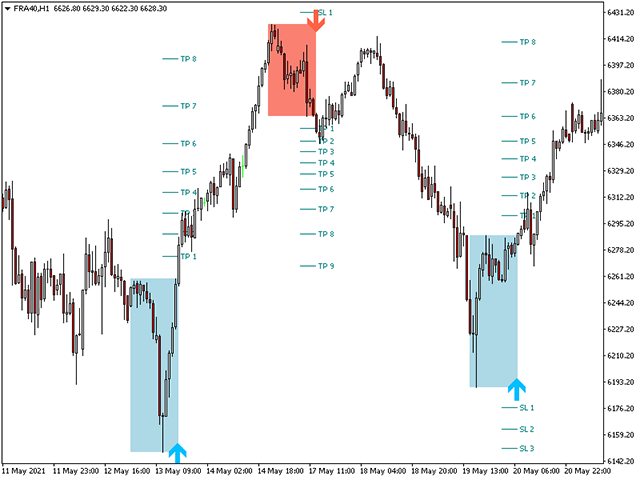
该指标将帮助盘中交易者不要错过单个价格反转。但是,并非所有价格反转都是一样的,也不是具有相同的可行质量。决定要突破哪些突破而忽略哪些取决于交易者的良好判断。
如何解释统计数据
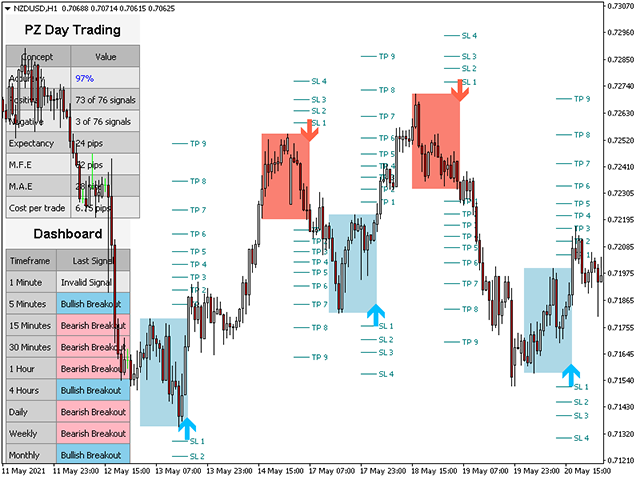
该指标研究其自身信号的质量,并在图表上绘制相关信息。将分析每笔交易,并在图表的左上角显示总体历史结果,这使您可以针对任何给定的工具和时间范围自行优化指标参数。每个乐器和时间表都有其自己的最佳设置,您可以自己找到它们。
- 最大优惠交易:对于任何给定的交易,MFE都是最好的结果。
- 最大不利波动:对于任何给定交易,MAE都是最糟糕的结果。
- 平均绝对期望值:AAE是您可以通过从MFE中减去MAE获得的任何给定交易的绝对偏移量,它反映了进入策略的真实质量。换句话说,进入策略是通过显示的所有交易的平均最佳可能结果与平均最坏可能结果之间的关系来衡量的。
- 亏损交易:查看图表中的亏损交易将有助于您避免将来出现亏损。
该指标使用两条虚线和两个价格标签显示每笔交易的最佳结果和最差结果,并将其中的每一个都计入图表的左上角的统计信息中。您可以使用这些统计信息自行针对任何给定的工具和时间范围优化指标参数。
输入参数
- 范围:该范围是认为突破有效并绘制信号的最小柱线数量。随着时间的推移,您需要增加此参数。例如,要交易一个月度图表,五个范围是好的,但是要交易H1图表,您将需要至少20-25条的范围。
- 过滤器:过滤器的功能是使用donchian通道及其所创建的价格范围的乘数,将其他信号彼此分离。较高的滤波器将减少图表中的信号量,但平均而言会增加最大有利偏移。
- 最大历史柱数:指标加载时要评估的过去柱数。减小此值可加快指示器的加载速度。
- 仪表板:启用或禁用多时间框架仪表板小部件。
- 统计信息:启用或禁用统计信息小部件。使用统计信息来找到每个交易品种和时间范围的最佳参数。逐步更改指标的输入参数,直到找到更高的准确性和期望值为止。
- 显示框:显示或隐藏突破价格范围附近的彩色框。
- 填充框:选择是否在突破框的内部填充颜色。
- 交易分析:启用或禁用图表中的单个交易分析。
- 警报:启用显示/电子邮件/推送/声音警报的突破。
支持和问题
向服务台咨询问题或及时获得支持。写电子邮件至:help@pointzero-trading.com
作者
ArturoLópezPérez,私人投资者和投机者,软件工程师,零零点交易解决方案的创始人。


All PZ tools are very well done.