PZ Harmonacci Patterns
- 指标
- PZ TRADING SLU
- 版本: 11.6
- 更新: 19 十一月 2019
- 激活: 20
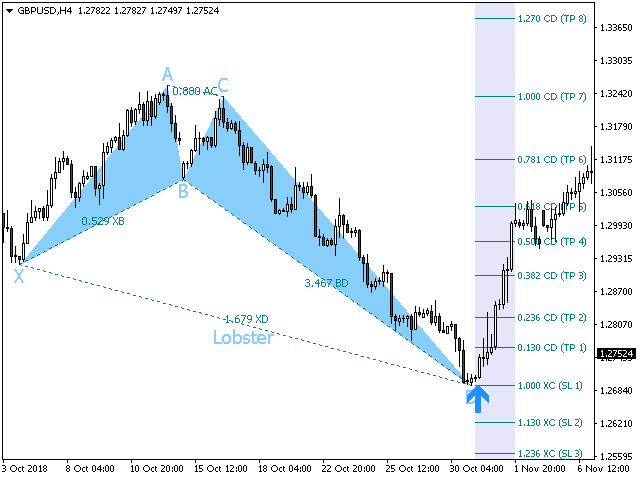
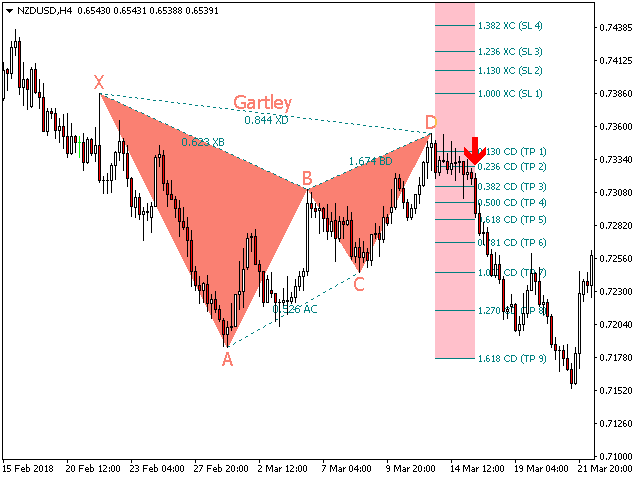
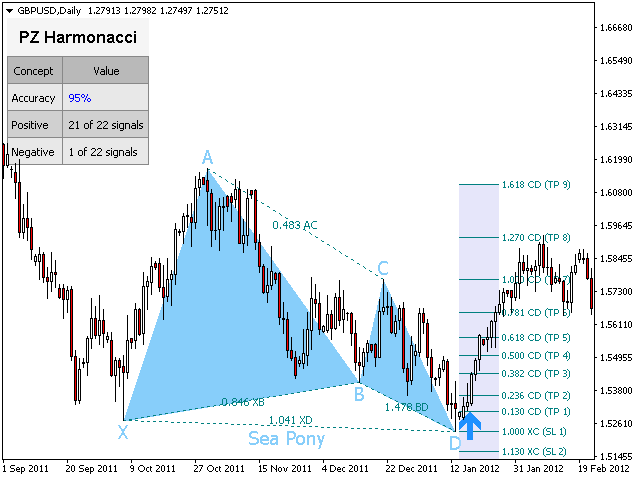
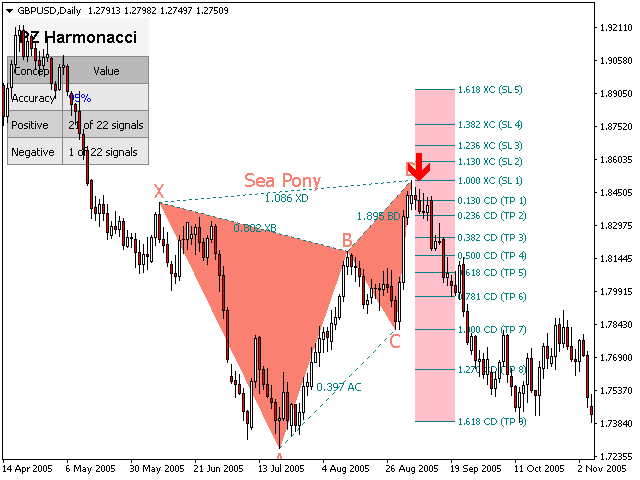
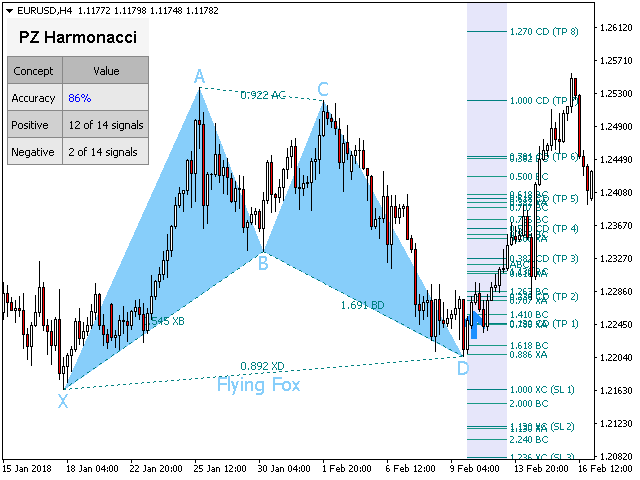
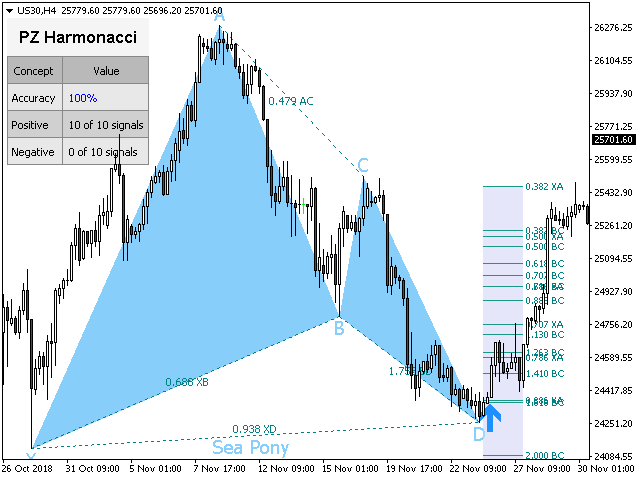
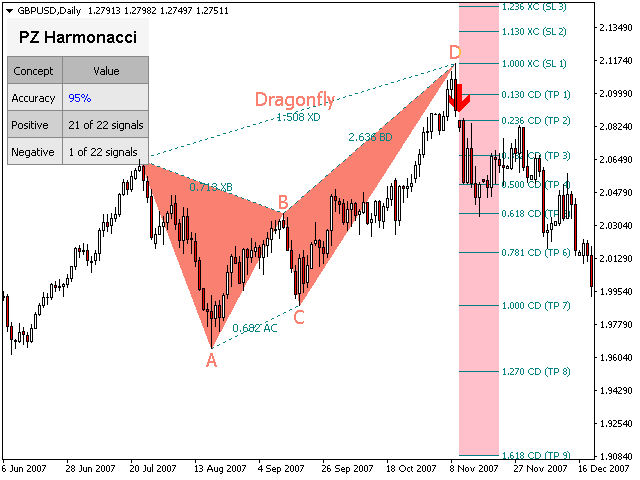
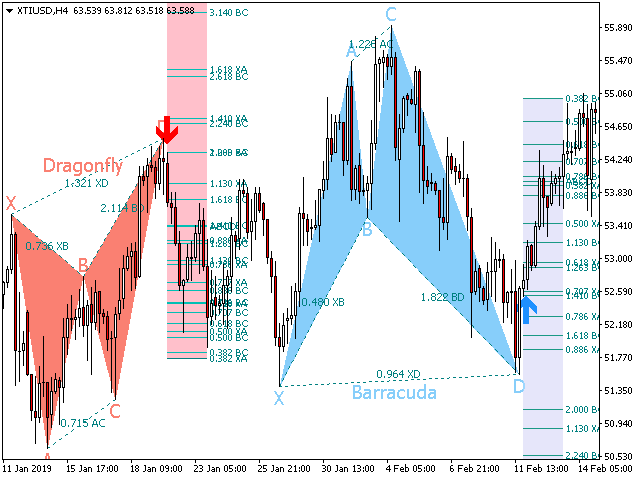
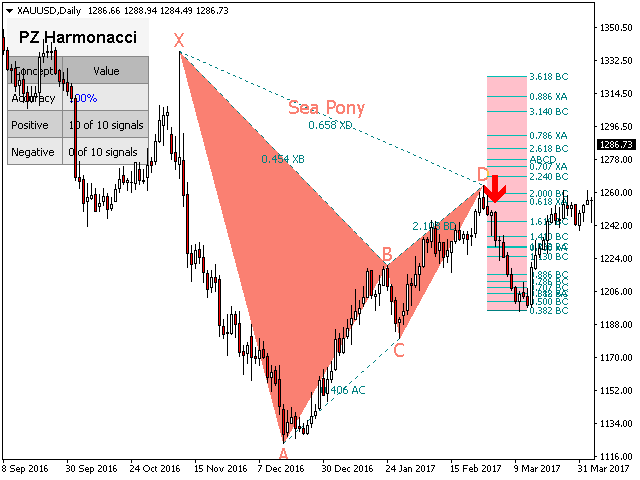
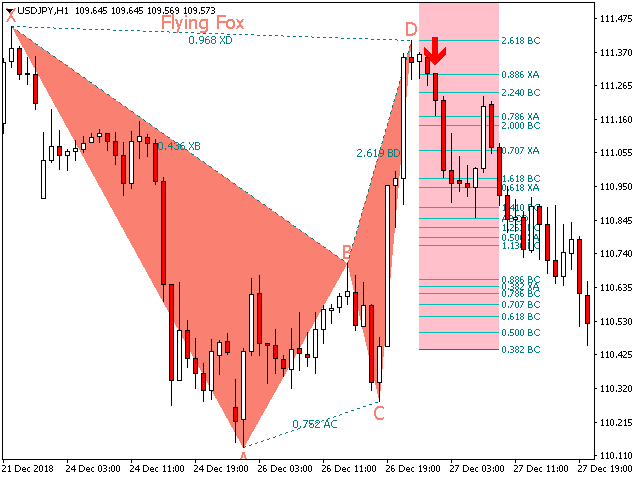
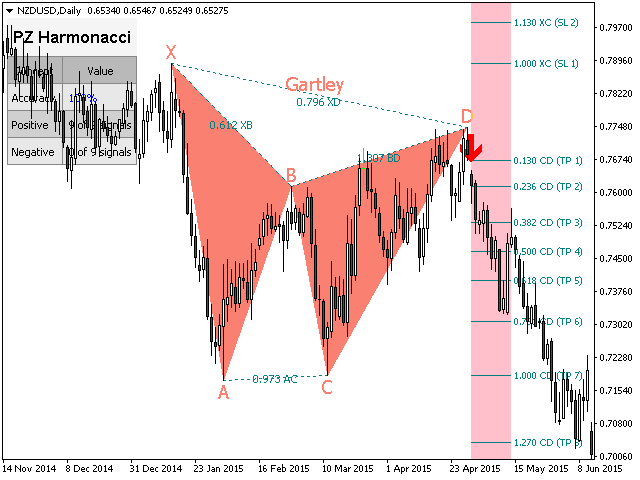
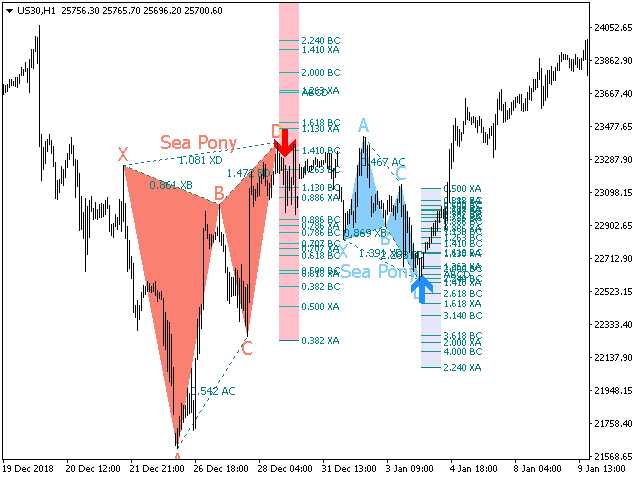
可以说,这是您可以为MetaTrader平台找到的最完整的谐波价格形成自动识别指标。它检测19种不同的模式,像您一样认真对待斐波那契投影,显示潜在的反转区域(PRZ),并找到合适的止损和获利水平。
[ 安装指南
| 更新指南
| 故障排除
| 常见问题
| 所有产品
]
- 它检测19种不同的谐波价格形态
- 它绘制了主要,衍生和互补的斐波那契投影(PRZ)
- 它评估过去的价格走势并显示每个过去的形态
- 该指标分析其自身的质量和性能
- 它显示合适的止损和获利水平
- 它使用突破来表明合适的交易
- 它在图表上绘制所有样式比率
- 它实现了电子邮件/声音/视觉警报
受斯科特·M·卡尼(Scott M. Carney)的书的启发,该指标旨在满足最纯粹和最熟练的交易者的需求。但是,它采取了一种使交易更容易的方式:在向交易发出信号之前,它会等待Donchian朝正确方向突破,从而使交易信号非常可靠。
- 斐波那契投影与向量无关
- 它实现了电子邮件/声音/推送警报
- 它绘制了ABCD投影
重要提示:为了符合Scott M. Carney先生的商标申诉,某些图案名称已重命名为不言自明的替代方式, Scott M. Carney先生在美国拥有以下商标: 谐波,谐波交易,蝙蝠图案,蝴蝶图案,鲨鱼图案,螃蟹模式和五O模式
。
支持的谐波价格形成
| 名称 | 最小XB | 最大XB | 最小AC | 最大AC | 最小DB | 最大BD | 最小XD | 最大XD |
|---|---|---|---|---|---|---|---|---|
| Flying Fox | 0.382 | 0.5 | 0.382 | 0.886 | 1.618 | 2.618 | 0.886 | 0.886 |
| Gartley | 0.618 | 0.618 | 0.382 | 0.886 | 1.272 | 1.618 | 0.786 | 0.786 |
| Lobster | 0.382 | 0.618 | 0.382 | 0.886 | 2.24 | 3.618 | 1.618 | 1.618 |
| Dragonfly | 0.718 | 0.718 | 0.382 | 0.886 | 1.618 | 2.618 | 1.272 | 1.618 |
| Cypher | 0.382 | 0.618 | 1.13 | 1.414 | 1.272 | 2.0 | 0.786 | 0.786 |
| Barracuda | - | - | 1.13 | 1.618 | 1.618 | 2.24 | 0.886 | 1.13 |
| Alt Flying Fox | 0.382 | 0.382 | 0.382 | 0.886 | 2.0 | 3.618 | 1.13 | 1.13 |
| Deep Lobster | 0.886 | 0.886 | 0.382 | 0.886 | 2.618 | 3.618 | 1.618 | 1.618 |
| White Swan | 1.382 | 2.618 | 0.236 | 0.5 | 1.128 | 2.0 | 1.126 | 2.618 |
| Black Swan | 0.382 | 0.724 | 2.0 | 4.237 | 0.5 | 0.886 | 0.382 | 0.886 |
| Max Bat | 0.382 | 0.618 | 0.382 | 0.886 | 1.272 | 2.618 | 0.886 | 0.886 |
| Max Gartley | 0.382 | 0.618 | 0.382 | 0.886 | 1.128 | 2.236 | 0.618 | 0.786 |
| Max Dragonfly | 0.618 | 0.886 | 0.382 | 0.886 | 1.272 | 2.618 | 1.272 | 1.618 |
| Alt Barracuda | 0.446 | 0.618 | 0.618 | 0.886 | 1.618 | 2.618 | 1.128 | 1.128 |
| A Lobster | 0.276 | 0.446 | 1.128 | 2.618 | 1.618 | 2.618 | 0.618 | 0.618 |
| A Dragonfly | 0.382 | 0.618 | 1.128 | 2.618 | 1.272 | 1.272 | 0.618 | 0.786 |
| A Flying Fox | 0.382 | 0.618 | 1.128 | 2.618 | 2 | 2.618 | 1.128 | 1.128 |
| A Gartley | 0.618 | 0.786 | 1.128 | 2.618 | 1.618 | 1.618 | 1.272 | 1.272 |
| Sea Pony | 0.128 | 3.618 | 0.382 | 0.5 | 1.618 | 2.618 | 0.618 | 3.618 |
输入参数
- 幅度-此参数控制在图表中找到的图案的大小。
- 偏差-用于模式识别的算法摆动空间。增加它以查找更多模式。
- 突破期-交易信号的Donchian突破期。
- 最大历史记录条-指标加载时评估的历史记录条数。
- 显示统计信息-启用或禁用性能屏幕统计信息。
- 显示点-显示价格点标签(X,A,B,C,D标签)。
- 显示比例-显示图案比例。
- 显示投影-显示电位反转区(PRZ)
- 显示止损/止损水平-显示合适的止损和止盈水平。
- 图案设置-选择要扫描的图案:禁用所有不使用的图案。
- 图纸设置-配置看涨和看跌图案的颜色以及字体大小。
- 比率-启用或禁用比率并选择自己的比率颜色。
- 投影-在图表上显示或隐藏斐波那契投影。
- 突破-启用或禁用突破,并设置所需的箭头大小和颜色。
- 警报-启用显示/电子邮件/推送/声音警报,以了解突破,图案或同时出现两者。
作者
ArturoLópezPérez,私人投资者和投机者,软件工程师, PZ Trading的创始人。


Good indicator, works very well. Easy to use and lots of settings to tweak the indicator the way you like. It's not signals indicator..use it as part of your trading strategy or trading system. The new updated version is way much better than the older versions. The price is high, but overall it's good investment. I suggest to add option to show possible stop loss and targets based on fibo levels.. they could appear after breakout arrow, and deleted once new pattern is formed. Just a suggestion :) Thanks