PZ Support Resistance
- 指标
- PZ TRADING SLU
- 版本: 6.4
- 更新: 28 四月 2021
- 激活: 20
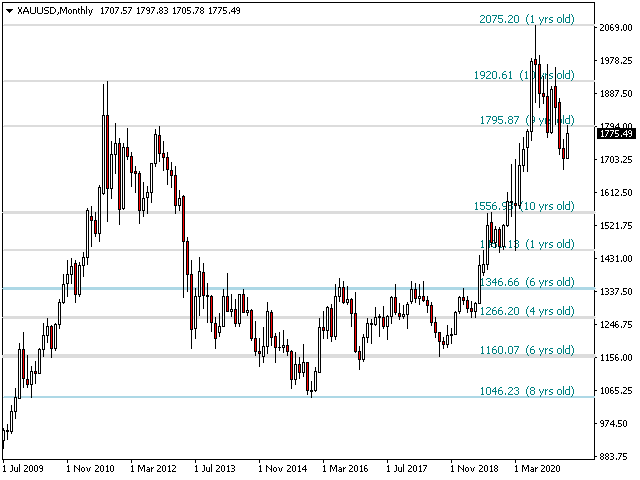
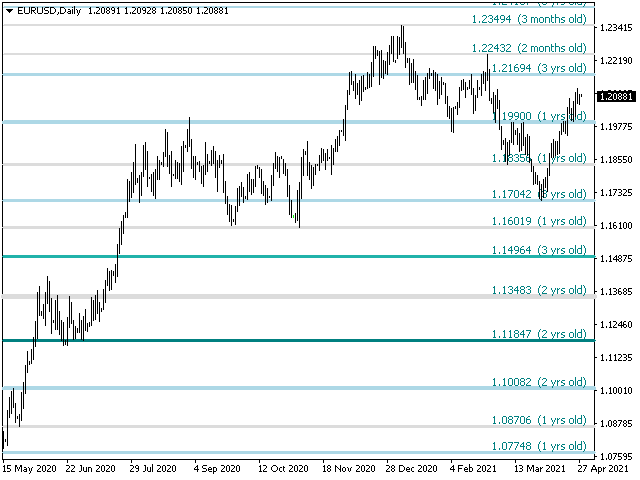
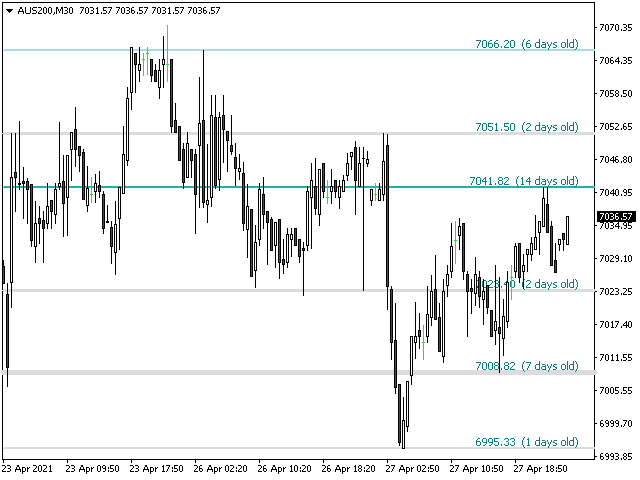
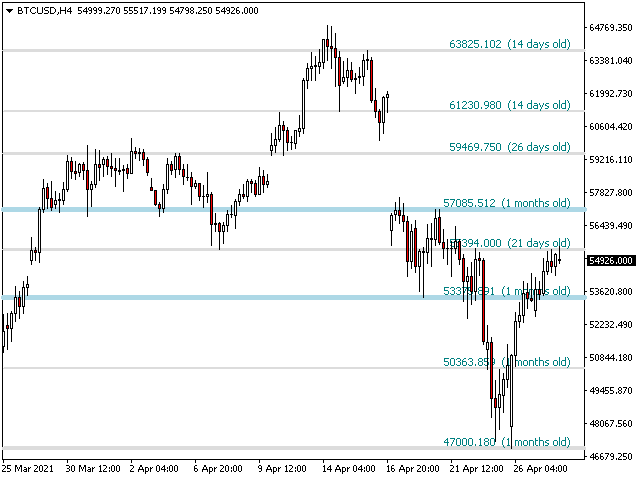
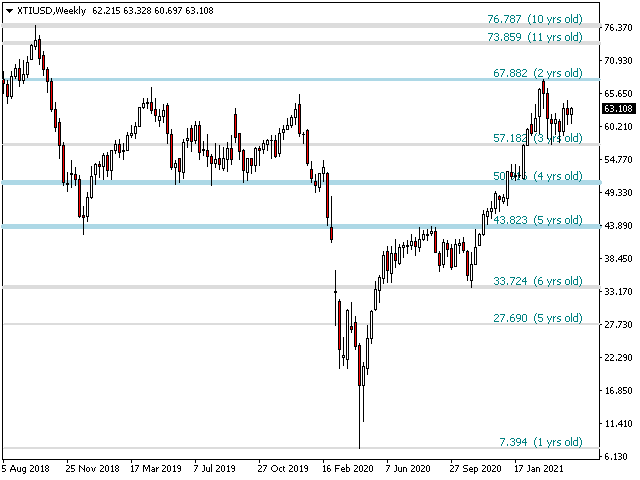
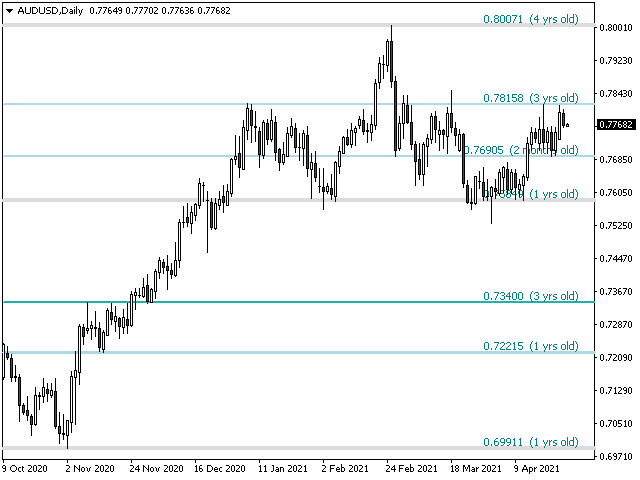
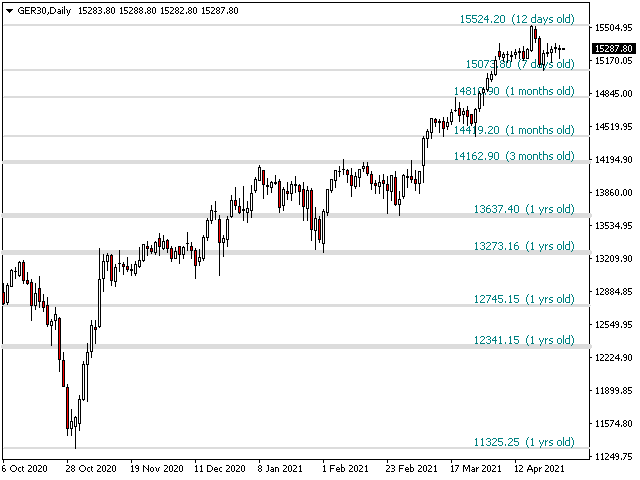
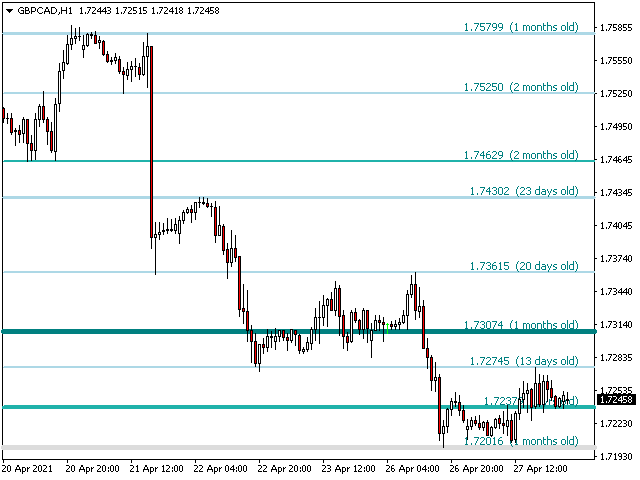
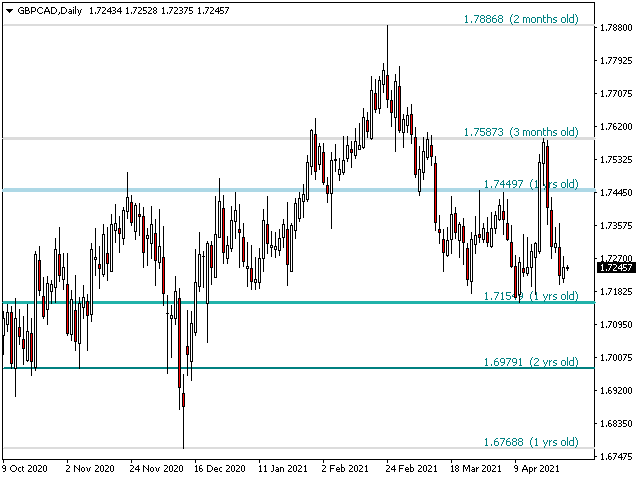
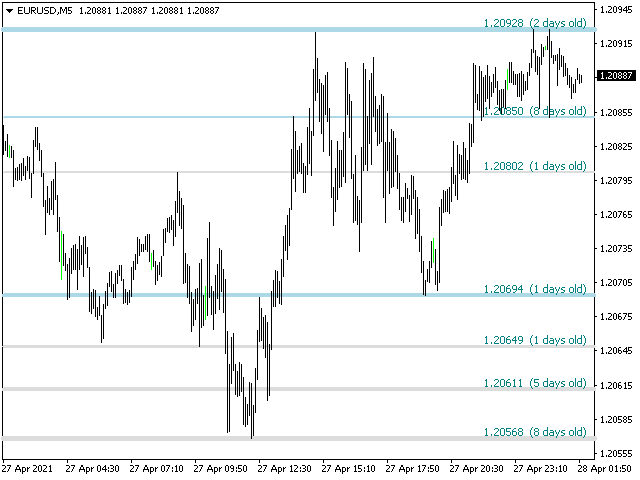
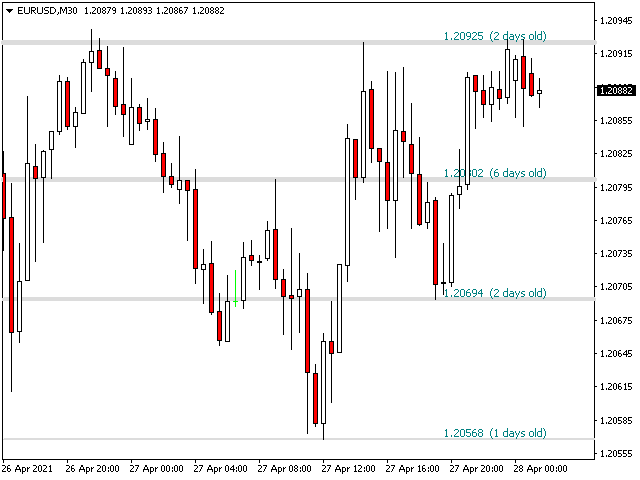
厌倦了绘制支撑线和阻力线? 支撑阻力是一个多时间指标,可以自动检测并绘制图表中的支撑线和阻力线,并具有非常有趣的变化:随着时间的推移测试价格水平及其重要性的提高,线变得越来越粗。
[ 安装指南 | 更新指南 | 故障排除 | 常见问题 | 所有产品 ]
- 一夜之间增强您的技术分析
- 无需浏览图表即可检测重要的价格水平
- 一目了然地识别所有价格水平的相对优势
- 每次交易最多可节省半小时的绘图线
- 指标显示所有价格水平的期限
- 指示器不重涂
过去和现在的价格水平因接近程度而崩溃,并根据当前的市场行为进行了调整。在动作发生的地方绘制了线条,而不一定在峰值处绘制了线条。
- 价格水平随着时间的推移而被拒绝,变得越来越暗
- 定期清除不重要的价格水平以避免噪音
- 可自定义的时间范围选择和崩溃因子
- 它实现了电子邮件/声音/推送警报的突破
输入参数
- 指标设置:指标将从当前时间段读取价格,但您可以选择另一个。例如,您可以在H4图表中显示D1支撑线和阻力线。您还可以使用价格水平密度参数选择在图表上显示多少价格水平。
- 颜色设置:根据重要性输入所需的支撑线和阻力线颜色。
- 标签设置:(可选)可以在指示器中显示用于显示每个支撑线和阻力线寿命的标签。默认情况下禁用此功能。您可以选择标签字体和大小。
- 警报:启用显示/电子邮件/推送/声音警报的突破。
作者
ArturoLópezPérez,私人投资者和投机者,软件工程师,零零点交易解决方案的创始人。
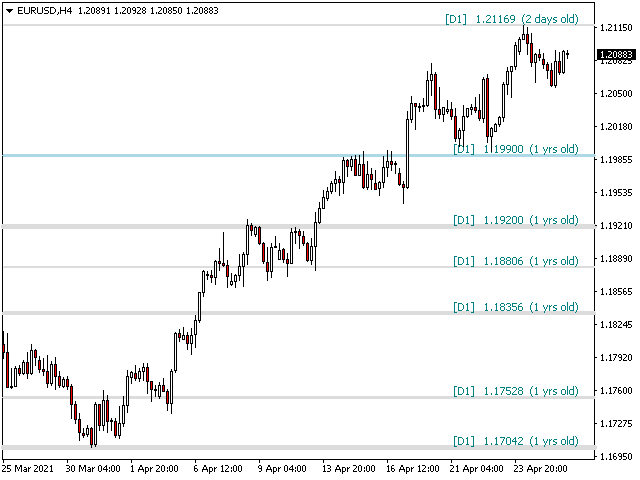


At D1 it works quite well.