Extended Traders Dynamic Index MT5
- 指标
- Sergey Efimenko
- 版本: 1.8
- 更新: 6 三月 2024
- 激活: 10
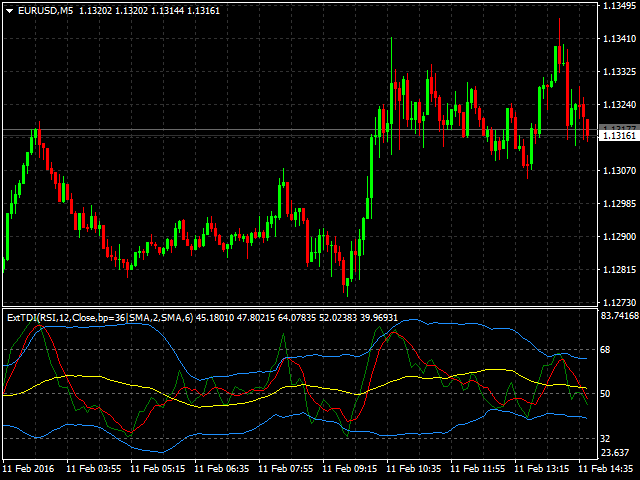
该指标允许您确定当前的价格方向和市场波动。此版本的交易者动态指数消除了历史数据的重绘,优化了算法计算速度,更多的外部参数进行了更精确的调整,并扩展了其功能:增加了初始振荡器的选择和平均线的平滑方法.
参数:
- Mode Osc - 估计振荡器选择
- Period Osc - 所用振荡器的计算周期
- Price Osc - 振荡计算的应用价格
- Osc volatility bands period - 振荡器的波动周期
- Osc volatility bands multiplier - 振荡器的波动率乘数
- Smoothing Osc price line period - 主线平滑期
- Smoothing Osc price line method - 主线的平滑方法
- Smoothing Osc signal line period - 信号线的平滑周期
- Smoothing Osc signal line method - 信号线的平滑方法
- Use original levels - 允许添加指标的初始水平水平
A great indicator for MT5. Can't thank Sergey enough. Completely configurable, I have mine set to the old MT4 'Pro' settings. Author answers questions very quickly and went out of his way to make a purely cosmetic alteration. 5 Stars+ Many thanks.