Kagi 制图指标
Dmitriy Zabudskiy | 27 五月, 2014
简介
在 "点数图指标" 一文中介绍了创建 点数图的编程方式。点数图自 19 世纪起开始广为人知。但这并不是唯一一种历久弥新的绘图方式。早期金融市场还有一种值得注意的绘图方式就是Kagi 图。我们将在本文中讨论这种图表。
证券交易所对于十九世纪的日本来说是一种陌生的金融机构,日本第一家证券交易所成立于 1878 年 5 月。也就是现在的 东京证券交易所。这件事对于 Kagi 图的发明和发展起到重要作用。欧洲和美国是在 1994 年 Steve Nison 的 "Beyond Candlesticks:New Japanese Charting Techniques Revealed"(日本烛形图技术新解) 一书出版后才开始知道 Kagi 图的。
在日语中,“Kagi” 一词表示在发明这种图表的那个年代人们使用的一种 L 形钥匙。同样,这种图还有另一个名称,“钥匙图”。在 Steve Nison 的《日本烛形图技术新解》一书中,您还会看到这种图表的多个别名:价格范围图、钩形图、三角或链形排列图。
这种图有哪些特别之处?它的主要特点在于忽略了时间尺度,仅留下价格尺度(不同于日本的烛形图、柱状图和线形图)。这样,图表将细微的价格浮动隐藏起来,仅显示最明显的价格浮动。
图中展示了一组较粗的阳线和较细的阴线,它们随着市场形势的变化相互交替。市场朝同一方向发展时,线条会延伸到达新的价格范围。但是,如果市场折回并达到预先设定的量,Kagi 线会在新一列中朝相反的方向绘制。这个预先设定的量是以点数(通常用于货币对)或当前价格的百分比数值(通常用于股票)来表示的。线条粗细随距其最近的最高或最低值发生变化。
1. 图表示例
我们以 10 月 8 日到 10 月 11 日 EURUSD,H1 图表的历史数据为例。
图 1 显示的是一幅反向门槛为 15 点的标准图像:
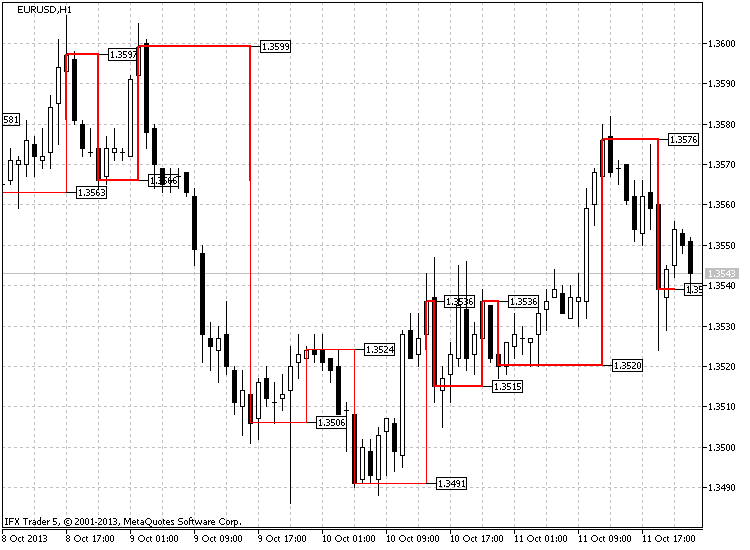
图 1 Kagi 图,EURUSD H1
我们可以看到,价格从 17:00 开始下跌。下跌趋势一直持续到 21:00。22:00 时,价格从 1.3566 开始上升,最后以 1.3574 收盘。换句话说,价格覆盖了 11 点。这不足以形成逆转,但也没达到新的最低点。之后的两个小时,价格走势平稳,最后在 01:00(10 月 9 日)看到一次强势增长,并以 1.3591 点收盘,增幅达 25 点(1.3591-1.3566)。这意味着价格出现逆转。
这一上升趋势又持续了一个小时。价格达到 1.3599,加强了较粗的阳线。03:00 时,价格急剧下降,以 1.3578 收盘,比之前的最高点低 21 点(1.3599-1.3578)。这足以发生逆转。线条开始向下移动,但形式(粗阳线)没有发生变化。
到 16:00 时,价格下降并最终突破了距离最近的最低值,从粗阳线变为细阴线。之前提到的最低值,即 1.3566,在这里成为突破价。价格继续以阴线的形式移动,并在 10 月 10 日 14:00 变成阳线,突破了距离最近的最高点,也就是 10 月 9 日 23:00 形成的 1.3524。这个小例子展示了 Kagi 图的结构。
2. Kagi 指标制图原则
为了使该指标独立于当前时间表,决定单独复制计划用来形成指标的时间表数据,然后用得到的数据创建指标。
这样便可以在同一图表上同时查看多个时间表,扩大了 Kagi 图的技术分析界限。指标本身位于一个单独的窗口中,但也可以在主图上显示数据。也就是说,指标窗口中显示了基本信息(标准样式或修订样式)。已将指标复制到主图,并绘制出价格和时间标记(取决于设置)。
如前所述,指标绘制出标准版和修订版图表。上面介绍了标准版图表。现在我们来看修订版。
不知道这是不是一种新理念,但我没听说过这样的版本。附加过滤器的理念就是它现在不仅会过滤反转点,还会过滤图表的每一步动作。也就是说价格应移动一定距离以形成新的最高或最低点(不与肩/腰混淆)。一般来说,无论价格走向如何,都应首先移动指定距离。之后再确定它是延续了之前的趋势还是发生了反转。
图 2 显示了这一原则的运作原理。修订后的图表样式显示为蓝色,标准样式显示为红色。我们可以看到,修订后的样式对价格变动的反应较慢,会过滤多数小信号。
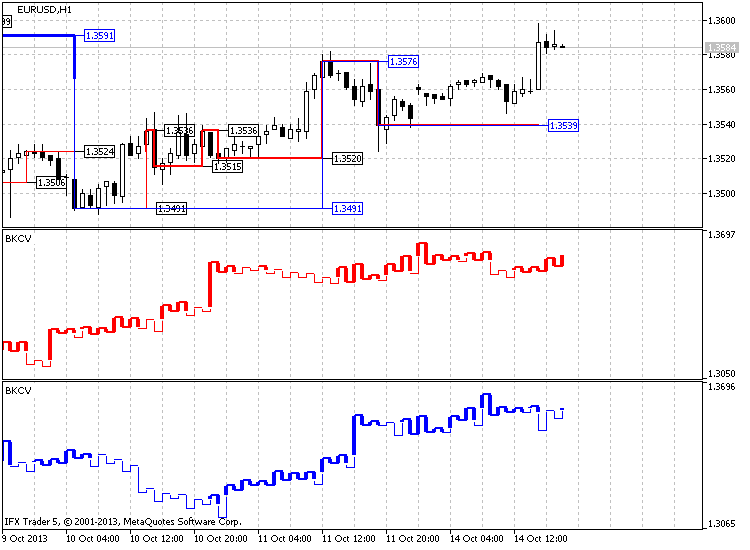
图 2 创建修订版(蓝线)和标准版(红线) Kagi 图
除 Kagi 图外,指标还在指标窗口和主图中提供其它元素。
根据设置,可在指标窗口中设置这些标记。这些标记提供了反转价格数据。也可以用价位实现同样的功能,位于形成指标所用的整个价格范围内或位于每个图表反转点上的各个价位(取决于设置)均匀分布在窗口中。可根据以下三个条件设置颜色:根据反转类型(向上 - 向下)、线条类型(阴 - 阳)或无颜色变化。
主图中提供了反转价格标记,包括临时标记。这些标记(取决于设置)可能为同一颜色,或根据阴阳线的颜色改变颜色。
可利用通过全局变量相互交流的函数实现整个指标代码。
代码可分为三个主要函数和十一个附加函数。基本作图法的主要运算任务和缓冲区填充数据以及附加的缓冲区数组都由指标窗口中 Kagi 图的函数承担。另外两个函数负责提供数据:第一个负责复制时间数据,另一个负责复制选定时间表中每个柱的价格数据。
其它辅助函数负责执行所有作图工作,包括删除对象,卸载指标连同删除所有指标对象,反转参数计算,在主图和指标窗口中绘制标记,创建“走势线”类图形对象,在主图上绘制 Kagi,以及确定新柱的出现以开始形成指标。
3. 指标代码与算法
下面我们仔细了解一下指标代码以及形成该代码的算法。这个代码非常大,新手程序员也许难以理解。通过全局变量相互交流的各个函数使这个代码变得非常混乱。本文将在这一部分分别讲解每个函数以及部分代码。首先,我会介绍指标设置,然后再对复制初始函数的相关数据、反转参数计算、Kagi 图主函数的形成和计算以及其它辅助函数进行说明。
3.1. 指标输入参数
代码从在单独的窗口中声明指标开始,同时声明 12 个缓冲区以及 8 种指标作图法。首先,我们来看为什么选择 8 种作图法,包括两个 “柱状图” 和六个 “线形图”。每个“柱状图”都建立了自己的垂直线。其中一条线负责阴线,另一条负责阳线。
如果存在多条线,则情况会更为复杂,因为每条线都包含三个图形结构。这是因为只要在第一个点附件画出另外一个点,就可以画出一条线。也就是说,我们只需要旋转两个 “线”型图形结构就可以绘制出相互毗邻的两条线。但是,如果我们需要让这些线跳过一些必要的点,就需要第三个图形结构随前两个一起旋转。
图 3 中对此做出了说明,您可以看到使用两个“线”型图形结构的情况:
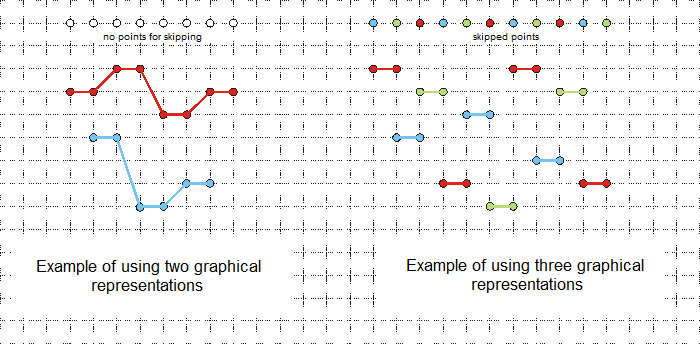
图 3 使用两个和三个图形“线”型结构展示肩线与腰线示例
然后,创建设置菜单。这里列举出五项(我们到输入参数中查看这五项)。
第一个输入参数“周期”是形成该结构的周期,随后是 “period_to_redraw” - 图表结构更新周期,最后一个参数是 “start_data” - 时间结构的起点。
这些参数之后是图表结构和其它标签参数:
- kagi_type – 用户定义的图表结构类型,即标准型或修订型;
- price_type – 作图使用的价格类型:收盘价、开盘价、最高价、最低价;
- type_doorstep – 使用的反转类型:点和百分比;
- doorstep – 反转值(根据上述参数指定点数或百分比数值);
- color_yin – 指标窗口中的阴线颜色;
- color_yang – 指标窗口中的阳线颜色;
- width_yin – 指标窗口中的阴线宽度;
- width_yang – 指标窗口中的阳线宽度;
- levels_on_off – 是否应在指标窗口中绘制价格水平;
- levels_type – 指标窗口中的价格水平类别。有两个数值可供选择:每次反转时或在整个价格范围内均匀分布;
- levels_number – 指标窗口中的价格水平数目;
- levels_change_color – 允许更改价格水平线颜色;选项包括高低反转、阴阳线或无变化;
- levels_first_color – 一个价格水平的第一种颜色;
- levels_second_color – 一个价格水平的第二种颜色;
- label_1 – 在指标窗口中绘制图表反转价格标签;
- label_1_number – 指标窗口中显示的标签数目;
- label_1_color – 指标窗口中价格标签的颜色;
- label_2 – 在主图中绘制价格标签;
- label_2_color – 主图上的标签颜色;
- time_line_draw – 在主图上绘制反转时间线;
- time_separate_windows – 绘制主图中反转时间线的延长线;
- time_line_change_color – 根据阴阳线上的反转标签更改时间线的颜色;
- time_first_color – 主图上时间线的第一种颜色;
- time_second_color – 主图上时间线的第二种颜色;
- kagi_main_chart – 是否需要在主图上绘制 Kagi;
- color_yin_main – 主图上的阴线颜色;
- color_yang_main – 主图上的阳线颜色;
- width_yin_main – 主图上的阴线宽度;
- width_yang_main – 主图上的阳线宽度;
- magic_numb – 用于建立并删除对象的幻数以及在指标名称中用于在一个图表中打开多个指标的幻数。
这些参数之后分别声明了指标缓冲区,用于保存价格和时间数值的辅助缓冲区,辅助变量(stop_data、bars_copied、bars_copied_time、copy_history、copy_time),用于将数据保存在图表移动发生变化的阴阳线上的数组,变化发生的时间和价格,以及中心价格(如果在柱上发生阴阳线替换)。最后,声明一个最常用的全局变量,其中包含 “a” 图表移动变化次数数据。
//+------------------------------------------------------------------+
//|                                                         BKCV.mq5 |
//|                                   Azotskiy Aktiniy ICQ:695710750 |
//|                          https://www.mql5.com/ru/users/Aktiniy |
//+------------------------------------------------------------------+
//--- Build Kagi Chart Variable
#property copyright "Azotskiy Aktiniy ICQ:695710750"
#property link      "https://www.mql5.com/en/users/Aktiniy"
#property version   "1.00"
#property description "Build Kagi Chart Variable"
#property description " "
#property description "This indicator makes drawing a chart Kagi as a matter of indicator window, and in the main chart window"
#property indicator_separate_window
#property indicator_buffers 12
#property indicator_plots   8
//--- plot Yin
#property indicator_label1  "Yin"
#property indicator_type1   DRAW_HISTOGRAM2
#property indicator_color1  clrRed
#property indicator_style1  STYLE_SOLID
#property indicator_width1  1
//--- plot Yin1
#property indicator_label2  "Yin1"
#property indicator_type2   DRAW_LINE
#property indicator_color2  clrRed
#property indicator_style2  STYLE_SOLID
#property indicator_width2  1
//--- plot Yin2
#property indicator_label3  "Yin2"
#property indicator_type3   DRAW_LINE
#property indicator_color3  clrRed
#property indicator_style3  STYLE_SOLID
#property indicator_width3  1
//--- plot Yin3
#property indicator_label4  "Yin3"
#property indicator_type4   DRAW_LINE
#property indicator_color4  clrRed
#property indicator_style4  STYLE_SOLID
#property indicator_width4  1
//--- plot Yang
#property indicator_label5  "Yang"
#property indicator_type5   DRAW_HISTOGRAM2
#property indicator_color5  clrRed
#property indicator_style5  STYLE_SOLID
#property indicator_width5  2
//--- plot Yang1
#property indicator_label6  "Yang1"
#property indicator_type6   DRAW_LINE
#property indicator_color6  clrRed
#property indicator_style6  STYLE_SOLID
#property indicator_width6  2
//--- plot Yang2
#property indicator_label7  "Yang2"
#property indicator_type7   DRAW_LINE
#property indicator_color7  clrRed
#property indicator_style7  STYLE_SOLID
#property indicator_width7  2
//--- plot Yang3
#property indicator_label8  "Yang3"
#property indicator_type8   DRAW_LINE
#property indicator_color8  clrRed
#property indicator_style8  STYLE_SOLID
#property indicator_width8  2
//--- Enumerations as input data (for more attractive setting)
//--- Kagi charting type
enum kagi_type_enum
  {
   classic=0,  // Classic
   modified=1, // Modified
  };
//--- Type of the price used for construction
enum price_type_enum
  {
   c=0, // Close
   o=1, // Open
   h=2, // High
   l=3, // Low
  };
//--- Type of the used reversal
enum type_doorstep_enum
  {
   point=0,   // Point
   procent=1, // Percent
  };
//--- Type of levels location
enum levels_type_enum
  {
   cor=0, // Cornering
   equ=1, // Equal distance
  };
//--- Level colors change type (works when "Type of levels location"="Cornering")
enum levels_change_color_enum
  {
   up_down=0,  // Up & Down
   yin_yang=1, // Yin & Yang
   no=2,       // Don't change
  };
//--- input parameters
input ENUM_TIMEFRAMES period=PERIOD_CURRENT;                // Calculation period to build the chart
input ENUM_TIMEFRAMES period_to_redraw=PERIOD_M1;           // Refresh period chart
input datetime start_data=D'2013.07.10 00:00:00';           // Start time to build the chart
input kagi_type_enum kagi_type=classic;                     // The type to build Kagi chart
input price_type_enum price_type=c;                         // Price used to build chart
input type_doorstep_enum type_doorstep=point;               // Type calculate doorstep
input double   doorstep=25;                                 // Doorstep reversal
input color    color_yin=clrRed;                            // Color Yin line (indicator window)
input color    color_yang=clrRed;                           // Color Yang line (indicator window)
input char     width_yin=1;                                 // Width Yin line (indicator window)
input char     width_yang=2;                                // Width Yang line (indicator window)
input bool     levels_on_off=false;                         // Draw level (indicator window)
input levels_type_enum levels_type=cor;                     // Type of drawing levels (indicator window)
input uint     levels_number=6;                             // Number of levels  (indicator window)
input levels_change_color_enum levels_change_color=up_down; // Type change color of levels (indicator window)
input color    levels_first_color=clrBeige;                 // The first color of level (indicator window)
input color    levels_second_color=clrCoral;                // The second color of level (indicator window)
input bool     label_1=true;                                // Draw price label on (indicator window)
input uint     label_1_number=10;                           // The number of labels (indicator window)
input color    label_1_color=clrGreenYellow;                // The color of labels (indicator window)
input bool     label_2=true;                                // Draw price label on (main chart)
input color    label_2_color=clrGreenYellow;                // The color of labels (main chart)
input bool     time_line_draw=true;                         // Draw a timeline reversal (main chart)
input bool     time_separate_windows=false;                 // Draw a timeline reversal on indicator window
input bool     time_line_change_color=true;                 // Different color timeline on the Yin and Yang lines (main chart)
input color    time_first_color=clrRed;                     // The first color of timeline (main chart)
input color    time_second_color=clrGreenYellow;            // The second color of timeline (main chart)
input bool     kagi_main_chart=true;                        // Draw Kagi on main chart (main chart)
input color    color_yin_main=clrRed;                       // Color Yin line (main chart)
input color    color_yang_main=clrRed;                      // Color Yang line (main chart)
input char     width_yin_main=1;                            // Width Yin line (main chart)
input char     width_yang_main=2;                           // Width Yang line (main chart)
input long     magic_numb=65758473787389;                   // The magic number for drawing objects
//--- indicator buffers
double         YinBuffer1[];
double         YinBuffer2[];
double         Yin1Buffer[];
double         Yin2Buffer[];
double         Yin3Buffer[];
double         YangBuffer1[];
double         YangBuffer2[];
double         Yang1Buffer[];
double         Yang2Buffer[];
double         Yang3Buffer[];
//--- additional variables
double Price[]; // Buffer for storing the copied price data
double Time[];  // Buffer for storing the copied time data
//---
datetime stop_data;      // Current time
int bars_copied=0;       // Number of the already copied bars from the initial date
int bars_copied_time;    // Number of the already copied bars having the initial date
bool copy_history=false; // Price history copying result
bool copy_time=false;    // Time history copying result
//---
datetime time_change[];      // Array for writing the time when the chart movement started changing (up or down)
char time_line[];            // Array for storing the data on what line (Yin=0 or Yang=1) direction has changed
double time_change_price[];  // Array for writing the chart movement change price
double time_central_price[]; // Array for writing the average price during the chart movement change

uint a=0; // Variable for building the chart, number of chart reversals is fixed
3.2. 指标初始化函数
下一个是指标初始化函数。这里对指标缓冲区及其索引(主要作为时间序列;Kagi 图比主图要短,因此最好可以向后画)做出说明。同时还要设置不在屏幕上显示哪些数值(EMPTY_VALUE=-1)。
现在我们来分配指标名称和设定显示精度。如前所述,名称中加入了幻数。这样做是为了正确运算 ChartWindowFind() 函数。否则,在指标窗口中绘出的图形对象会只在首次打开的指标中显示(如果在同一图表中使用多个指标)。
接下来,我们指定作图线名称,禁止在指标窗口中显示当前数值,设置阴阳线的颜色和宽度,设置在指标窗口中显示几个价格水平。
//+------------------------------------------------------------------+
//| Custom indicator initialization function                         |
//+------------------------------------------------------------------+
int OnInit()
  {
//--- indicator buffers mapping
   SetIndexBuffer(0,YinBuffer1,INDICATOR_DATA);
   ArraySetAsSeries(YinBuffer1,true);
   SetIndexBuffer(1,YinBuffer2,INDICATOR_DATA);
   ArraySetAsSeries(YinBuffer2,true);
   SetIndexBuffer(2,Yin1Buffer,INDICATOR_DATA);
   ArraySetAsSeries(Yin1Buffer,true);
   SetIndexBuffer(3,Yin2Buffer,INDICATOR_DATA);
   ArraySetAsSeries(Yin2Buffer,true);
   SetIndexBuffer(4,Yin3Buffer,INDICATOR_DATA);
   ArraySetAsSeries(Yin3Buffer,true);
//---
   SetIndexBuffer(5,YangBuffer1,INDICATOR_DATA);
   ArraySetAsSeries(YangBuffer1,true);
   SetIndexBuffer(6,YangBuffer2,INDICATOR_DATA);
   ArraySetAsSeries(YangBuffer2,true);
   SetIndexBuffer(7,Yang1Buffer,INDICATOR_DATA);
   ArraySetAsSeries(Yang1Buffer,true);
   SetIndexBuffer(8,Yang2Buffer,INDICATOR_DATA);
   ArraySetAsSeries(Yang2Buffer,true);
   SetIndexBuffer(9,Yang3Buffer,INDICATOR_DATA);
   ArraySetAsSeries(Yang3Buffer,true);
//--- add the buffer for copying data on prices for calculation
   SetIndexBuffer(10,Price,INDICATOR_CALCULATIONS);
//--- add the buffer for copying data on bar open time for construction
   SetIndexBuffer(11,Time,INDICATOR_CALCULATIONS);

//--- set what values are not to be drawn
   for(char x=0; x<8; x++)
     {
      PlotIndexSetDouble(x,PLOT_EMPTY_VALUE,-1);
     }
//--- set the indicator's look
   IndicatorSetString(INDICATOR_SHORTNAME,"BKCV "+IntegerToString(magic_numb)); // Indicator name
   IndicatorSetInteger(INDICATOR_DIGITS,_Digits); // Display accuracy
//--- assign names to graphical constructions
   PlotIndexSetString(0,PLOT_LABEL,"Yin");
   PlotIndexSetString(1,PLOT_LABEL,"Yin");
   PlotIndexSetString(2,PLOT_LABEL,"Yin");
   PlotIndexSetString(3,PLOT_LABEL,"Yin");
   PlotIndexSetString(4,PLOT_LABEL,"Yang");
   PlotIndexSetString(5,PLOT_LABEL,"Yang");
   PlotIndexSetString(6,PLOT_LABEL,"Yang");
   PlotIndexSetString(7,PLOT_LABEL,"Yang");
//--- prohibit display of the results of the current values for graphical constructions
   PlotIndexSetInteger(0,PLOT_SHOW_DATA,false);
   PlotIndexSetInteger(1,PLOT_SHOW_DATA,false);
   PlotIndexSetInteger(2,PLOT_SHOW_DATA,false);
   PlotIndexSetInteger(3,PLOT_SHOW_DATA,false);
   PlotIndexSetInteger(4,PLOT_SHOW_DATA,false);
   PlotIndexSetInteger(5,PLOT_SHOW_DATA,false);
   PlotIndexSetInteger(6,PLOT_SHOW_DATA,false);
   PlotIndexSetInteger(7,PLOT_SHOW_DATA,false);
//--- set color for Yin line
   PlotIndexSetInteger(0,PLOT_LINE_COLOR,color_yin);
   PlotIndexSetInteger(1,PLOT_LINE_COLOR,color_yin);
   PlotIndexSetInteger(2,PLOT_LINE_COLOR,color_yin);
   PlotIndexSetInteger(3,PLOT_LINE_COLOR,color_yin);
//--- set color for Yang line
   PlotIndexSetInteger(4,PLOT_LINE_COLOR,color_yang);
   PlotIndexSetInteger(5,PLOT_LINE_COLOR,color_yang);
   PlotIndexSetInteger(6,PLOT_LINE_COLOR,color_yang);
   PlotIndexSetInteger(7,PLOT_LINE_COLOR,color_yang);
//--- set Yin line width
   PlotIndexSetInteger(0,PLOT_LINE_WIDTH,width_yin);
   PlotIndexSetInteger(1,PLOT_LINE_WIDTH,width_yin);
   PlotIndexSetInteger(2,PLOT_LINE_WIDTH,width_yin);
   PlotIndexSetInteger(3,PLOT_LINE_WIDTH,width_yin);
//--- set Yang line width
   PlotIndexSetInteger(4,PLOT_LINE_WIDTH,width_yang);
   PlotIndexSetInteger(5,PLOT_LINE_WIDTH,width_yang);
   PlotIndexSetInteger(6,PLOT_LINE_WIDTH,width_yang);
   PlotIndexSetInteger(7,PLOT_LINE_WIDTH,width_yang);
//--- set the number of levels in the indicator window
   IndicatorSetInteger(INDICATOR_LEVELS,levels_number);
//---
   return(INIT_SUCCEEDED);
  }
3.3. 数据复制函数
现在我们来看数据复制函数。
这里有两个数据复制函数。第一个用来复制价格,第二个用来复制每个柱的开盘时间。两个函数都将其数值保存在之前声明的指标的计算缓冲区中。
首先,我们看价格复制函数。函数输入参数:用户保存数据的数组、数据复制起始时间(当前时间)。该函数体包含用于该函数的相应变量,复制到中间数组的数据量(柱),中间动态数组本身,以及应复制到中间数组的柱的数目。要根据既定时间内总的柱数以及在上一次调用函数时复制的柱数(全局变量)来计算柱的数目。
如果这不是第一次复制数据,则应更新上一次复制的柱上的数据。这时需要用以往复制的柱数减一,并用新复制的柱数加一。我们还要改变中间数组的大小,从而为复制柱做好准备。
根据设置,我们会将价格复制到中间数组。复制成功后,数据会从中间数组被复制到缓冲区数组(函数响应数组)的最后,对函数赋予正数答案并更新存有已复制柱数数据的全局变量。这类复制只允许复制减去复制时间后的几个柱。
//+------------------------------------------------------------------+
//| Func Copy History                                                |
//+------------------------------------------------------------------+
bool func_copy_history(double &result_array[],
                       datetime data_start,
                       datetime data_stop)
  {
//---
   int x=false; // Variable for answer

   int result_copy=-1; // Number of copied data

   static double price_interim[]; // Temporary dynamic array for storing copied data
   static int bars_to_copy;       // Number of bars for copying

   bars_to_copy=Bars(_Symbol,period,data_start,data_stop); // Find out the current number of bars on the time interval
   bars_to_copy-=bars_copied; // Calculate the number of bars to be copied

   if(bars_copied!=0) // If it is not the first time the data has been copied
     {
      bars_copied--;
      bars_to_copy++;
     }

   ArrayResize(price_interim,bars_to_copy); // Change the size of the receiving array

   switch(price_type)
     {
      case 0:
         result_copy=CopyClose(_Symbol,period,0,bars_to_copy,price_interim);
         break;
      case 1:
         result_copy=CopyOpen(_Symbol,period,0,bars_to_copy,price_interim);
         break;
      case 2:
         result_copy=CopyHigh(_Symbol,period,0,bars_to_copy,price_interim);
         break;
      case 3:
         result_copy=CopyLow(_Symbol,period,0,bars_to_copy,price_interim);
         break;
     }

   if(result_copy!=-1) // If copying to the intermediate array is successful
     {
      ArrayCopy(result_array,price_interim,bars_copied,0,WHOLE_ARRAY); // Copy the data from the temporary array to the main one
      x=true; // assign the positive answer to the function
      bars_copied+=result_copy; // Increase the value of the processed data
     }
//---
   return(x);
  }
下一个函数用来复制时间数据。与上一个函数不同,它用来处理另一种变量 - 日期时间(当复制到时间缓冲区数组 - 函数答案数组时,该变量会转换为双变量)。另一个不同之处就是这个函数没有使用 switch() 语句,因为它无需选择已经复制的数据。
//+------------------------------------------------------------------+
//| Func Copy Time                                                   |
//+------------------------------------------------------------------+
bool func_copy_time(double &result_array[],
                    datetime data_start,
                    datetime data_stop)
  {
//---
   int x=false; // Variable for answer
   int result_copy=-1; // Number of copied data

   static datetime time_interim[]; // Temporary dynamic array for storing copied data
   static int bars_to_copy_time; // Number of bars for copying

   bars_to_copy_time=Bars(_Symbol,period,data_start,data_stop); // Find out the current number of bars on the time interval
   bars_to_copy_time-=bars_copied_time; // Calculate the number of bars to be copied

   if(bars_copied_time!=0) // If it is not the first time the data has been copied
     {
      bars_copied_time--;
      bars_to_copy_time++;
     }
   ArrayResize(time_interim,bars_to_copy_time); // Change the size of the receiving array
   result_copy=CopyTime(_Symbol,period,0,bars_to_copy_time,time_interim);

   if(result_copy!=-1) // If copying to the intermediate array is successful
     {
      ArrayCopy(result_array,time_interim,bars_copied_time,0,WHOLE_ARRAY); // Copy the data from the temporary array to the main one
      x=true; // assign the positive answer to the function
      bars_copied_time+=result_copy; // Increase the value of the processed data
     }
//---
   return(x);
  }
3.4. 反转参数计算函数
由于反转参数可能是点数,也可能是百分比,因此我们需要函数能够根据指标设置计算反转参数。这个函数只有一个参数(价格)用于计算百分比反转参数。这个答案的变量会首先通过 double 型进行初始化,经过计算,它会被间接转化为 int 型以响应函数。
这样做是由于在计算中使用了浮点数,而答案应以整数形式呈现。函数中通过 if-else 条件语句实现了选择。直接与外部 input 变量(指标参数)进行比较。并用线性方程计算点数。首先,确定价格覆盖的总点数。然后,根据这一数字计算具体百分比,并用得到的百分比数据给返回变量赋值。
//+------------------------------------------------------------------+
//| Func Calculate Doorstep                                          |
//+------------------------------------------------------------------+
int func_calc_dorstep(double price)
  {
   double x=0; // Variable for answer
   if(type_doorstep==0) // If the calculation is to be performed in points
     {
      x=doorstep;
     }
   if(type_doorstep==1) // If the calculation is to be performed in percentage
     {
      x=price/_Point*doorstep/100;
     }
   return((int)x);
  }
3.5. 主函数 - 绘制 Kagi 图
我们已经检查了主函数运算所需的所有函数 - 在指标窗口中绘制 Kagi 图(即,填充指标缓冲区)。函数的输入参数由数据数组构成。其中两个为以上所说的计算缓冲区(之前赋值的价格与时间),其余都是指标作图缓冲区的数组。
函数中声明了作图时用于保存数据的必要变量。由于作图时使用 for 循环语句,我们需要获得上次计算结束阶段的数据。这可以通过六个变量获得:line_move - 上次计算时发生价格变动的位置,line_gauge - 阴阳线粗细(宽度),price_1 and price_2 - 正在考虑的以往价格与当前价格,price_down and price_up - 之前的肩价和腰价。 我们可以看到,由于在循环的最开始,尚未进行比较之前的计算中便已经包含了 price_1 变量,因此这个变量会被立即等同于已复制的价格数组的第一个元素。
由于指标作图的缓冲区数组拥有 AS_SERIES 索引标记,需要以相反顺序填写这些数组。因此要实现大小合适的时间数组。然后以同样方式转换用于保存时间数据、线条类型、肩与腰,以及反转价格的全局变量。
然后应以“空”值(-1)填写所有数组。使用两个小循环即可完成这一步。也可以在单个循环中加入所有数组。但使用两个循环会让每步动作更清晰,执行时间也不会发生多大变化。也就是说,分别单独填写图形缓冲区和计算时间缓冲区。
现在,已声明、转换并填写所有变量,可以开始启动主循环。主循环非常大(尽管计算速度足够快),且包括扫描之前复制的所有柱。
循环会通过已经复制的所有柱,并填写之前声称的所有必要数组,从而进一步与其合作。首先,我们来定义循环中使用的所有数组:
- yin_int_1 - 垂直阴线价格的第一个数值(如果绘制出垂直阴线,且图表走势向下,这就是价格的上限值;如果图表走势向上,这就是价格的下限值);
- yin_int_2 - 垂直阴线价格的第二个数值(如果线条走势向上,这就是上限值;如果线条走势向下,这就是下限值);
- yang_int_1 - 垂直阳线价格的第一个数值;
- yang_int_2 - 垂直阳线价格的第二个数值;
- lin_yin - 水平阴线值(阴线上的反转价格);
- lin_yang - 水平阳线值(阳线上的反转价格);
- time_change - 图表反转时间(形成肩或腰);
- time_line - 阴 = 0 或阳 = 1 反转期间的线条;
- time_central_price - 中心价格的数值,中心价格即阴线转换为阳线或阳线转换为阴线时的价格;
- time_change_price - 反转(肩或腰)价格数值,这是一个公用变量,不随阴阳线的类型发生变化。
在每次循环开始前用当前分析的来自价格缓冲区的价格数值给 price_2 变量赋值,从而在 if-else 条件语句中做出进一步对比。之后,将逐步分析已经复制的数据的缓冲区数组,并填写上述数组。每个 if-else 条件语句都会根据条件执行某些操作,这些条件包括:图表线条之前的方向(上或下)以及线条之前的形式(阴或阳)。然后根据作图类型(标准或修订)检查移动条件(价格是否通过了某个数目的点)。
满足各项条件后,会重新给变量赋值或确定变量(数组元素)。最开始便确定了线条类型(阴还是阳)。根据移动和之前的操作来进行下一步分布。
存在两种可能的价格变动;
- 价格上升;
- 价格下降。
每个方向还包含四类之前的操作:
- 上一条线是阴线,趋势向上;
- 上一条线是阳线,趋势向上;
- 上一条线是阴线,趋势向下;
- 上一条线是阳线,趋势向下;
这样,在图表最初运动(出现第一条线)的前两个定义中,我们便分为八种情况。
之后,主循环结束。要在较小的循环中建立图表需要为缓冲区重新赋值(反转)并进行填充,这个较小的循环包括之前在主循环中定义,并被写入 “a” 变量的 Kagi 图的反转次数。至于分布最高价和最低价数值以及垂直线,则非常简单:执行一次简单的反转。也就是说,之前获得的主要数值(拥有 0、1、2、3...指数的数组)已被分配到缓冲区的最终值(将具有 “a” 索引(即 a、a-1、a-2、a-3...)的元素用作最终数值)。为防止反转(水平)线相互纠缠在一起,按上文所述用 switch 语句进行旋转。
这样,便完成了 Kagi 作图的主函数。
//+------------------------------------------------------------------+
//| Func Draw Kagi                                                   |
//+------------------------------------------------------------------+
void func_draw_kagi(double &array_input[],
                    double &arr_yin_1[],
                    double &arr_yin_2[],
                    double &arr_yin_lin1[],
                    double &arr_yin_lin2[],
                    double &arr_yin_lin3[],
                    double &arr_yang_1[],
                    double &arr_yang_2[],
                    double &arr_yang_lin1[],
                    double &arr_yang_lin2[],
                    double &arr_yang_lin3[],
                    double &arr_time[])
  {
//---
   a=0; // Variable for the chart construction fixing the number of chart reversals
   char line_move=0; // Previous price direction 1-up, -1-down
   char line_gauge=0; // Previous look of the line 1-thick yang, -1-thin yin
   double price_1=0,price_2=0; // Auxiliary variables for defining the price movement
   double price_down=-99999,price_up=99999; // Auxiliary variables for storing the reversal price values
   price_1=array_input[0];
//--- auxiliary arrays for the initial data storing before the reversal (transferring to the buffers)
   double yin_int_1[];
   double yin_int_2[];
   double lin_yin[];
   double yang_int_1[];
   double yang_int_2[];
   double lin_yang[];
//--- change the sizes of dynamic arrays
   ArrayResize(yin_int_1,bars_copied);
   ArrayResize(yin_int_2,bars_copied);
   ArrayResize(yang_int_1,bars_copied);
   ArrayResize(yang_int_2,bars_copied);
   ArrayResize(lin_yin,bars_copied);
   ArrayResize(lin_yang,bars_copied);
//--- time data storing arrays
   ArrayResize(time_change,bars_copied_time);
   ArrayResize(time_line,bars_copied_time); // Look of the line Yin = 0 or Yang = 1
   ArrayResize(time_change_price,bars_copied_time);
   ArrayResize(time_central_price,bars_copied_time);
//--- assign -1 (not displayed) value to the transferred buffers
   for(int z=0; z<bars_copied; z++)
     {
      arr_yin_1[z]=-1;
      arr_yin_2[z]=-1;
      arr_yin_lin1[z]=-1;
      arr_yin_lin2[z]=-1;
      arr_yin_lin3[z]=-1;
      arr_yang_1[z]=-1;
      arr_yang_2[z]=-1;
      arr_yang_lin1[z]=-1;
      arr_yang_lin2[z]=-1;
      arr_yang_lin3[z]=-1;
     }
//--- equate -1 (not displayed) value to the arrays
   for(int z=0; z<bars_copied; z++)
     {
      yin_int_1[z]=-1;
      yin_int_2[z]=-1;
      lin_yin[z]=-1;
      yang_int_1[z]=-1;
      yang_int_2[z]=-1;
      lin_yang[z]=-1;
      time_change[z]=-1;
      time_line[z]=-1;
      time_change_price[z]=-1;
      time_central_price[z]=-1;
     }
//--- function's main loop
   for(int z=0; z<bars_copied; z++)
     {
      price_2=array_input[z];
      //--- first, let's define the initial market direction
      //--- first THIN DESCENDING line
      if(((price_1-price_2)/_Point>func_calc_dorstep(price_2)) && line_move==0)
        {
         yin_int_1[a]=price_1;
         yin_int_2[a]=price_2;

         line_move=-1;
         line_gauge=-1;

         price_1=price_2;

         time_change[a]=(datetime)arr_time[z];
         time_line[a]=0;
        }
      //--- first THICK ASCENDING line
      if(((price_1-price_2)/_Point<-func_calc_dorstep(price_2)) && line_move==0)
        {
         yang_int_1[a]=price_1;
         yang_int_2[a]=price_2;

         line_move=1;
         line_gauge=1;

         price_1=price_2;

         time_change[a]=(datetime)arr_time[z];
         time_line[a]=1;
        }
      //--- price moves DOWN
      //--- if the price moved DOWN before that, the line is THIN
      if(line_move==-1 && line_gauge==-1)
        {
         if(((price_1-price_2)/_Point>func_calc_dorstep(price_2)) || (kagi_type==0 && (price_1-price_2)/_Point>0))
           {
            yin_int_2[a]=price_2;

            line_move=-1;
            line_gauge=-1;

            price_1=price_2;

            time_change[a]=(datetime)arr_time[z];
            time_line[a]=0;
           }
        }
      //--- if the price moved DOWN before that, the line is THICK
      if(line_move==-1 && line_gauge==1)
        {
         if(((price_1-price_2)/_Point>func_calc_dorstep(price_2)) || (kagi_type==0 && (price_1-price_2)/_Point>0))
           {
            if(price_2<price_down) // If the thick line crossed the lower shoulder when moving downwards
              {
               yin_int_1[a]=price_down;
               yin_int_2[a]=price_2;

               yang_int_2[a]=price_down;

               line_move=-1;
               line_gauge=-1;

               price_1=price_2;

               time_change[a]=(datetime)arr_time[z];
               time_central_price[a]=price_down;
               time_line[a]=0;
              }
            else //if(price_2>=price_down) // If the thick line has not crossed the lower shoulder when moving downwards
              {
               yang_int_2[a]=price_2;

               line_move=-1;
               line_gauge=1;

               price_1=price_2;

               time_change[a]=(datetime)arr_time[z];
               time_line[a]=1;
              }
           }
        }
      //--- if the price has moved UPWARDS before that, the line is THIN
      if(line_move==1 && line_gauge==-1)
        {
         if((price_1-price_2)/_Point>func_calc_dorstep(price_2))
           {
            a++;
            yin_int_1[a]=price_1;
            yin_int_2[a]=price_2;

            lin_yin[a]=price_1;

            line_move=-1;
            line_gauge=-1;

            price_up=price_1;

            price_1=price_2;

            time_change[a]=(datetime)arr_time[z];
            time_line[a]=0;
            time_change_price[a]=lin_yin[a];
           }
        }
      //--- if the price has moved UPWARDS before that, the line is THICK
      if(line_move==1 && line_gauge==1)
        {
         if((price_1-price_2)/_Point>func_calc_dorstep(price_2))
           {
            a++;
            if(price_2<price_down) // If the thick line has crossed the lower shoulder when moving downwards
              {
               yin_int_1[a]=price_down;
               yin_int_2[a]=price_2;

               yang_int_1[a]=price_1;
               yang_int_2[a]=price_down;

               lin_yang[a]=price_1;

               line_move=-1;
               line_gauge=-1;

               price_up=price_1;

               price_1=price_2;

               time_change[a]=(datetime)arr_time[z];
               time_line[a]=0;
               time_change_price[a]=lin_yang[a];
               time_central_price[a]=price_down;
              }
            else//if(price_2>=price_down) // If the thick line has not crossed the lower shoulder when moving downwards
              {
               yang_int_1[a]=price_1;
               yang_int_2[a]=price_2;

               lin_yang[a]=price_1;

               line_move=-1;
               line_gauge=1;

               price_up=price_1;

               price_1=price_2;

               time_change[a]=(datetime)arr_time[z];
               time_line[a]=1;
               time_change_price[a]=lin_yang[a];
              }
           }
        }
      //--- the price moves UP
      //--- if the price has moved UPWARDS before that, the line is THICK
      if(line_move==1 && line_gauge==1)
        {
         if(((price_1-price_2)/_Point<-func_calc_dorstep(price_2)) || (kagi_type==0 && (price_1-price_2)/_Point<0))
           {
            yang_int_2[a]=price_2;

            line_move=1;
            line_gauge=1;

            price_1=price_2;

            time_change[a]=(datetime)arr_time[z];
            time_line[a]=1;
           }
        }

      //--- if the price has moved UPWARDS before that, the line is THIN
      if(line_move==1 && line_gauge==-1)
        {
         if(((price_1-price_2)/_Point<-func_calc_dorstep(price_2)) || (kagi_type==0 && (price_1-price_2)/_Point<0))
           {
            if(price_2>price_up) // If the thin line has not crossed the upper shoulder when moving upwards
              {
               yin_int_2[a]=price_up;

               yang_int_1[a]=price_up;
               yang_int_2[a]=price_2;

               line_move=1;
               line_gauge=1;

               price_1=price_2;

               time_change[a]=(datetime)arr_time[z];
               time_central_price[a]=price_up;
               time_line[a]=1;
              }
            else//if(price_2<=price_up) // If the thin line has not crossed the upper shoulder when moving upwards
              {
               yin_int_2[a]=price_2;

               line_move=1;
               line_gauge=-1;

               price_1=price_2;

               time_change[a]=(datetime)arr_time[z];
               time_line[a]=0;
              }
           }
        }

      //--- if the price has moved DOWNWARDS before that, the line is THICK
      if(line_move==-1 && line_gauge==1)
        {
         if((price_1-price_2)/_Point<-func_calc_dorstep(price_2))
           {
            a++;

            yang_int_1[a]=price_1;
            yang_int_2[a]=price_2;

            lin_yang[a]=price_1;

            line_move=1;
            line_gauge=1;

            price_down=price_1;
            price_1=price_2;

            time_change[a]=(datetime)arr_time[z];
            time_line[a]=1;
            time_change_price[a]=lin_yang[a];
           }
        }

      //--- if the price has moved DOWNWARDS before that, the line is THIN
      if(line_move==-1 && line_gauge==-1)
        {
         if((price_1-price_2)/_Point<-func_calc_dorstep(price_2))
           {
            a++;
            if(price_2>price_up) // If the thin line has crossed the upper shoulder when moving upwards
              {
               yin_int_1[a]=price_1;
               yin_int_2[a]=price_up;

               yang_int_1[a]=price_up;
               yang_int_2[a]=price_2;

               lin_yin[a]=price_1;

               line_move=1;
               line_gauge=1;

               price_down=price_1;
               price_1=price_2;

               time_change[a]=(datetime)arr_time[z];
               time_line[a]=1;
               time_change_price[a]=lin_yin[a];
               time_central_price[a]=price_up;
              }
            else //if(price_2<=price_up) // If the thin line has not crossed the upper shoulder when moving upwards
              {
               yin_int_1[a]=price_1;
               yin_int_2[a]=price_2;

               lin_yin[a]=price_1;

               line_move=1;
               line_gauge=-1;

               price_down=price_1;
               price_1=price_2;

               time_change[a]=(datetime)arr_time[z];
               time_line[a]=0;
               time_change_price[a]=lin_yin[a];
              }
           }
        }

     }
//--- function's main loop
//--- assign actual values to drawing buffers
   uint y=a;
//--- auxiliary variables for storing data on filling the current buffer
   char yin=1;
   char yang=1;
   for(uint z=0; z<=a; z++)
     {
      arr_yin_1[z]=yin_int_1[y];
      arr_yin_2[z]=yin_int_2[y];

      switch(yin)
        {
         case 1:
           {
            arr_yin_lin1[z]=lin_yin[y];
            arr_yin_lin1[z+1]=lin_yin[y];
            yin++;
           }
         break;
         case 2:
           {
            arr_yin_lin2[z]=lin_yin[y];
            arr_yin_lin2[z+1]=lin_yin[y];
            yin++;
           }
         break;
         case 3:
           {
            arr_yin_lin3[z]=lin_yin[y];
            arr_yin_lin3[z+1]=lin_yin[y];
            yin=1;
           }
         break;
        }

      arr_yang_1[z]=yang_int_1[y];
      arr_yang_2[z]=yang_int_2[y];

      switch(yang)
        {
         case 1:
           {
            arr_yang_lin1[z]=lin_yang[y];
            arr_yang_lin1[z+1]=lin_yang[y];
            yang++;
           }
         break;
         case 2:
           {
            arr_yang_lin2[z]=lin_yang[y];
            arr_yang_lin2[z+1]=lin_yang[y];
            yang++;
           }
         break;
         case 3:
           {
            arr_yang_lin3[z]=lin_yang[y];
            arr_yang_lin3[z+1]=lin_yang[y];
            yang=1;
           }
         break;
        }
      y--;
     }
//---
  }
3.6. 用于创建“走势线”图形对象的函数
下面我们来看用来创建“走势线”图形对象的函数。我们在主图上绘制 Kagi 时需要这个函数。
这个函数非常简单。它包含创建 “走势线” 图形对象的必要输入参数:对象名称、第一和第二个价格与时间点,以及线条宽度和颜色。这个函数体包含图形对象创建函数以及用于更改图形对象属性的六个函数。
//+------------------------------------------------------------------+
//| Func Object Create Trend Line                                    |
//+------------------------------------------------------------------+
void func_create_trend_line(string name,
                            double price1,
                            double price2,
                            datetime time1,
                            datetime time2,
                            int width,
                            color color_line)
  {
   ObjectCreate(0,name,OBJ_TREND,0,time1,price1,time2,price2);
//--- set the line color
   ObjectSetInteger(0,name,OBJPROP_COLOR,color_line);
//--- set the line display style
   ObjectSetInteger(0,name,OBJPROP_STYLE,STYLE_SOLID);
//--- set the line width
   ObjectSetInteger(0,name,OBJPROP_WIDTH,width);
//--- display in the foreground (false) or background (true)
   ObjectSetInteger(0,name,OBJPROP_BACK,false);
//--- enable (true) or disable (false) the mode of continuing the line display to the left
   ObjectSetInteger(0,name,OBJPROP_RAY_LEFT,false);
//--- enable (true) or disable (false) the mode of continuing the line display to the right
   ObjectSetInteger(0,name,OBJPROP_RAY_RIGHT,false);
  }
3.7. 在主图上绘制 Kagi
多次适用于上一函数的下一个函数就是在主图上进行 Kagi 作图的函数。填入之前说过的 Kagi 作图主函数中的全局变量被用作输入变量:反转价格数组(“肩”与“腰”),变更与中心价格(阴阳线相互转化时的价格)数组,反转时间数组(实时定位,用[z-1]数组索引标记反转起点),反转发生时的线条类别数组(和时间数组一样是一个正向元素)。
这个函数体由一个循环组成。循环分为两个部分:绘制垂直和水平线条。其中绘制垂直线条也分为两部分:考虑改变线条(更改中心价格)和不改变线条两种情况绘制垂直线。注意“走势线”对象创建函数的转移参数。
重复命名。对象名称从一个幻数开始(需要用来删除某个指标的对象),然后确定其类型,最后分配索引。该循环每次计算时更新该索引。
//+------------------------------------------------------------------+ //| Func Kagi Main Chart | //+------------------------------------------------------------------+ void func_kagi_main_chart(double &price[], // Shoulder prices array double ¢ral_price[], // Array of the prices of passing through the shoulders datetime &time[], // Current location time array ([-1] - start of shoulder) char &type_line_end[]) // Line type by the start of shoulder formation { //--- start of the loop for(uint z=1; z<=a; z++) { //--- check for the pass conditions (no pass) if(central_price[z]==-1) { if(type_line_end[z-1]==0 && price[z+1]!=-1) { func_create_trend_line(IntegerToString(magic_numb)+"_trend_yin_v"+IntegerToString(z), price[z],price[z+1],time[z],time[z],width_yin_main,color_yin_main); } if(type_line_end[z-1]==1 && price[z+1]!=-1) { func_create_trend_line(IntegerToString(magic_numb)+"_trend_yang_v"+IntegerToString(z), price[z],price[z+1],time[z],time[z],width_yang_main,color_yang_main); } } else //--- check for the pass conditions (pass is present) { if(type_line_end[z-1]==0 && price[z+1]!=-1) { func_create_trend_line(IntegerToString(magic_numb)+"_trend_yin_v"+IntegerToString(z), central_price[z],price[z],time[z],time[z],width_yin_main,color_yin_main); func_create_trend_line(IntegerToString(magic_numb)+"_trend_yang_v"+IntegerToString(z), central_price[z],price[z+1],time[z],time[z],width_yang_main,color_yang_main); } if(type_line_end[z-1]==1 && price[z+1]!=-1) { func_create_trend_line(IntegerToString(magic_numb)+"_trend_yin_v"+IntegerToString(z), central_price[z],price[z+1],time[z],time[z],width_yin_main,color_yin_main); func_create_trend_line(IntegerToString(magic_numb)+"_trend_yang_v"+IntegerToString(z), central_price[z],price[z],time[z],time[z],width_yang_main,color_yang_main); } } //--- check for the pass conditions (pass is present) //--- draw the horizontals if(type_line_end[z-1]==0) { func_create_trend_line(IntegerToString(magic_numb)+"_trend_h"+IntegerToString(z), price[z],price[z],time[z-1],time[z],width_yin_main,color_yin_main); } if(type_line_end[z-1]==1) { func_create_trend_line(IntegerToString(magic_numb)+"_trend_h"+IntegerToString(z), price[z],price[z],time[z-1],time[z],width_yang_main,color_yang_main); } //--- draw the horizontals } }
3.8. 实现其它标签
正如我在前面所说的,该指标可实现其它标签。下面我们来看在主图上提供这些标签的函数。这里只有两类标签:通过“价格标签” 和 “垂直标签” 显示反转价格和反转时间标签。作为输入参数来传递以下参数:反转价格标签图和标签颜色属性,反转时间标签图和标签颜色变化属性,反转时间的第一和第二种颜色。
整个函数分为两个部分:第一部分负责时间标签,第二部分负责价格标签。函数的两个部分均由多个循环组成,这些循环受到图表反转数目(“a”变量)的限制。循环前设置了 if-else 条件语句。这个语句会根据指标设置检查制图的必要性。
第一个循环可创建时间标签,循环最开始即执行了对象名称定义(上文介绍了名称的生成原则)。然后,根据全局声明的线条类型数组(如果设定了该参数)中的线条来选择颜色,并在线条中应用其它参数。
第二个循环负责创建反转价格标签。首先生成了对象名称。然后,根据是否要在主图上构建 Kagi 来设置时间数组索引选项,否则,这些标签会被置于“空中”,反转发生的位置不够清晰。之后会创建并配置 “价格标签” 类对象。
//+------------------------------------------------------------------+
//| Func Label Main Chart                                            |
//+------------------------------------------------------------------+
void func_label_main_chart(bool label_print,
                           color label_color,
                           bool time_change_print,
                           bool time_change_color,
                           color time_color_first,
                           color time_color_second)
  {
   if(time_change_print==true)
     {
      for(uint z=1; z<=a; z++)
        {
         string name=IntegerToString(magic_numb)+"_time_2_"+IntegerToString(z);
         //--- create an object of a vertical line type
         ObjectCreate(0,name,OBJ_VLINE,0,time_change[z],0);
         //--- set the line color
         color color_line=clrBlack;
         if(time_change_color==true)
           {
            if(time_line[z]==0)color_line=time_color_first;
            if(time_line[z]==1)color_line=time_color_second;
           }
         else color_line=time_color_first;
         ObjectSetInteger(0,name,OBJPROP_COLOR,color_line);
         //--- set the line display style
         ObjectSetInteger(0,name,OBJPROP_STYLE,STYLE_SOLID);
         //--- set the line width
         ObjectSetInteger(0,name,OBJPROP_WIDTH,1);
         //--- display on the foreground (false) or background (true)
         ObjectSetInteger(0,name,OBJPROP_BACK,false);
         //--- enable (true) or disable (false) the line display mode in the chart subwindows
         ObjectSetInteger(0,name,OBJPROP_RAY,time_separate_windows);
        }
     }
   if(label_print==true)
     {
      for(uint z=1; z<=a; z++)
        {
         string name=IntegerToString(magic_numb)+"_label_2_"+IntegerToString(z);
         uint numb_time;
         if(kagi_main_chart==true)numb_time=z;
         else numb_time=z-1;
         //--- create a label type object
         ObjectCreate(0,name,OBJ_ARROW_RIGHT_PRICE,0,time_change[numb_time],time_change_price[z]);
         //--- set the label color
         ObjectSetInteger(0,name,OBJPROP_COLOR,label_color);
         //--- set the edging line style
         ObjectSetInteger(0,name,OBJPROP_STYLE,STYLE_SOLID);
         //--- set the label size
         ObjectSetInteger(0,name,OBJPROP_WIDTH,1);
         //--- display on the foreground (false) or background (true)
         ObjectSetInteger(0,name,OBJPROP_BACK,false);
        }
     }
  }
下面我们看如何在指标窗口中设置标签。
指标窗口中的大部分标签都是价格标签,它们只分为两类:反转价格标签和价格水平。价格水平的绘制分为两种:位于图表反转处的价格水平,以及在整个图表价格范围内以相同距离均匀绘制的价格水平。第一种能够以两种方式改变价格水平的颜色:根据线型(阴或阳),以及根据反转(向上或向下)。
这样,函数本身便分为两个循环:第一个负责创建反转价格标签,第二个用于指定价格水平。第二个循环又分为两类:位于每一反转处的标签,或以等距分布在整个价格范围内的标签。
这个函数与之前的函数不同,它限制价格标签和价格水平的数目,因为如果数目过多,会使图表超载,从而难以理解。
由于具备这一特性,两个循环都受在指标设置(价格标签和价格水平数目)中指定的计算次数的限制(价格标签和价格水平数目)。这种方法非常危险,因为反转的次数也许会大大小于在设置中设定的价格标签的数目。因此,每次循环期间都会检查是否存在反转以绘制价格标签或价格水平。
唯一例外的就是沿着整个价格范围以等距绘制价格水平。在坐标中以相反顺序生成 “价格标签” 类图形对象,即先放置当前日期的标签,然后再放置以往日期的标签。这同样适用于价格水平:先生成当前价格水平,然后生成之前的价格水平。当价格水平不依赖于图表反转时例外。
用 if-else 条件语句根据设置来改变价格水平的颜色。
//+------------------------------------------------------------------+
//| Func Label Indicator Window                                      |
//+------------------------------------------------------------------+
void func_label_indicator_window(bool label_print,         // Draw price labels
                                 bool levels_print,        // Draw levels
                                 char levels_type_draw,    // Type of drawing the levels by reversals or at an equal distance of the entire price range
                                 char levels_color_change) // Change line color
  {
   uint number=a;
   if(label_print==true)
     {
      for(uint z=0; z<=label_1_number; z++)
        {
         if(z<number)
           {
            string name=IntegerToString(magic_numb)+"_label_1_"+IntegerToString(z);
            //--- create label type object
            ObjectCreate(0,name,OBJ_ARROW_RIGHT_PRICE,ChartWindowFind(),(datetime)Time[(bars_copied_time-z-2)],time_change_price[number-z]);
            //--- set the label color
            ObjectSetInteger(0,name,OBJPROP_COLOR,label_1_color);
            //--- set the style of the edging line
            ObjectSetInteger(0,name,OBJPROP_STYLE,STYLE_SOLID);
            //--- set the label size
            ObjectSetInteger(0,name,OBJPROP_WIDTH,1);
            //--- display on the foreground (false) or background (true)
            ObjectSetInteger(0,name,OBJPROP_BACK,false);
           }
        }
     }
   if(levels_print==true)
     {
      if(levels_type_draw==0)
        {
         for(uint z=0; z<=levels_number; z++)
           {
            if(z<number)
              {
               IndicatorSetDouble(INDICATOR_LEVELVALUE,z,time_change_price[number-z]);
               if(levels_change_color==0)
                 {
                  double numb_even=z;
                  if(MathMod(numb_even,2)==0)
                    {
                     IndicatorSetInteger(INDICATOR_LEVELCOLOR,z,levels_first_color);
                    }
                  if(MathMod(numb_even,2)!=0)
                    {
                     IndicatorSetInteger(INDICATOR_LEVELCOLOR,z,levels_second_color);
                    }
                 }
               if(levels_change_color==1)
                 {
                  if(time_line[number-z]==0)IndicatorSetInteger(INDICATOR_LEVELCOLOR,z,levels_first_color);
                  if(time_line[number-z]==1)IndicatorSetInteger(INDICATOR_LEVELCOLOR,z,levels_second_color);
                 }
               if(levels_change_color==2)
                 {
                  IndicatorSetInteger(INDICATOR_LEVELCOLOR,z,levels_first_color);
                 }
              }
           }
        }
      if(levels_type_draw==1)
        {
         double max_price=Price[ArrayMaximum(Price)];
         double min_price=Price[ArrayMinimum(Price,1,ArrayMinimum(Price)-1)];
         double number_difference=(max_price-min_price)/levels_number;
         NormalizeDouble(number_difference,_Digits);
         for(uint z=0; z<=levels_number; z++)
           {
            IndicatorSetDouble(INDICATOR_LEVELVALUE,z,(min_price+(z*number_difference)));
            IndicatorSetInteger(INDICATOR_LEVELCOLOR,z,levels_first_color);
           }
        }
     }
  }
3.9. 删除之前创建的图形对象
我们知道,指标中包含大量的图形对象。现在要考虑如何快速高效地删除这些对象。
这项工作由用于删除图形对象的函数来完成。将对象的初始名称和数字用作函数参数。和创建过程中一样,对象名称应包含幻数以及对象种类的名称。程序中的函数调用受超出其可能存在的对象数目的限制。但是这并不影响指标的功能。
//+------------------------------------------------------------------+
//| Func Delete Objects                                              |
//+------------------------------------------------------------------+
void func_delete_objects(string name,
                         int number)
  {
   string name_del;
   for(int x=0; x<=number; x++)
     {
      name_del=name+IntegerToString(x);
      ObjectDelete(0,name_del);
     }
  }
3.10. 用于开始作图的函数
现在,我们已经学习了用于 Kagi 图的计算和作图以及创建和删除对象的所有函数,下面我们要了解另一个小函数,这个小函数用于检查新柱形的出现。这个函数非常简单,只有一个输入参数,即分析周期。这个函数的答案也非常简单。它拥有 bool 类并包含关于是否显示新柱形的答案。这个函数体的基础是 switch 语句,这个语句会根据周期的变化将控制权传递至不同的语句。
比如,这个函数覆盖了整个周期范围,尽管只能够还使用一个周期。
这个函数的算法来自 IsNewBar 代码:比较上一个柱形的开始时间与之前定义的时间数值。如果数值不同,则表示出现了新柱形。按之前定义的方式分配新数值,且认为函数的响应为正。如果最后一个柱的开始时间与之前确定的时间数值相符,则新柱尚未出现,函数的响应为负。
//+------------------------------------------------------------------+
//| Func New Bar                                                     |
//+------------------------------------------------------------------+
bool func_new_bar(ENUM_TIMEFRAMES period_time)
  {
//----
   static datetime old_Times[22];// array for storing old values
   bool res=false;               // analysis result variable
   int  i=0;                     // old_Times[] array cell index
   datetime new_Time[1];         // new bar time

   switch(period_time)
     {
      case PERIOD_M1:  i= 0; break;
      case PERIOD_M2:  i= 1; break;
      case PERIOD_M3:  i= 2; break;
      case PERIOD_M4:  i= 3; break;
      case PERIOD_M5:  i= 4; break;
      case PERIOD_M6:  i= 5; break;
      case PERIOD_M10: i= 6; break;
      case PERIOD_M12: i= 7; break;
      case PERIOD_M15: i= 8; break;
      case PERIOD_M20: i= 9; break;
      case PERIOD_M30: i=10; break;
      case PERIOD_H1:  i=11; break;
      case PERIOD_H2:  i=12; break;
      case PERIOD_H3:  i=13; break;
      case PERIOD_H4:  i=14; break;
      case PERIOD_H6:  i=15; break;
      case PERIOD_H8:  i=16; break;
      case PERIOD_H12: i=17; break;
      case PERIOD_D1:  i=18; break;
      case PERIOD_W1:  i=19; break;
      case PERIOD_MN1: i=20; break;
      case PERIOD_CURRENT: i=21; break;
     }
   // copy the time of the last bar to new_Time[0] cell
   int copied=CopyTime(_Symbol,period_time,0,1,new_Time);

   if(copied>0) // all is well. Data has been copied
      {
      if(old_Times[i]!=new_Time[0])       // if the bar's old time is not equal to new one
         {
         if(old_Times[i]!=0) res=true;    // if it is not the first launch, true = new bar
         old_Times[i]=new_Time[0];        // store the bar's time
         }
      }
//----
   return(res);
  }
3.11. OnCalculate() 与 OnChartEvent() 函数
上述所有函数都会被合并到具有相同名称(Func Consolidation)的函数中。每次 OnCalculate() 函数中出现新柱时以及在 OnChartEvent() 函数中按下 “R” 键时便会启动这个函数。
生成或更新图表前,该合并函数(Func Consolidation)中调用了用于删除所有图形对象的函数。由于存在大量对象,且这些对象被分为主图以及指标窗口的价格标签,指示反转时间的垂直线,以及阴阳垂直和水平走势线,因此总共需调用 7 次函数。
然后,根据价格和时间来复制历史数据。随后便启动了用于建立 Kagi 图的主函数。然后调用用于将所有价格标签放在主图上的函数以及指标窗口。最后,在主图上生成 Kagi,并启动用于重新绘制对象的函数。
//+------------------------------------------------------------------+
//| Func Consolidation                                               |
//+------------------------------------------------------------------+
void func_consolidation()
  {
//--- date of construction end
   stop_data=TimeCurrent();

//--- deleting all graphical objects belonging to the indicator
   func_delete_objects(IntegerToString(magic_numb)+"_label_2_",ObjectsTotal(0,-1,-1));
   func_delete_objects(IntegerToString(magic_numb)+"_label_1_",ObjectsTotal(0,-1,-1));
   func_delete_objects(IntegerToString(magic_numb)+"_time_2_",ObjectsTotal(0,-1,-1));
   func_delete_objects(IntegerToString(magic_numb)+"_trend_yin_v",ObjectsTotal(0,-1,-1));
   func_delete_objects(IntegerToString(magic_numb)+"_trend_yang_v",ObjectsTotal(0,-1,-1));
   func_delete_objects(IntegerToString(magic_numb)+"_trend_h",ObjectsTotal(0,-1,-1));
   func_delete_objects(IntegerToString(magic_numb)+"_trend_h",ObjectsTotal(0,-1,-1));

//--- copy price data to the main buffer
   copy_history=func_copy_history(Price,start_data,stop_data);

//--- display information about the error when copying price data
   if(copy_history==false)Alert("Error of copy history Price");

//--- copy time data to the main buffer
   copy_time=func_copy_time(Time,start_data,stop_data);

//--- display a notification of the error occurred while copying time data
   if(copy_time==false)Alert("Error of copy history Time");

//--- construct Kagi chart in the indicator window
   func_draw_kagi(Price,YinBuffer1,YinBuffer2,Yin1Buffer,Yin2Buffer,Yin3Buffer,
                  YangBuffer1,YangBuffer2,Yang1Buffer,Yang2Buffer,Yang3Buffer,Time);

//--- draw labels on the main chart
   func_label_main_chart(label_2,label_2_color,time_line_draw,time_line_change_color,time_first_color,time_second_color);

//--- draw labels on the indicator chart
   func_label_indicator_window(label_1,levels_on_off,levels_type,levels_change_color);

//--- construct Kagi chart in the main window
   if(kagi_main_chart==true)func_kagi_main_chart(time_change_price,time_central_price,time_change,time_line);

//--- redraw the chart
   ChartRedraw(0);
//---
  }
//+------------------------------------------------------------------+
//| Custom indicator iteration function                              |
//+------------------------------------------------------------------+
int OnCalculate(const int rates_total,
                const int prev_calculated,
                const int begin,
                const double &price[])
  {
//---
   if(func_new_bar(period_to_redraw)==true)
     {
      func_consolidation();
     }
//--- return value of prev_calculated for next call
   return(rates_total);
  }
//+------------------------------------------------------------------+
//| OnChartEvent                                                     |
//+------------------------------------------------------------------+
void OnChartEvent(const int id,         // event ID
                  const long& lparam,   // long type event parameter
                  const double& dparam, // double type event parameter
                  const string& sparam) // string type event parameter
  {
   if(id==CHARTEVENT_KEYDOWN) // Keyboard button pressing event
     {
      if(lparam==82) // "R" key has been pressed
        {
         func_consolidation();
        }
     }
  }
3.12. OnDeinit() 函数
在指标去初始化函数中删除所有对象。
//+------------------------------------------------------------------+
//| OnDeinit                                                         |
//+------------------------------------------------------------------+
void OnDeinit(const int reason)
  {
//--- delete all graphical objects belonging to the indicator
   func_delete_objects(IntegerToString(magic_numb)+"_label_2_",ObjectsTotal(0,-1,-1));
   func_delete_objects(IntegerToString(magic_numb)+"_label_1_",ObjectsTotal(0,-1,-1));
   func_delete_objects(IntegerToString(magic_numb)+"_time_2_",ObjectsTotal(0,-1,-1));
   func_delete_objects(IntegerToString(magic_numb)+"_trend_yin_v",ObjectsTotal(0,-1,-1));
   func_delete_objects(IntegerToString(magic_numb)+"_trend_yang_v",ObjectsTotal(0,-1,-1));
   func_delete_objects(IntegerToString(magic_numb)+"_trend_h",ObjectsTotal(0,-1,-1));
   func_delete_objects(IntegerToString(magic_numb)+"_trend_h",ObjectsTotal(0,-1,-1));
//--- redraw the chart
   ChartRedraw(0);
  }
下面我们看看如何在实践中使用该指标。
4. 在实践中使用 Kagi 图
很多交易策略都是以 Kagi 图为基础。我们来学习其中部分策略。
我们从最流行的策略开始:在阳线转为阴线时卖出,阴线转为阳线时买入。图 4 中显示的是这种情况:
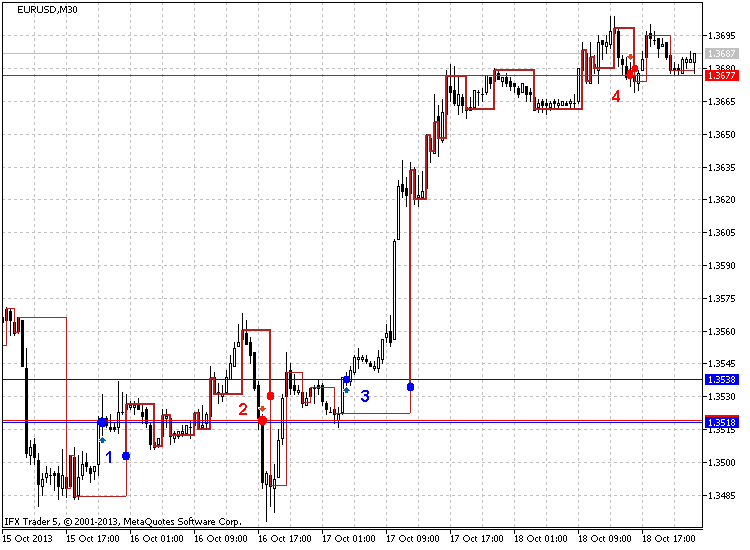
图 4 在阳线转为阴线时卖出,阴线转为阳线时买入
如图 4 所示(EURUSD M30, 5 点),这个策略的效果很好。图中显示了 4 个信号的 8 个点,第一(1)个显示长期仓位以 1.3518 开盘,这似乎是正确的,因为价格后来达到大约 1.3560,一天覆盖了 42 个点。这个结果很好。
下一点(2)建议以 1.3519 的价格卖出。我们可以看到,价格确实下降低于 1.3485(覆盖 34 个点)达近 2 个小时。
下面我们看第(3)点。长期仓位以 1.3538 开盘,且价格走高,达到 1.3695。这样,一天半的利润就覆盖了 157 点。当然,这些都是可能出现的最高利润,但真实结果同样够好。
下一个交易策略就是从图 5(EURUSD M30, 5 点),10 月 7-18 日中显示的走势线开始下降。
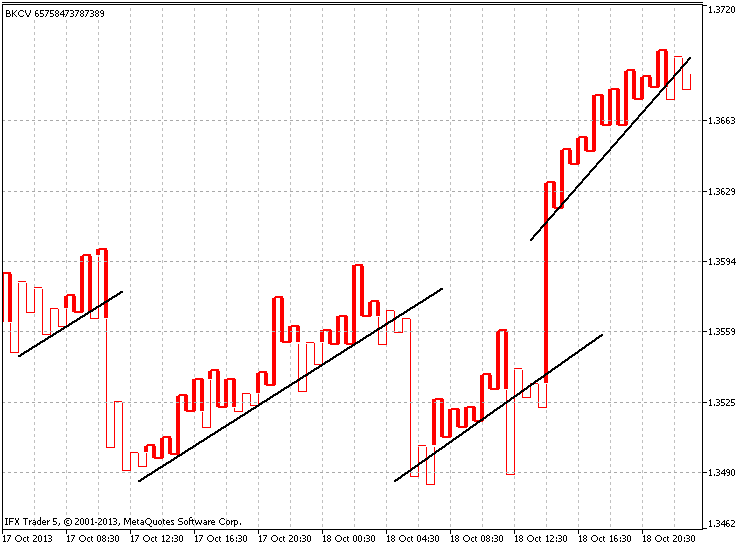
图 5 从走势线下降
我们可以继续移动并通过以下渠道进行交易。图 6(EURUSD H1, 5 点)举例说明了如何搜索渠道,基本相同周期:
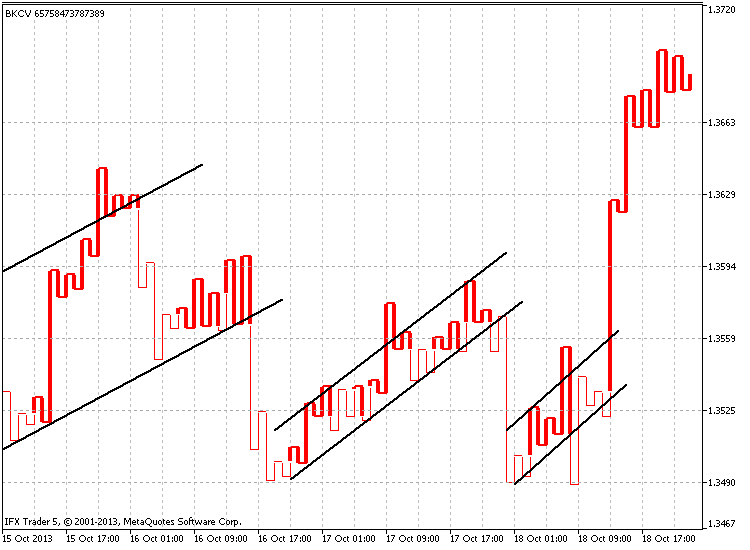
图 6 通过渠道进行交易
这项策略有些冷门,因为在连续 7-10 次提高“肩”或降低“腰”后,一定会出现反转(下降或上升)。
见图 7(GBPUSD H4, 25 点),7 月 10 日 - 10 月 18 日:
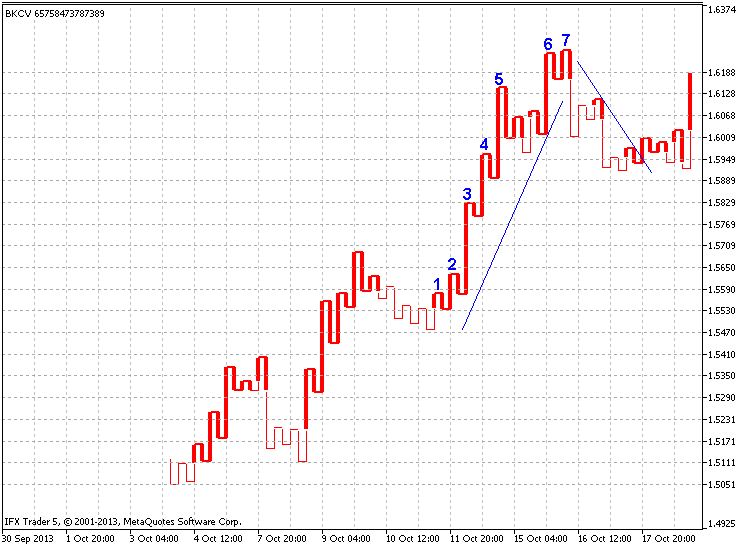
图 7 连续 7-10 次提高“肩”或降低“腰”
如图,在肩上升七次之后,出现了一次大幅下跌,下跌幅度几乎达到之前上升量(约 300 点)的一半。
我们来看“通过价格标签交易”策略,展示使用其它指标参数的必要性。这一理念是说在价格超过(买入)或低于(卖出)之前的价格标签时进入市场。
见图 8(GBPUSD H4, 30 点,修订作图):
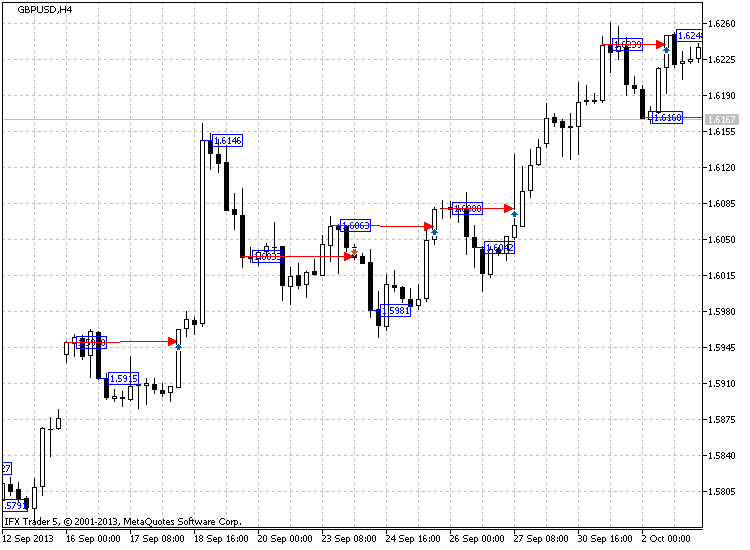
图 8 通过价格标签交易
图 8 中的红色箭头显示了买入或卖出时机。这些箭头从之前的价格标签中生出,显示突破以往价格标签的位置。
时间标签主要用作指示趋势发展的方向。由于可随线型更改时间标签颜色,且阴阳线型显示了趋势的方向或反转,颜色也许能帮我们定义当前的市场情绪。
比如,以图 9 中的 #IBM 股价图(H4, 1%,,标准作图)为例:
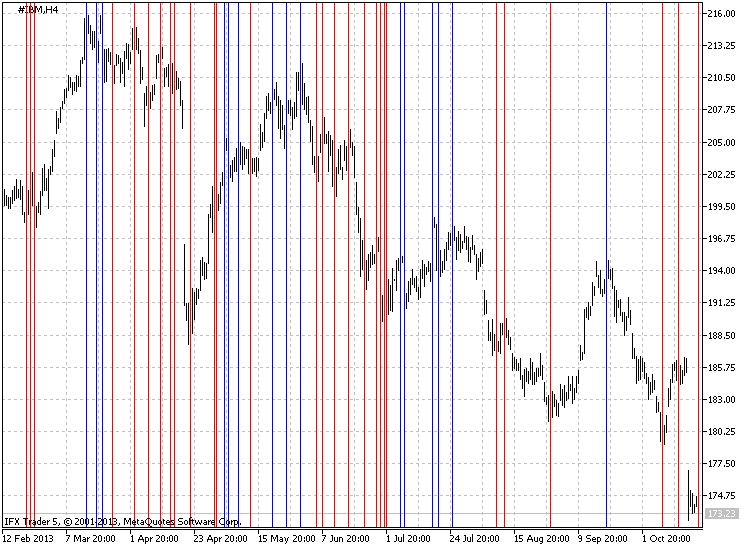
图 9 用时间标签定义趋势方向
图表显示,蓝线主要位于图表的顶部,而红线主要位于底部。
总结
Kagi 图可作为策略基础或更精准分析的辅助工具成功用于市场交易。
我在本文中介绍了代码本身以及构建该指标的一些具体情况。主要目的是创建包含所有必要元素以及可禁用的一些额外功能的多函数指标。
我很高兴能思考关于指标的新理念和新改进,并也许在将来实现这些理念。请向我提供反馈。我非常乐于回答您针对该指标提出的问题。
本文延续了以往专注于开发作图指标的文章系列。可以在 此处 找到之前的文章。本文章系列还将继续,希望能再次与你们见面。感谢您阅读拙作!祝您交易成功,并获得稳定的优化代码。