指标外部参数的图形控制
Vladimir | 11 四月, 2016
简介
你不得不设置或更改指标外部参数的频率有多高? 很多人一定考虑过,使用鼠标将外部参数移到图表上,从而能够方便的拖动图标或对象到所需的位置,以简化指标的设置过程。 MQL4 语言允许在屏幕上显示指标设置。
参数的图形控制
首先,我们需要找出指标中有哪些参数,以及打算对哪些参数进行更改。 为此,打开指标属性并写下需要在工作过程中更改的参数的名称。
例如,我们使用标准终端版本中包含的锯齿形调整浪指标。 在属性中选择变量的名称。
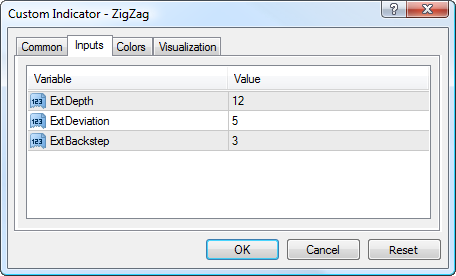
指标参数
ExtDepth=12
ExtDeviation=5
ExtBackstep=3
我们继续创建将用于更改指标参数值的变量和数组。
根据我们要控制的指标的参数,给出指标参数的名称。
// Initial indicator values
int               ExtDepth=12;
int               ExtDeviation=5;
int               ExtBackstep=3;
//---- indicator buffers
double            ZigzagBuffer[];
double            HighMapBuffer[];
double            LowMapBuffer[];
// Array of indicator parameter variables
string            ArrExt[3,3]    ={"12","21","34", "5","8","21", "3","13","34"};
// Arrays of indices
string            Array_Index[]={"Dep -> ","Dev -> ","Back ->"};
int               Coordinats_IndexUp[]={65,160,260};
int               Coordinats_Index[]  ={35,130,230};
int               Coordinats_IndexDn[]={5, 100,200};
// Color for parameter blocks and indices
color             Color_[]={Blue,Green,Red};
在这一步,我认为一切都很清晰。
"Dep -> ","Dev -> ","Back ->"
分别是 ExtDepth、ExtDeviation 和 ExtBackstep。 下面是它们在图表中的显示。
对于每个参数,我们使用三个变量值
string            ArrExtDepth[]    ={"12","15","20"};
string            ArrExtDeviation[]={"5",  "8","21"};
string            ArrExtBackstep[] ={"3", "13","34"};
出于方便,存储在一个三维数组内:
string ArrExt[3,3] ={"12","21","34", "5","8","21", "3","13","34"};
3、5、12 是标准锯齿形调整浪指标的参数中默认设置的标准值。
这里的其他值作为示例给出。 它们将用作指标控制的参数变量。
考虑到这里将涉及很多绘图,我们加入一个函数,用来创建对象并将对象移到单独的程序块:
void Obj_CreateMove_Text (int CreateMove, string Name, int Type, string Number,  color text_color,
                          int DistX, int DistY)
   {
      if (CreateMove==0)
      ObjectCreate(Name,Type,0,0,0);
      ObjectSetText(Name,Number,10,"Arial",text_color);
      ObjectSet(Name,101,3);
      ObjectSet(Name, 102, DistX);
      ObjectSet(Name, 103, DistY);
   }
为了确保控制方便和保持代码紧凑,图形对象的所有坐标都储存在数组中。 这在上面已经进行了展示(查看文章的开头)。
现在我们在图表窗口绘制所有的对象。
图表的右手侧加载的信息较少,所以将沿着窗口右边界垂直分布变量。 每一个参数都有自己的索引,其颜色跟相应的参数变量的颜色相同。
因此,我们需要为每个参数创建三个参数索引和三个变量值。
在屏幕上为指标参数创建对象,显示这些参数的变量数值,并在每个参数块旁边创建对应的索引。
// Create objects
   for( ii=0;ii<3;ii++)
      for( i=0;i<3;i++)
      Obj_CreateMove_Text (0, Array_Index[ii]+i, 23, (ArrExt[ii,i]), Color_[ii], 5, Coordinats_IndexDn[ii]+30*i);
      for( i=0;i<3;i++)
      Obj_CreateMove_Text (0, "Index"+Array_Index[i], 23, (Array_Index[i]),   Color_[i], 25, Coordinats_Index[i]);

图 1
现在我们只需要创建一个程序块,在相关的索引移动时处理用户的操作。
我们拥有对象在图表上的锚点,根据锚点我们逐个读取索引参数并确定程序逻辑。
// Read index coordinates from the chart
      for( i=0;i<3;i++)
           {
            Coordinats[i]=ObjectGet("Index"+Array_Index[i],OBJPROP_YDISTANCE);
               if (Coordinats[i]==0)//If outside of the chart, set again
                  Obj_CreateMove_Text (1, "Index"+Array_Index[i], 23, Array_Index[i], Color_[i], 25, Coordinats_IndexDn[i]);
           }
在保存了得到的值后,我们需要分析它们在图表上的位置并采取必要的操作。 对于分析,我们使用索引的实际位置,作为每个索引的三个基值相对于使用的参数值的参考点。 如果索引移到其组内的最高值以上,将视为已经移至其最高值。 如果索引移到最低的参数值以下,也会类似的移到最低的参数值。 如果索引介于参数的最高和最低值之间,则取中间值。 为了进行对比,我们使用垂直标度,即
the OBJPROP_YDISTANCE parameter来自于
ObjectGet()// Analyze positions of indices for( i=0;i<3;i++) { if (Coordinats[i]>Coordinats_IndexUp[i]) {Move[i] = Coordinats_IndexUp[i]; index[i]=2;}// Index has been moved up if (Coordinats[i]>Coordinats_IndexDn[i] && Coordinats[i]<Coordinats_IndexUp[i]) {Move[i] = Coordinats_Index[i]; index[i]=1;}// Index is in the middle if (Coordinats[i]<Coordinats_IndexDn[i]) {Move[i] = Coordinats_IndexDn[i]; index[i]=0;}// Index has been moved down if (Move[i]!=0)
然后我们对齐已经移动的对象。
保存新的参数值以绘制锯齿形调整浪。
基于这些值,使用图形控制绘制指标。
// Move and align the objects depending on their positions
            Obj_CreateMove_Text (1, "Index"+Array_Index[i], 23, Array_Index[i], Color_[i], 25, Move[i]);
// Save ZigZag parameter values
            switch (i)
               {
                case 0:  ExtDepth =     StrToInteger(ArrExt[0,index[i]]);  break;
                case 1:  ExtDeviation = StrToInteger(ArrExt[1,index[i]]);  break;
                case 2:  ExtBackstep =  StrToInteger(ArrExt[2,index[i]]);  break;
               }/**/
          }
 // Pass parameter values to the custom indicator and plot ZigZag based on the obtained values
     for(i=300;i>0;i--)
            {
               ZigzagBuffer[i]=iCustom(NULL,0,"ZigZag",ExtDepth,ExtDeviation,ExtBackstep,0,i);
               HighMapBuffer[i]=iCustom(NULL,0,"ZigZag",ExtDepth,ExtDeviation,ExtBackstep,1,i);
               LowMapBuffer[i]=iCustom(NULL,0,"ZigZag",ExtDepth,ExtDeviation,ExtBackstep,2,i);
            }
在任意图形对象上双击将其激活。 激活后,可以使用鼠标控制对象。 每次决定更改参数值的时候,都要这样做。

图 2
图 3
图 4
代码的最终版本如下。
//+------------------------------------------------------------------+
//|                                         management_indicator.mq4 |
//|                                  Copyright © 2009, WWW.FIBOOK.RU |
//|                                             http://www.fibook.ru |
//+------------------------------------------------------------------+
#property copyright "Copyright © 2009, WWW.FIBOOK.RU"
#property link      "http://www.fibook.ru"

#property indicator_chart_window
#property indicator_buffers 1
#property indicator_color1 Red
// Initial indicator values
int               ExtDepth=12;
int               ExtDeviation=5;
int               ExtBackstep=3;
//---- indicator buffers
double            ZigzagBuffer[];
double            HighMapBuffer[];
double            LowMapBuffer[];
// Array of indicator parameter variables
string            ArrExt[3,3]    ={"12","21","34", "5","8","21", "3","13","34"};
// Arrays of indices
string            Array_Index[]={"Dep -> ","Dev -> ","Back ->"};
int               Coordinats_IndexUp[]={65,160,260};
int               Coordinats_Index[]  ={35,130,230};
int               Coordinats_IndexDn[]={5, 100,200};
// Color for parameter blocks and indices
color             Color_[]={Blue,Green,Red};
// Variables for calculations
int               i,ii;
int               index[3];
//+------------------------------------------------------------------+
//| Custom indicator initialization function                         |
//+------------------------------------------------------------------+
int init()
  {
//---- indicators
   IndicatorBuffers(3);
//---- drawing settings
   SetIndexStyle(0,DRAW_SECTION);
//---- indicator buffers mapping
   SetIndexBuffer(0,ZigzagBuffer);
   SetIndexBuffer(1,HighMapBuffer);
   SetIndexBuffer(2,LowMapBuffer);
   SetIndexEmptyValue(0,0.0);
//----
   return(0);
  }
//+------------------------------------------------------------------+
//| Custom indicator deinitialization function                       |
//+------------------------------------------------------------------+
int deinit()
  {
//----

//----
   return(0);
  }
//+------------------------------------------------------------------+
//| Custom indicator iteration function                              |
//+------------------------------------------------------------------+
int start()
  {
int  Coordinats[3];
int  Move[3];
// Check if index objects are on the chart
   if (ObjectGet("IndexDep -> ",OBJPROP_YDISTANCE)<1||
       ObjectGet("IndexDev -> ",OBJPROP_YDISTANCE)<1||
       ObjectGet("IndexBack ->",OBJPROP_YDISTANCE)<1)
// If they are not on the chart, create them
               {
      for( ii=0;ii<3;ii++)
       for( i=0;i<3;i++)
        Obj_CreateMove_Text (0, Array_Index[ii]+i, 23, ArrExt[ii,i], Color_[ii], 5, Coordinats_IndexDn[ii]+30*i);
       for( i=0;i<3;i++)
        Obj_CreateMove_Text (0, "Index"+Array_Index[i], 23, Array_Index[i], Color_[i], 25, Coordinats_IndexDn[i]);
               }
// Read index coordinates from the chart
      for( i=0;i<3;i++)
           {
            Coordinats[i]=ObjectGet("Index"+Array_Index[i],OBJPROP_YDISTANCE);
               if (Coordinats[i]==0)//If outside of the chart, set again
                  Obj_CreateMove_Text (1, "Index"+Array_Index[i], 23, Array_Index[i], Color_[i], 25, Coordinats_IndexDn[i]);
           }
// Analyze positions of indices
      for( i=0;i<3;i++)
         {
            if (Coordinats[i]>Coordinats_IndexUp[i])
                  {Move[i] = Coordinats_IndexUp[i]; index[i]=2;}//Index has been moved up
            if (Coordinats[i]>Coordinats_IndexDn[i]  &&
                Coordinats[i]<Coordinats_IndexUp[i])
                  {Move[i] = Coordinats_Index[i];   index[i]=1;}// Index is in the middle
            if (Coordinats[i]<Coordinats_IndexDn[i])
                  {Move[i] = Coordinats_IndexDn[i]; index[i]=0;}// Index has been moved down
            if (Move[i]!=0)
// Move and align the objects depending on their positions
            Obj_CreateMove_Text (1, "Index"+Array_Index[i], 23, Array_Index[i], Color_[i], 25, Move[i]);
// Save ZigZag parameter values
            switch (i)
               {
                case 0:  ExtDepth =     StrToInteger(ArrExt[0,index[i]]);  break;
                case 1:  ExtDeviation = StrToInteger(ArrExt[1,index[i]]);  break;
                case 2:  ExtBackstep =  StrToInteger(ArrExt[2,index[i]]);  break;
               }/**/
          }
 // Pass parameter values to the custom indicator and plot ZigZag based on the obtained values
     for(i=300;i>0;i--)
            {
               ZigzagBuffer[i]=iCustom(NULL,0,"ZigZag",ExtDepth,ExtDeviation,ExtBackstep,0,i);
               HighMapBuffer[i]=iCustom(NULL,0,"ZigZag",ExtDepth,ExtDeviation,ExtBackstep,1,i);
               LowMapBuffer[i]=iCustom(NULL,0,"ZigZag",ExtDepth,ExtDeviation,ExtBackstep,2,i);
            }
Comment ("ExtDepth =",ExtDepth,", ExtDeviation =",ExtDeviation,", ExtBackstep =",ExtBackstep);
//----
   return(0);
  }
// Function for creating and moving graphical objects
void Obj_CreateMove_Text (int CreateMove, string Name, int Type, string Number,  color text_color, int DistX, int DistY)
   {
      if (CreateMove==0)
      ObjectCreate(Name,Type,0,0,0);
      ObjectSetText(Name,Number,10,"Arial",text_color);
      ObjectSet(Name,101,3);
      ObjectSet(Name, 102, DistX);
      ObjectSet(Name, 103, DistY);
   }


//+------------------------------------------------------------------+
总结
通过显示需要设置的参数,上述方法可以用来从外部控制任何指标。