Chuvashov 的三角形机械交易系统
Genkov | 11 四月, 2016
简介
本文讨论了如何计算柱的位置和趋势线的预期交叉时间。 趋势线的产生原则接近于 Thomas DeMark 在最后的时间间隔上构建 TD 的原则。
尽管所提供的应用程序是一个成熟的自动化 Expert Advisor,但可以集成到更加复杂的交易系统中作为它的一部分。
构建交叉通道的基本原则
“Chuvashov 的三角形”形态的本质在于以下理念:在任何时点,我们始终具有最后两个下分形和两个上分形。 通过这两个上分形和两个下分形绘制趋势线。
如果这 2 条线继续向右延伸时交叉形成三角形,我们就得到被称为“Chuvashov 的三角形”的形态。 这两条基准线的交叉点被称为顶点。 按照 4 个分形出现的顺序对其进行编号。
通过左边第二个分形绘制一条垂直线。 同时,绘制一条通过顶点的垂直线。 这两条垂直线之间的蜡烛图的数量(包含线上的蜡烛图)除以 3 并进行圆整,在顶点的左侧绘制第三条垂线。
穿过第二个分形绘制的垂线和中间垂线之间的距离将构成 实际突破区域。
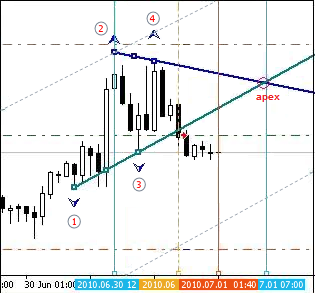
图 1 绘制三角形
我们开始绘制三角形。
最后 4 个分形可能存在多个位置,其中要么不可能绘制三角形,要么就是过短或过长。
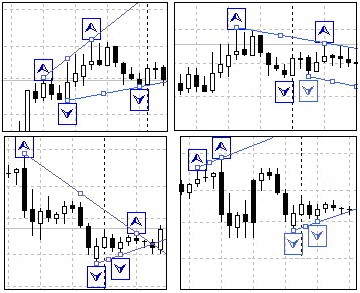
图 2 分形的不利位置示例
因此,有必要引入一些满足三角形绘制的条件:
三角形线收敛的一些条件:
- 上线和下线的第一个分形应该在高度上间距至少 20-30 个基点(该值可以在测试时更加确切的指定)。
- 上线和下线的第一个分形之间的距离小于两线的第二个分形之间的距离。
- 上线的第一个分形应低于同一条线的第二个分形,而下线的第一个分形应高于下线的第二个分形。
这些补充条件已经在形态形成条件的程序块中予以考虑。
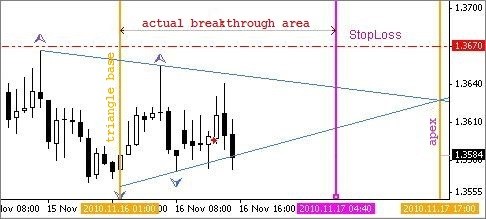
图 3 实际突破区域
这似乎很清楚,但我们来看图 3。 我们如何定义两条基准线发生交叉时的柱数?
在线突破的时候,尚不知道是否为真实的突破,尽管已经是进入市场的时机。 真实突破区域计算程序块利用时间参数解决了这个问题,即在时间范围内定义基准线的交叉。
我们知道,每过一段时间图表上就出现一个柱。 例如,在 H1 图表上每小时出现一个新柱。 只有知道了这两条线上单位时间的价格变化率,才能计算交叉的时间。 只有知道了从三角形的“底”到交叉时刻的时间量,才能计算交叉之前的柱数(时间单位)。 真实突破区域也在这个程序块进行定义。
该 Expert Advisor 是逐块进行设计。
反复出现最多的功能块一般位于程序的开头:打开和关闭头寸,绘制符号和线的函数。 主要的可执行程序还包含单独的程序块,比如:
- 搜索上分形和下分形的程序块;
- 形态形成条件的程序块;
- 计算真实突破区域的程序块;
- 打开头寸的条件的程序块。
功能块的程序片段显示如下。
// --------------------------------------------------------------------+
void Op_Sell_Ch()
  {
  if(!OrderSend(Symbol(),OP_SELL,Lots,Bid,2,Ask+SL_S*Point,
      Bid-TP_S*Point," ",Magic,0,Red))
      { Print("  SELL order open error  # ",GetLastError()); }
      return(0);
     }
// --------------------------------------------------------------------+
void Op_Buy_Ch()
  {
  if(!OrderSend(Symbol(),OP_BUY,Lots,Ask,2,Bid-SL_B*Point,
      Ask+TP_B*Point," ",Magic,0,Blue))
      { Print("  SELL order open error  # ",GetLastError()); }
      return(0);
     }
//+--------------------------------------------------------------------+
void Close_S_Ch()
  {
  if(!OrderClose(OrderTicket(),OrderLots(),Ask,2,Aqua))
      {Print(" Cl.ord.# ",OrderTicket()," Error # ",GetLastError());}
      return(0);
     }
//+--------------------------------------------------------------------+
根据分形的创建规则,在柱的排序循环中提供了用于构建三角形基准线的上参考点和下参考点的搜索。
进行参考点的编号时,已考虑“对时间序列的元素标引是从最后一个到第一个逆向进行。 当前柱是数组中最后一个,标引为 0”。
// ====================================================================+
// (upper and lower fractals searching block) ---------------------------+
   for (i=M;i<=N;i++) // reference points (fractals) searching loop
    {//loop b
   // searching for upper fractals -----------------------------------------+
   if(High[i]>High[i+1] && High[i]>High[i+2] &&
      High[i]>High[i-1] && High[i]>High[i-2])
     {// frac_b
      Tfnb++;   // counter
   // ----------------------------
     if(Tfnb==1)
           {             // for the 1 st fractal: price, index, time.
           TF1B=High[i]; Tf1b=i; timf1b=iTime(Symbol(),Period(),i);
      }//-counter_1
   // ----------------------------
          if(Tfnb==2)
           {//counter_2                       // price, index, time.
            TF2B=High[i]; Tf2b=i; timf2b=iTime(Symbol(),Period(),i); break;
           }//-counter_2
        // ----------------------------
     }//-frac_b
    }//-b loop
// --------------------------------------------------------------------+
   for (i=M;i<=N;i++) // reference points (fractals) searching loop
    {//s loop
   // searching for lower fractals ------------------------------------------+
   if(Low[i]<Low[i+1] && Low[i]<Low[i+2] &&
      Low[i]<Low[i-1] && Low[i]<Low[i-2])
     {// frac_s
      Tfns++;
     if(Tfns==1)
           {//counter_1                    // price, index, time.
           TF1S=Low[i]; Tf1s=i; timf1s=iTime(Symbol(),Period(),i);
           }//-counter_1
           if(Tfns==2)
            {//counter_2                    // price, index, time.
            TF2S=Low[i]; Tf2s=i; timf2s=iTime(Symbol(),Period(),i); break;
           }//-counter_2
     }//-frac_s
    }//- loop s
// ---------------------------(upper and lower fractals searching block)-+
下面的条件已经包含在基准线收敛程序块,以形成三角形:
- 第一个分形的间距应该大于 20-30 个基点;
- 一条基准线的第一个分形应该小于另一条线的第二个分形;
- 所有的 4 个参考点都不为“0”,即它们有实际值;
- 参考点的时间参数不应为“0”;
- 第一个上参考点低于第二个上参考点,第一个下参考点高于第二个下参考点;
- 两条线的第二个分形之间的差不应超过 150 个基点。
// ---------------------------------------------------------------------------+
   if((TF1B-TF1S)>25*Point &&
      Tf1b<=Tf2s && Tf1s<=Tf2b &&
      TF1B>0 && TF1S>0 && TF2B>0 && TF2S>0 &&
      timf1b!=0 && timf2b!=0 && timf1s!=0 && timf2s!=0 &&
      TF1B<TF2B && TF1S>TF2S &&
      (TF2B-TF2S)/Point<150)
    {// triangle drawing conditions
//===========================================================================+
在满足初步条件后,计算上基准线和下基准线的价格变化率:
// -----------------------------------------------------------------------------+
   // -   (block Price change rate calculation)(upper and lower pips per one bar)
   if(TF1B!=TF2B) {RatePriceH=MathAbs((TF2B-TF1B)/(Tf2b-Tf1b));} // for the upper
   if(TF1S!=TF2S) {RatePriceS=MathAbs((TF1S-TF2S)/(Tf2s-Tf1s));} // for the lower
   // Print(" RatePriceS= ",RatePriceS); Print(" RatePriceH= ",RatePriceH);
// -------------------------------------(block Price change rate calculation)---+
此时,4 个最后的分形根据三角形形成条件进行定位,尽管尚不清楚顶点的距离以及真实突破区域位于何处。 根据最后 4 个分形在生成过程中(在图表上从左到右)第二个分形的位置计算顶点。
长基准线的起点应定义为穿过短基准线的第二个分形的垂线跟长基准线的交点。 在这方面,后续的程序算法在真实突破区域的计算上分成两个方向: “长”上基准线和“长”下基准线。
关于其中一个方向的基本代码片段显示如下。 第二个方向使用相同的算法进行计算。
// жжжжжжжжжжжжжжжжжжжжжжжжжжжжжжжж 1. upper working line is longer than the lower one  жжжжжжжжжжжжжжжжжжжжжжжжжжжжжжжжжжжжжж+
// - (block of searching for the working line's intersection point) ----------------------------------------------------------+
// If the upper working line is longer than the lower one - find the intersection point on 50 bars
   if(Tf2b>Tf2s && TF2B>TF1B && TF2S<TF1S)
    {// The upper working line is longer
     // the starting price for calculation of values at each bar of the upper working line
     Starting_Price_H=TF2B-RatePriceH*(Tf2b-Tf2s);
     // the starting price for calculation of values at each bar of the upper working line
     Starting_Price_S=TF2S;
     //the time of drawing the vertical line at the triangle's base
     time_starting=timf2s;
     // ------------------------------------
    for(int k=1;k<=50;k++)
    {//50b loop
     PricB[k]=Starting_Price_H-RatePriceH*k;      // minus fall rate
     PricS[k]=Starting_Price_S+RatePriceS*k;      // plus rising rate
                            //       if prices of the upper and lower lines' projections coincide or the price of the upper one
    if(PricB[k]<=PricS[k])  // has become less than that of the lower one, then there is the intersection with the working line
     {//there is the intersection
     P_Tria=PricB[k-1];                                        // working line intersection price (-1) - should be one bar less
     cut_left=k;  break;                                       //     number of bars from the base up to the intersection point
     }//-there is an intersection
    }//-50b loop
// -------------------------------------- (block of searching for working line's intersection point)--------------------------+
现在,我们可以开始计算真实突破区域的时间参数:
// ---------------------------------------------------------------------------+
// - (block of calculating time intervals for the actual breakthrough area)-----------+
// Introduce two additional limitations:
// 1. The Apex should not be located more than 50 bars far from the triangle's base
// 2. The Apex should not be located closer than 15 bars to the triangle's base.
   if(cut_left<50 && cut_left>12)
    {//triangle with all limitations
     time_Apex=timf2s+cut_left*T_period;                        // Apex generation time
     //  divide the number of bars by three, take 2/3 and round them off to the integer
     // value: MathRound(cut_left/3*2) -number of bars for the actual breakthrough area
     time_bar_zona=time_starting+MathRound(cut_left/3*2)*T_period;          //area time
     //      pattern creation conditions fulfilled, actual breakthrough area calculated
     PatternTch=true;                          // "Chuvashov's Triangle" pattern formed
     }//-triangle with all limitations
// ------------(block of calculating time intervals for the actual breakthrough area)-+
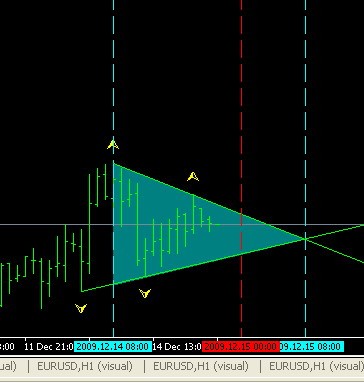
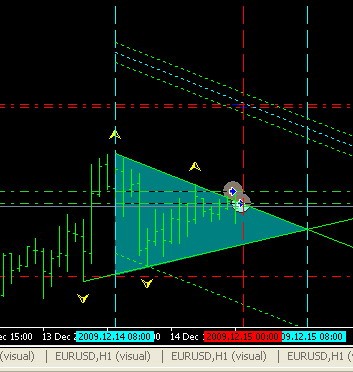
现在,形态已经形成,可以开始运行三角形绘制程序块:
// - (block of drawing the triangle after the pattern has been formed) ---+
   if(PatternTch==true)
    {//there is a pattern
    Del_Frb(); Del_Frs();       // delete previous upper and lower fractals
    CreateArrow_Frb(); CreateArrow_Frs();  // draw upper and lower fractals
    Create_Tr_H(); Create_Tr_S();       // draw upper and lower trend lines
    CreateLzona(); CreateLbasis(); CreateLApex();    // draw vertical lines
    CreateTriangleH();               // draw the triangle by the upper line
    ObjectDelete("TRS");   // delete the triangle drawing by the lower line
// -----(block of drawing the triangle after the pattern has been formed)-+
The screenshot below displays the operation of "Chuvashov's Triangle" pattern drawing block:
然后进入开仓的程序块。
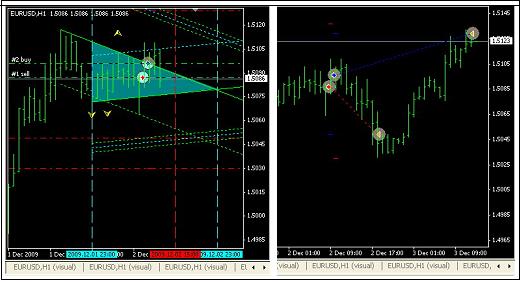
如果符合开仓条件,则计算具有被超越的基准线的通道绘图。 创建通道。
StopLoss 和 TakeProfit 的计算将考虑资金管理系统的要求,然后进行开仓(本例中是买入头寸 - 查看下面的截屏)。
但是,如果在两个方向都满足开仓条件,则可以在两个方向开仓(查看下面的截屏)。
然后程序跟踪形态的持续时间。
如果当前时间超过了真实突破的时间,程序将禁止开仓。 如果当前时间超过了顶点时间,程序将删除所有的形态绘图,从图表上清除已经不需要的符号和线。
形态的持续时间程序块显示如下。
// - (block defining the pattern's life time) -------------------------------+
// if the current time exceeds the actual breakthrough area boundary's time, the pattern loses its power
   if((TimeCurrent()-time_bar_zona)>=T_period)
    {
     PatternTch=false; // the pattern is outdated - introduce the ban on opening positions
    }
    // after the current time exceeds the Apex one
    if((TimeCurrent()-time_Apex)>=T_period)
     {
      // delete pattern signs and lines from the chart
      Del_Frs(); Del_Frb(); Del_TrLin();
      // delete the lines of channel profit size by the upper working line
      ObjectDelete("Tr_B1h"); ObjectDelete("Tr_B1hh"); ObjectDelete("Tr_B1hs");ObjectDelete("Tr_B1s");
      // delete the lines of channel profit size by the lower working line
      ObjectDelete("Tr_S1s"); ObjectDelete("Tr_S1sh"); ObjectDelete("Tr_S1ss");ObjectDelete("Tr_S1h");
      // delete the vertical lines of the actual breakthrough area
      ObjectDelete("L1");ObjectDelete("zona");ObjectDelete("Ap");
      ObjectDelete("TRH"); ObjectDelete("TRS");
     }
// --------------------(block defining the pattern's life time)-+
程序块的运行结果显示在上一个截屏的右侧。
这里所介绍的 Expert Advisor 在自动测试时展示出作为机械交易系统的积极结果。
- 毛利和毛损比 P/F = 38869/16480 = 2.36(大于 2);
- 交易次数 = 101(不小于 100);
- 亏损比例 = 25,18%(见附件)。
简短总结如下:
所描述的技巧可供交易者作为交易系统的组成部分使用,但应该添加开仓过滤器作为改进。
这里提到的过滤器可以根据该技术的发明者 Stanislav Chuvashov 的建议进行改善。
附件备注:
- Triangle_H1_v46.mq4 – 提供的机械交易系统
- Strategy_Tester_Report_46.zip – 测试结果
- table_3.zip – 对于分析爱好者