|
5+ yıl
deneyim
|
20
ürünler
|
50
demo sürümleri
|
|
84
işler
|
0
sinyaller
|
0
aboneler
|
Hizmetimi kullanın ve aşağıdaki bağlantıya tıklayarak ticaret stratejilerinizi oluşturmama izin verin: https://www.mql5.com/en/job/new?prefered=ashkan.nikrou
Forex piyasası için güvenilir stratejiler geliştirmek için sıkı çalışıyorum. Lütfen ürün sayfamı ziyaret edin ve forex çözümlerimi test edin: https://www.mql5.com/en/users/ashkan.nikrou/seller#products
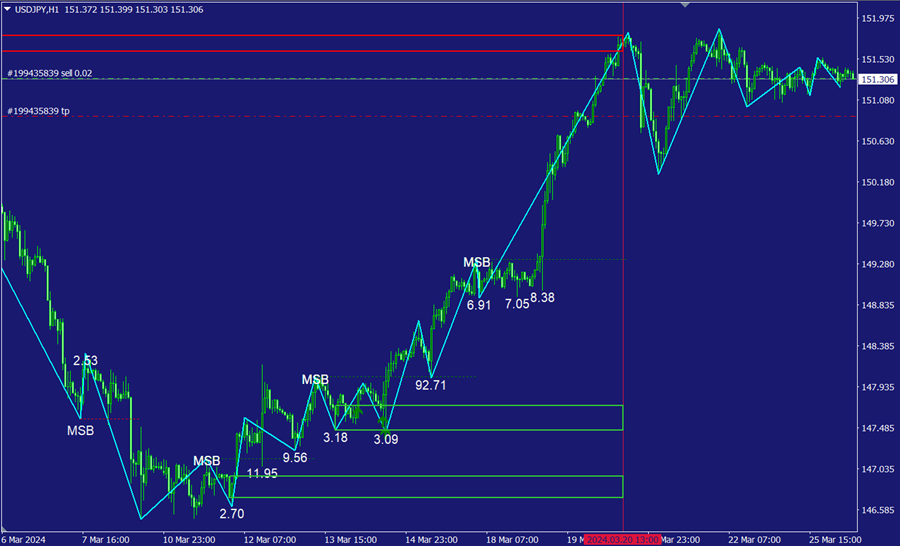
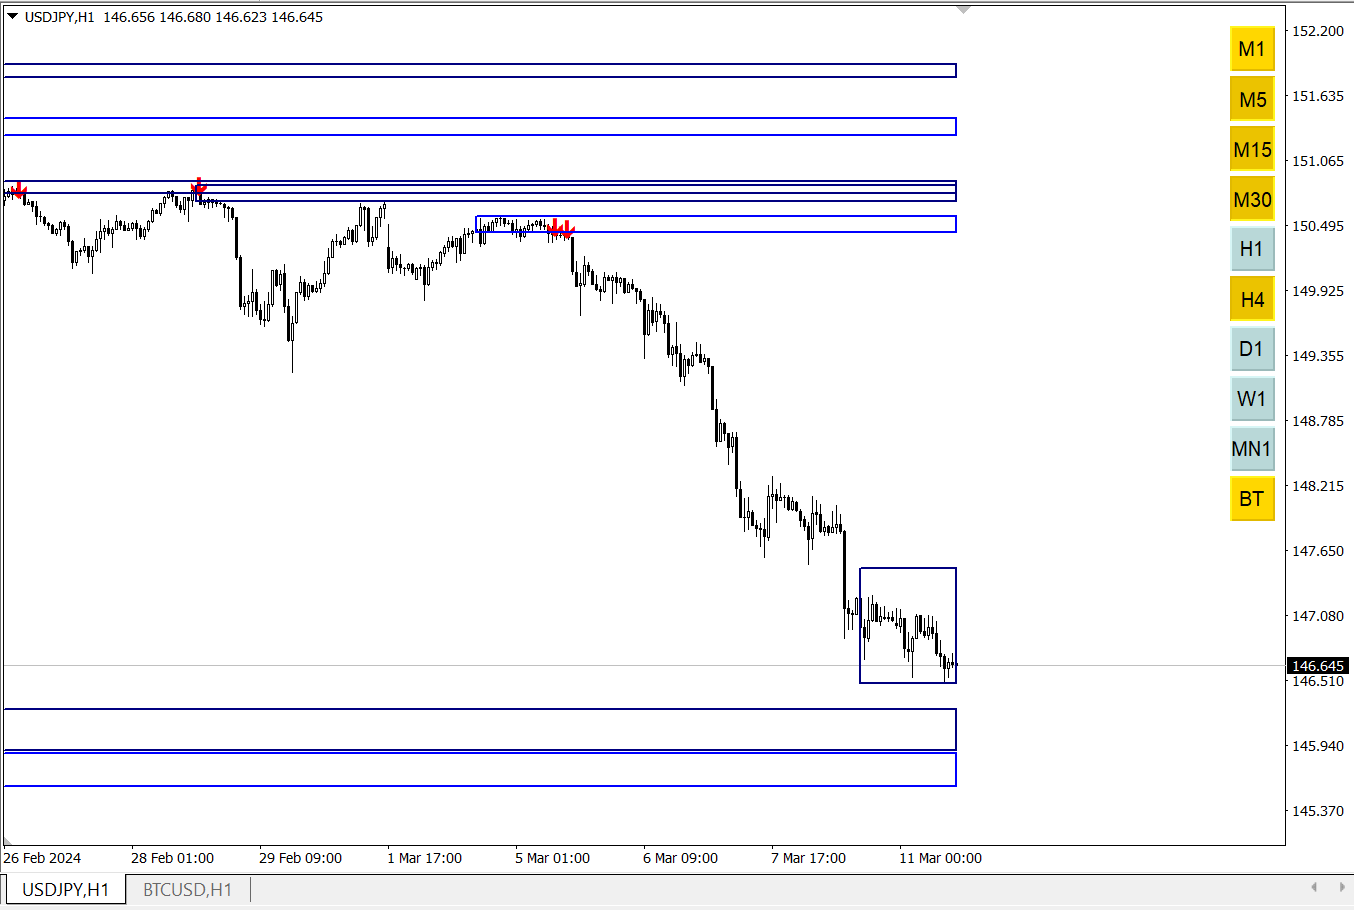
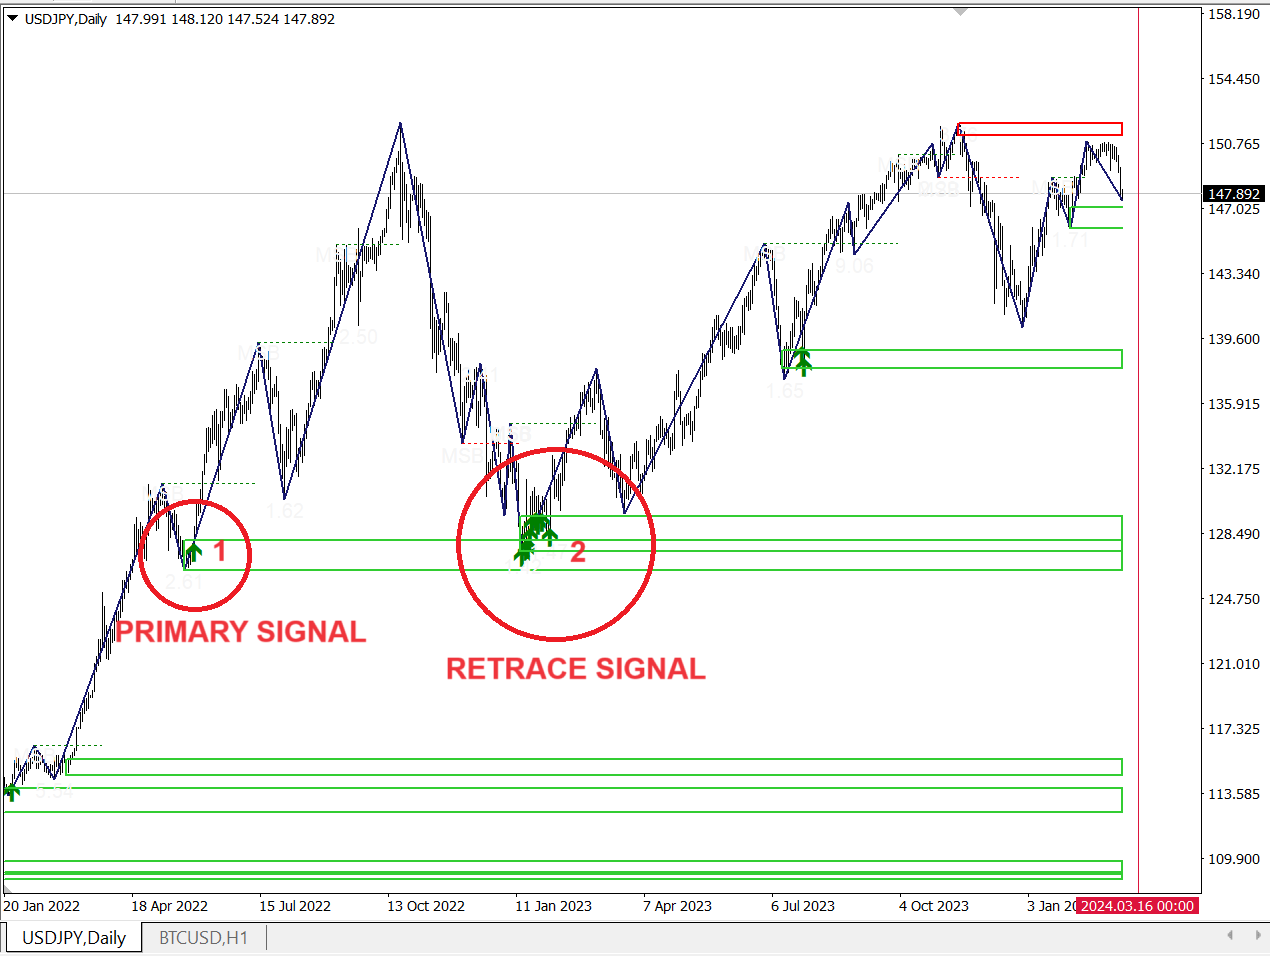
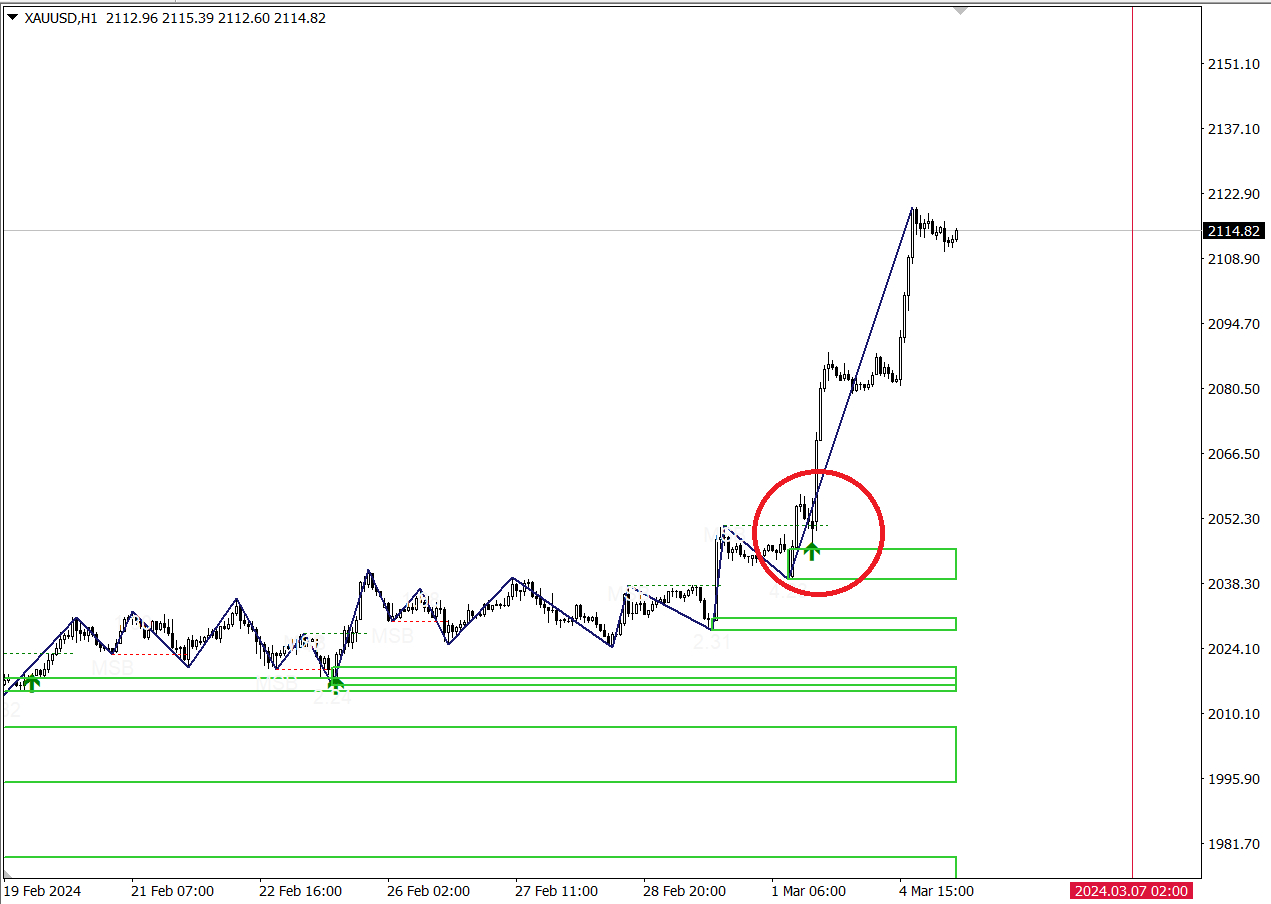
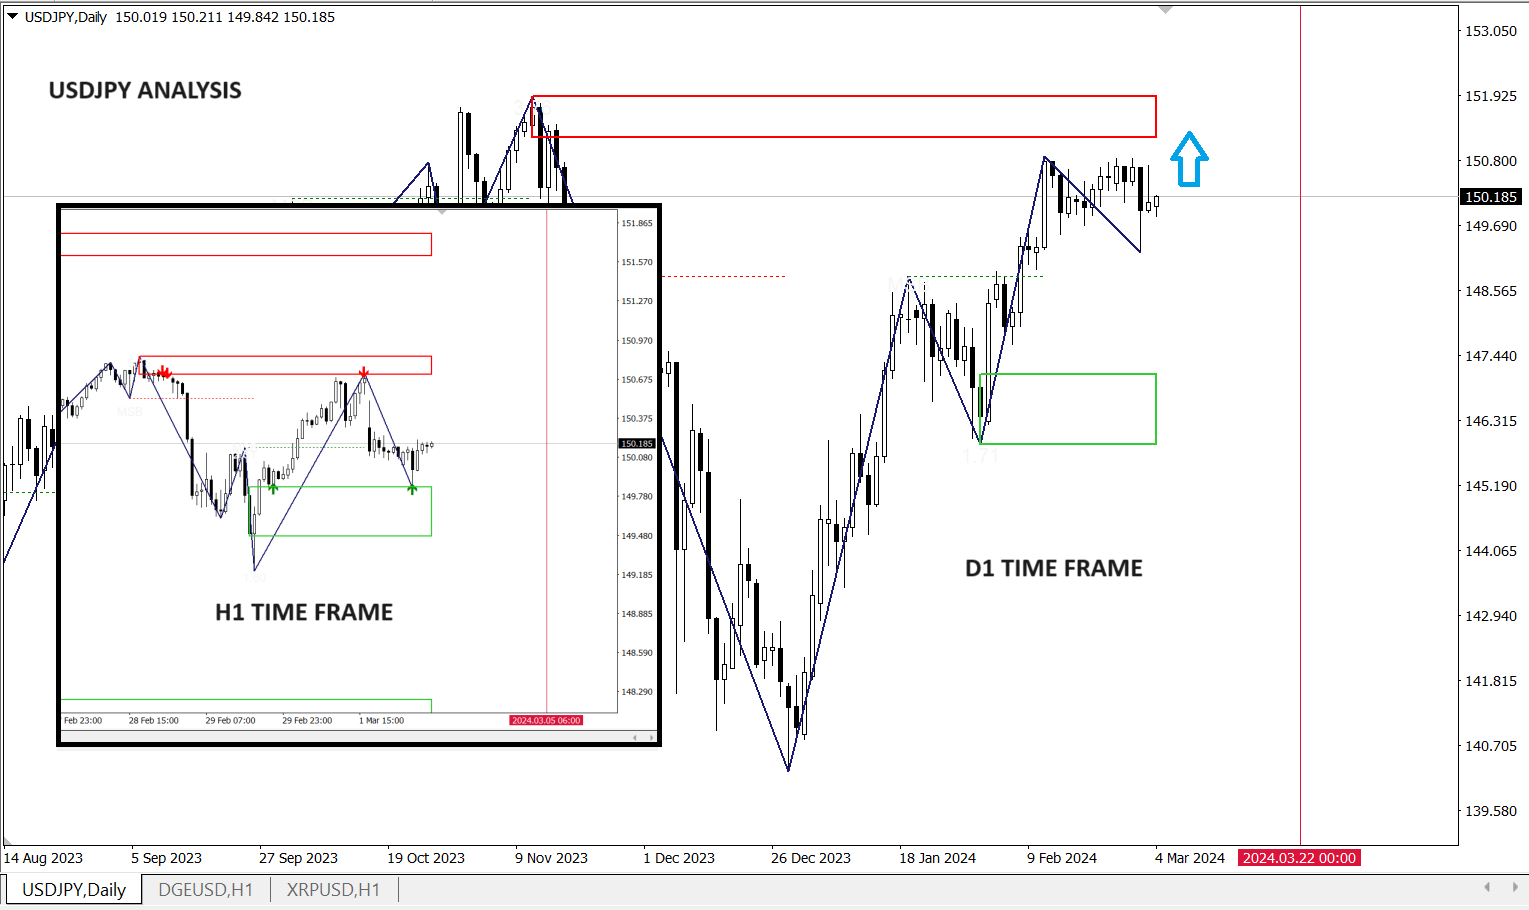
MSB (Market Structure Break Out) Article :
https://www.mql5.com/en/blogs/post/755387
YouTube'daki forex videolarımı izleyin: https://www.mql5.com/en/blogs/post/740668
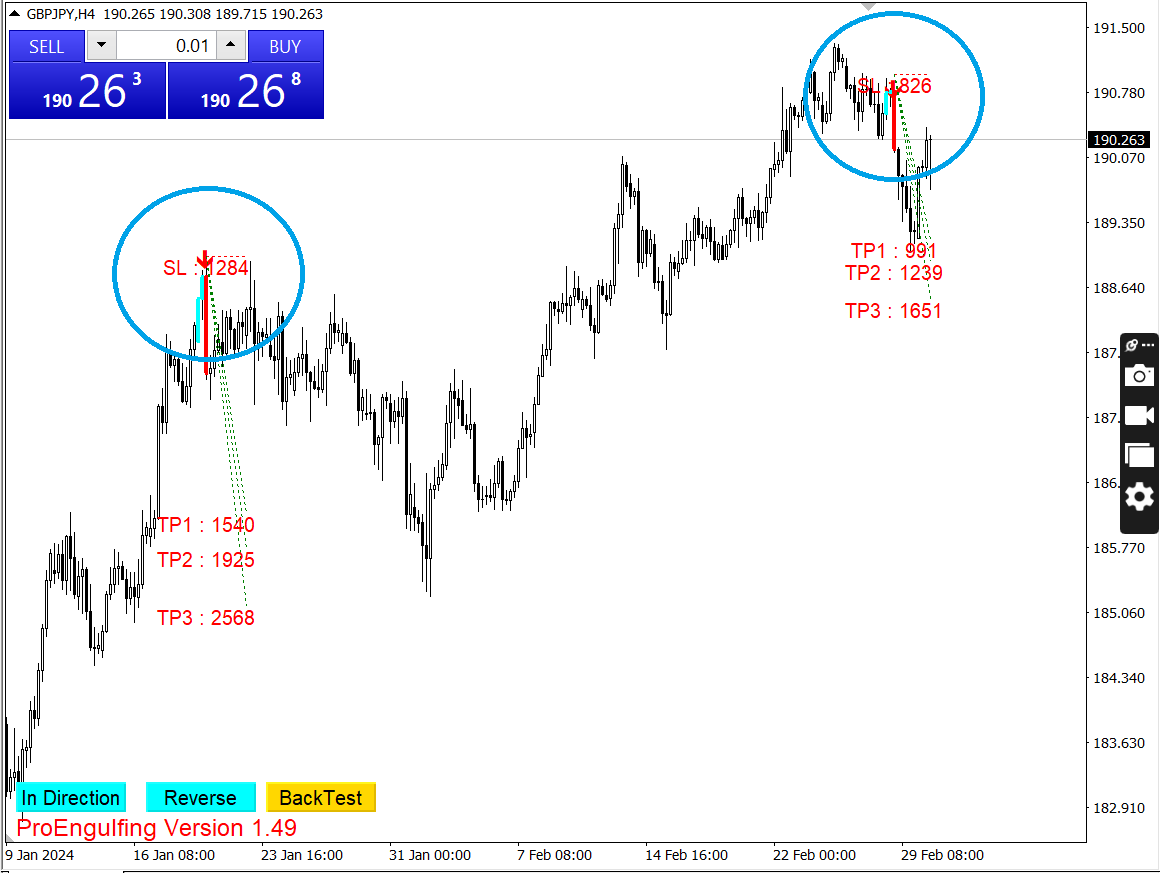
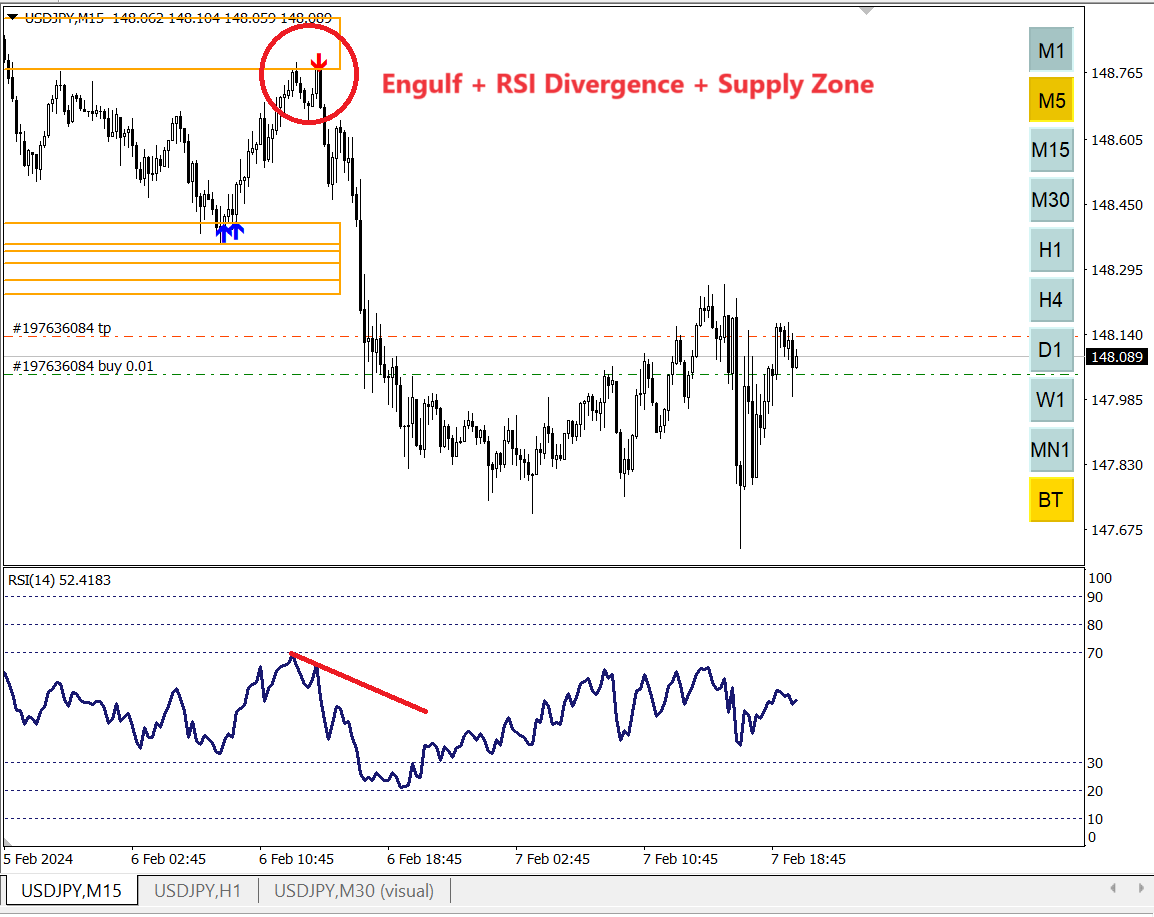
ProEngulfing Kanalına katılın: https://www.mql5.com/en/channels/proengulfing
Forex piyasası için güvenilir stratejiler geliştirmek için sıkı çalışıyorum. Lütfen ürün sayfamı ziyaret edin ve forex çözümlerimi test edin: https://www.mql5.com/en/users/ashkan.nikrou/seller#products
MSB (Market Structure Break Out) Article :
https://www.mql5.com/en/blogs/post/755387
YouTube'daki forex videolarımı izleyin: https://www.mql5.com/en/blogs/post/740668
ProEngulfing Kanalına katılın: https://www.mql5.com/en/channels/proengulfing
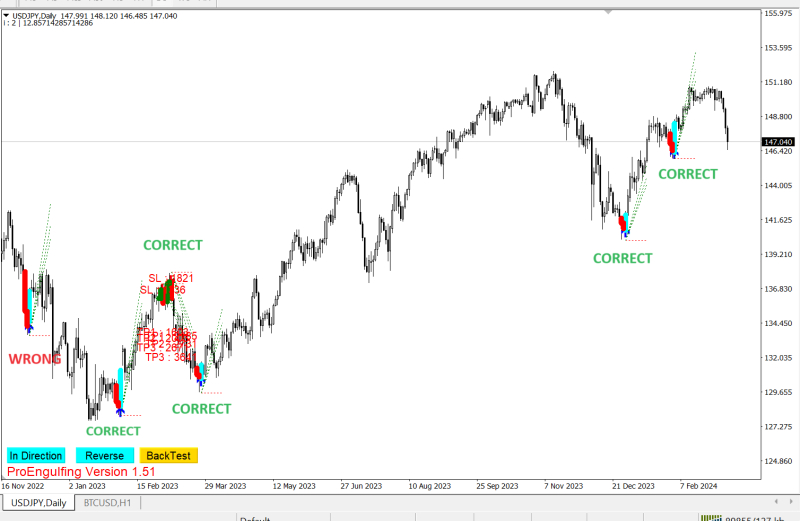

Ashkan Hazegh Nikrou
Ashkan Hazegh Nikrou
2024.03.03
Join Koala Channel For More
https://www.mql5.com/en/channels/koalatradingsolution
https://www.mql5.com/en/channels/koalatradingsolution