Crazy Color Cloud
- Göstergeler
- Igor Gerasimov
- Sürüm: 2.2
- Güncellendi: 10 Nisan 2023
- Etkinleştirmeler: 5
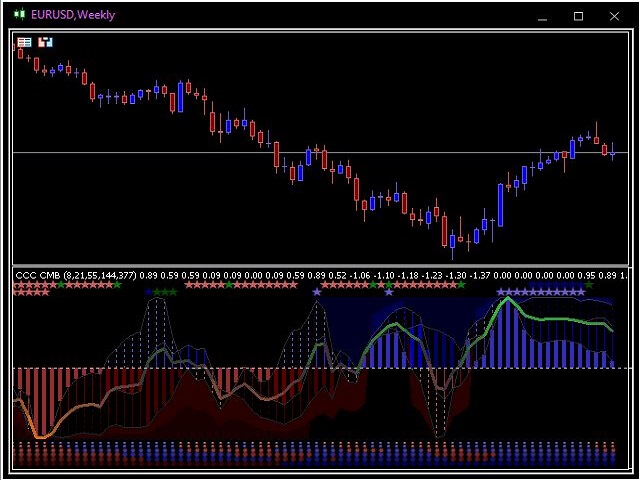
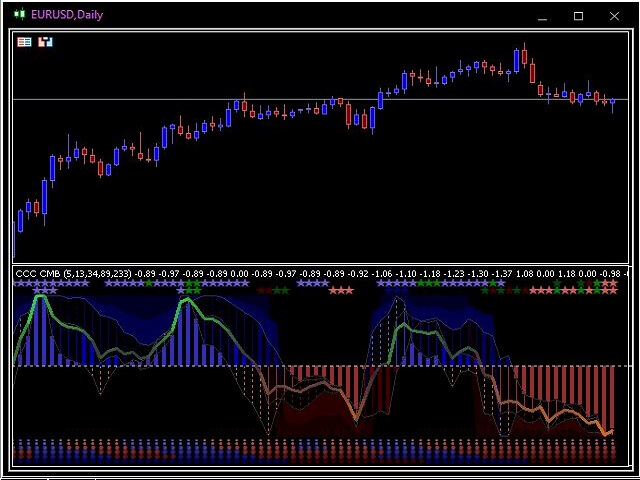
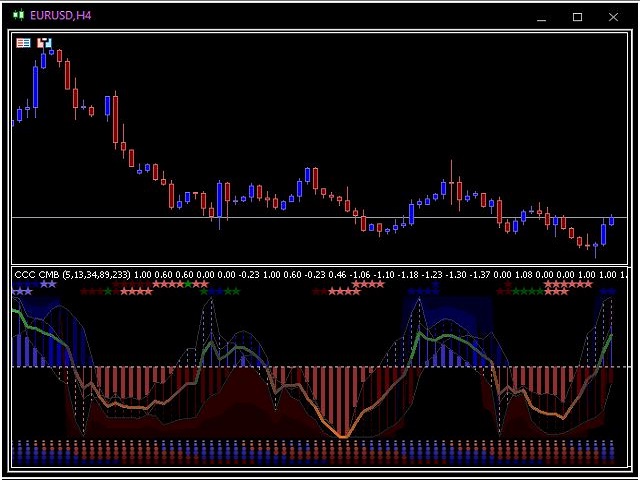
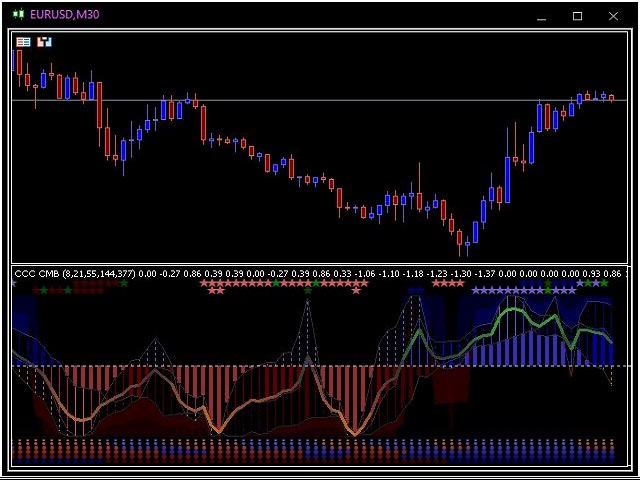
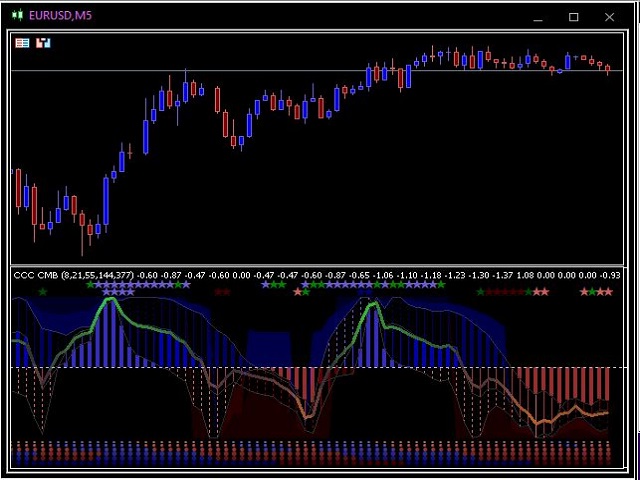
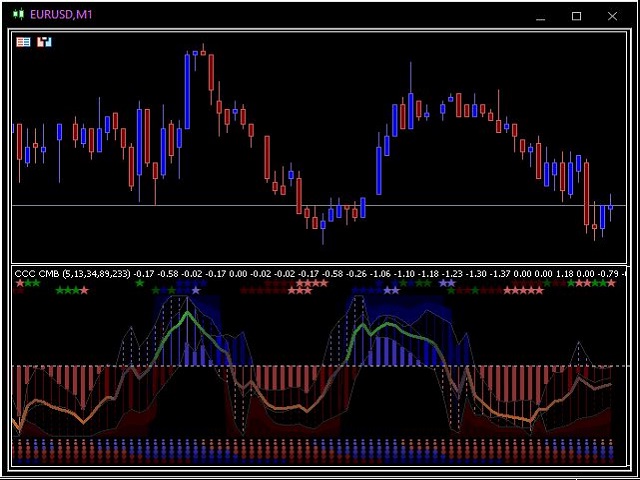
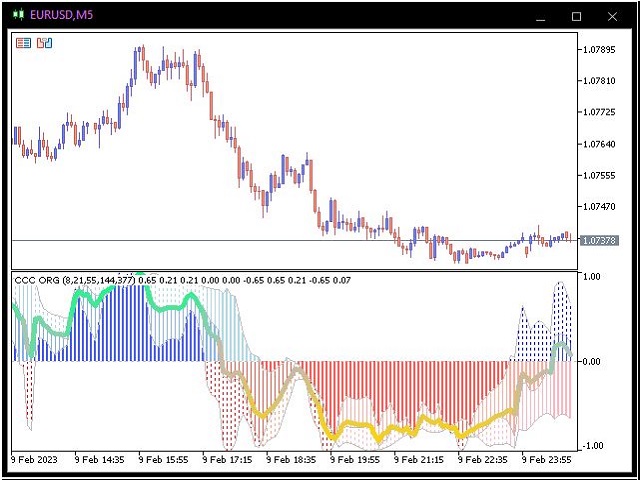
Bu gösterge, filtrelenmiş fiyat bilgilerini görüntüler
üç renkli histogram ve bir ortak renkli çizgi şeklinde.
Bu çok renkli ve güzel bir göstergedir.
Fiyat hareketinin gücünü ve yönünü belirlemek için harika.
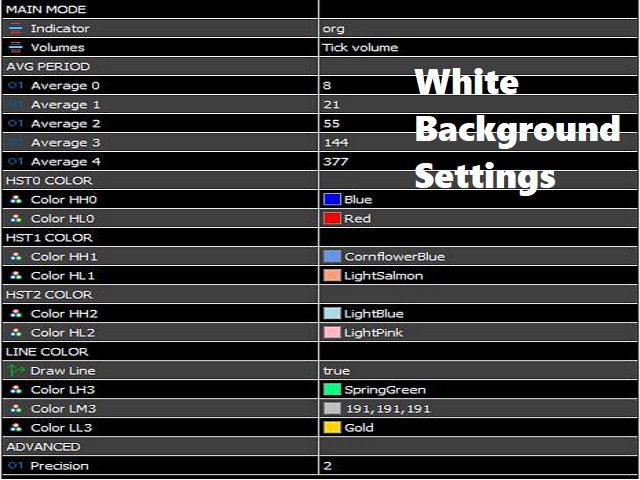
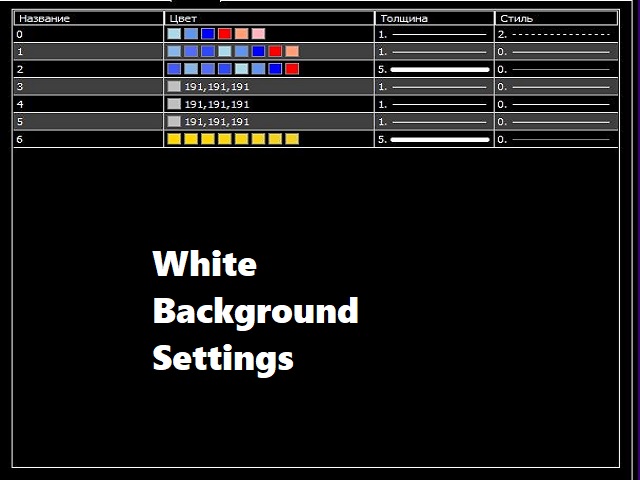
Bu göstergenin çok basit ayarları vardır:
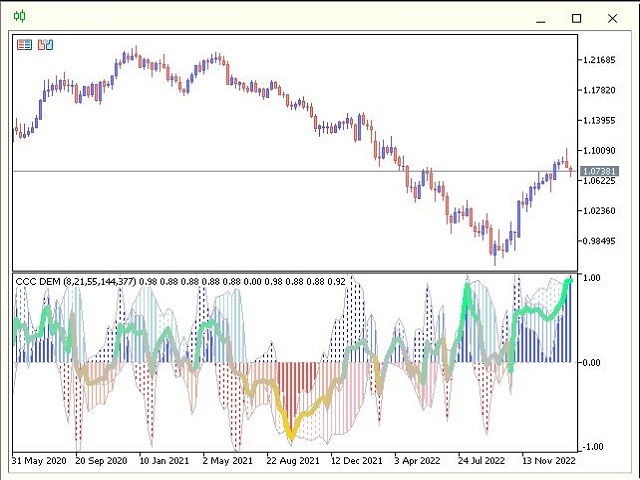
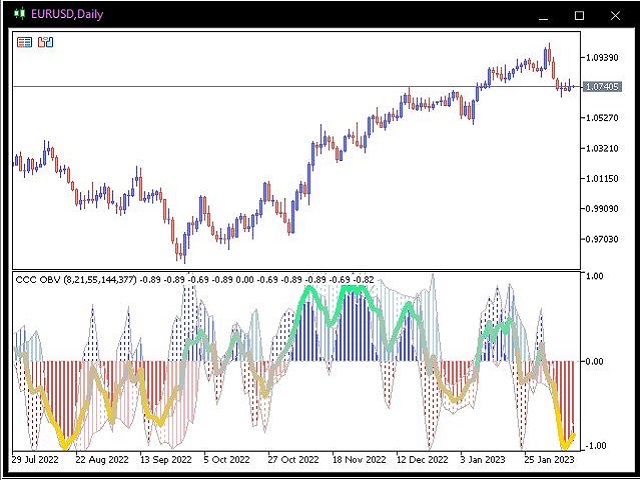
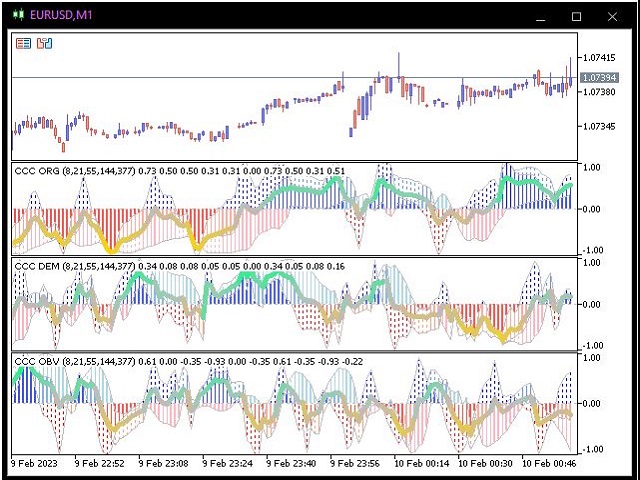
1) göstergeyi hesaplamak için üç seçeneğin seçimi:
- orijinal,
- sınırlayıcı,
- denge hacmi.
2) beş farklı dönem seçimi.
3) görüntülenen rengin seçimi.
4) doğruluk seçimi.
////////////////////////////////////////////////////////////////////////////// /////////
Umarım bu gösterge başarılı ticarette sizin için çok faydalı olacaktır.
İyi şanlar.