• Genel bakış
  • İncelemeler (4)
  • Yorumlar

Auto Trend Fit

5

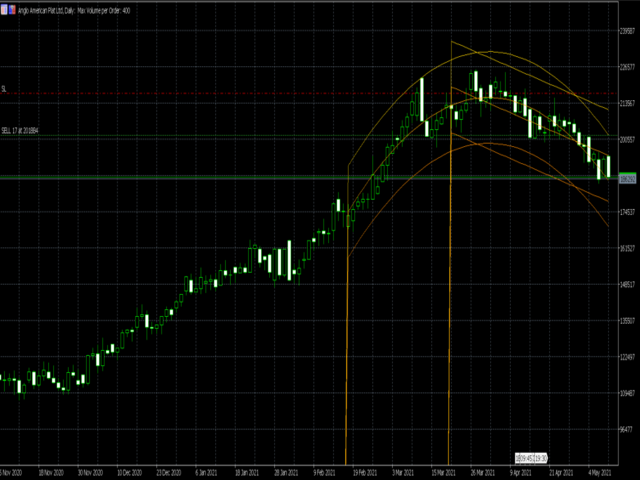
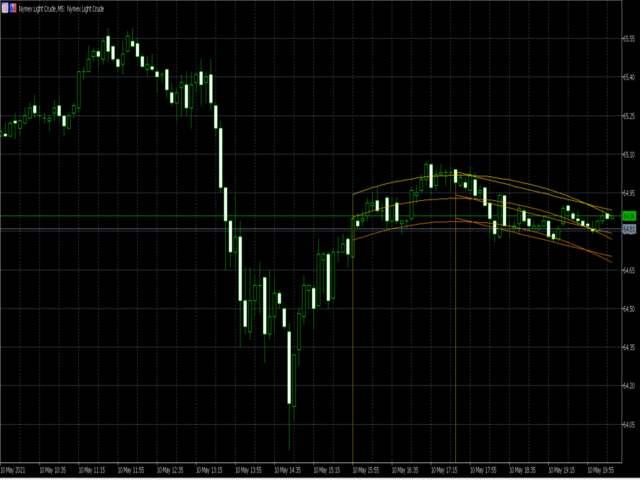
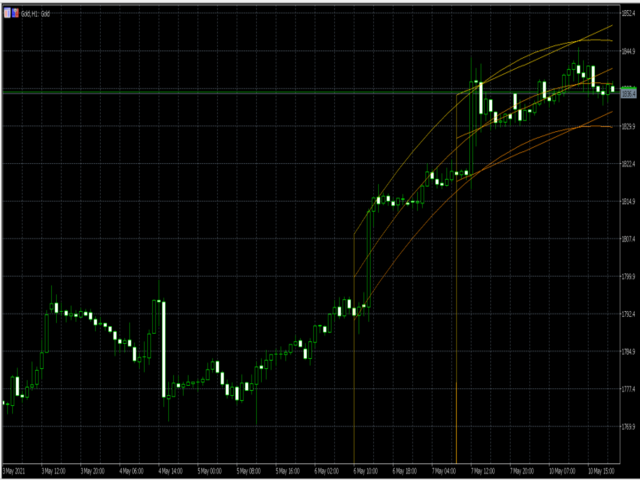
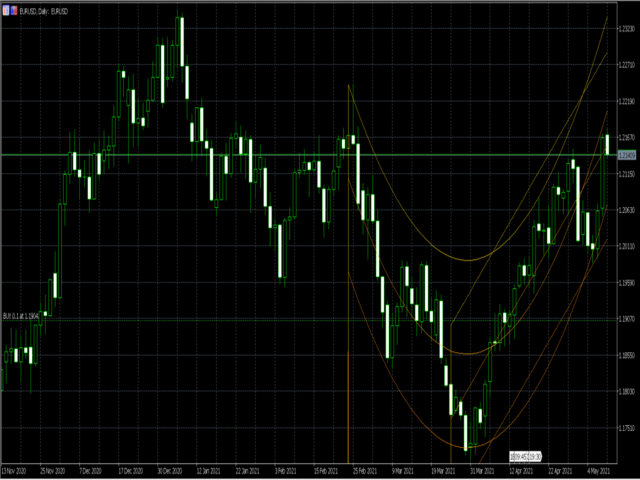
Automatic Trend Line Fit.

This indicator automatically plots the straight line and parabolic (curved) trend to any symbol at any timeframe. The plotted straight line is a good indication of the current trend and the curved line is an indication of a change momentum or change in the current trend.

Plotting the straight line over about 2/3 the number of candles as the curved line is usually a good way to determine entry and exit points as it shows the current trend and momentum of the market.

This indicator also gives the option of plotting a channel around both the straight line and curved line for more well timed entry and exit points. This channel is set at a multiple of the ATR above and below the trend lines. 

The inputs required are the number of candles to fit the curved line to (numCurve), the number of candles to fit the straight line to (numStraight) and the ATR multiple to set the channel lines (ATRBounds).

İncelemeler 4
Brendan Wayne King
567
Brendan Wayne King 2023.02.10 12:18 
 

I use this on all my charts, great to quickly get the channels mapped out. Good work

Pavel048
298
Pavel048 2022.03.17 11:21 
 

Я назвал его "Штакетник" за стойку с тремя полками. Что я могу сказать, первоначальное впечатление очень хорошее. Буду тестировать дальше.

Nicoletto
210
Nicoletto 2022.01.09 09:07 
 

Muy bueno, gracias.

Önerilen ürünler
Free automatic Fibonacci is an indicator that automatically plots a Fibonacci retracement based on the number of bars you select on the BarsToScan setting in the indicator. The Fibonacci is automatically updated in real time as new highest and lowest values appears amongst the selected bars. You can select which level values to be displayed in the indicator settings. You can also select the color of the levels thus enabling the trader to be able to attach the indicator several times with differe
FREE
Donchian Pro
Paulo Henrique Faquineli Garcia
5 (2)
The Donchian Channel Channels are among the most popular tools of technical analysis, as they visually convey to the analyst the limits within which most price movement tends to occur. Channel users know that valuable information can be obtained at any time, whether prices are in the central region of a band or close to one of the border lines. One of the best known techniques to explore these concepts is Bollinger Bands. However, John Bollinger was not the only one to research the applicatio
FREE
Important Lines
Terence Gronowski
4.88 (26)
This indicator displays Pivot-Lines, preday high and low, preday close and the minimum and maximum of the previous hour. You just have to put this single indicator to the chart to have all these important lines, no need to setup many single indicators. Why certain lines are important Preday high and low : These are watched by traders who trade in a daily chart. Very often, if price climbs over or falls under a preday low/high there is an acceleration in buying/selling. It is a breakout out of
FREE
High Low Open Close
Alexandre Borela
4.97 (35)
Bu projeyi seviyorsanız, 5 yıldız incelemesi bırakın. instagram'da izleyin: borelatech Bu gösterge açık, yüksek, düşük ve belirtilen fiyatlar için çizer Dönem ve belirli bir zaman bölgesi için ayarlanabilir. Bunlar birçok kurumsal ve profesyonel tarafından görünen önemli seviyelerdir. tüccarlar ve daha fazla olabileceği yerleri bilmeniz için yararlı olabilir Aktif. Mevcut dönemler şunlardır: Önceki gün. Önceki Hafta. Önceki Ay. Previous Quarter. Önceki yıl. Veya: Mevcut gün. Hafta. Şimdi Ay.
FREE
"Hunttern harmonic pattern finder" base on the dynamic zigzag with the notification and prediction mode This version of the indicator identifies 11 harmonic patterns and predicts them in real-time before they are completely formed. It offers the ability to calculate the error rate of Zigzag patterns depending on a risk threshold. It moreover sends out a notification once the pattern is complete. The supported patterns: ABCD BAT ALT BAT BUTTERFLY GARTLEY CRAB DEEP CRAB CYPHER SHARK THREE
FREE
What is this indicator? This indicator is the RSI (Relative Strength Index) supporting Virtual Trading mode of  Knots Compositor . When the mode is turned on, the indicator will be recalculated based on the displayed candlesticks. When the mode is turned off, the indicator will be recalculated based on the original chart candlesticks. Types of the applied price - Close - Open - High - Low - Median Price (HL/2) - Typical Price (HLC/3) - Weighted Price (HLCC/4) KC-Indicators -   KC-MA   (M
FREE
The idea of the system is to indentify the reversal patterns using the calculation of the composite candle. The reversal patterns is similar to the "Hammer" and "Hanging Man" patterns in Japanese candlestick analysis. But it uses the composite candle instead the single candle and doesn't need the small body of the composite candle to confirm the reversal. Input parameters: Range - maximal number of bars, used in the calculation of the composite candle. Minimum - minimal size of the composite can
FREE
LT Donchian Channel
Thiago Duarte
4.75 (4)
Donchian Channel is an indicator created by Richard Donchian. It is formed by taking the highest high and the lowest low of the last specified period in candles. The area between high and low is the channel for the chosen period. Its configuration is simple. It is possible to have the average between the upper and lower lines, plus you have alerts when price hits one side. If you have any questions or find any bugs, please contact me. Enjoy!
FREE
Aggression Volume
Flavio Javier Jarabeck
3.8 (20)
Aggression Volume Indicator is the kind of indicator that is rarely found in the MQL5 community because it is not based on the standard Volume data provided by the Metatrader 5 platform. It requires the scrutiny of all traffic Ticks requested on the platform... That said, Aggression Volume indicator requests all Tick Data from your Broker and processes it to build a very special version of a Volume Indicator, where Buyers and Sellers aggressions are plotted in a form of Histogram. Additionally,
FREE
Follow The Line MT5
Oliver Gideon Amofa Appiah
4.4 (30)
This indicator obeys the popular maxim that: "THE TREND IS YOUR FRIEND" It paints a GREEN line for BUY and also paints a RED line for SELL. (you can change the colors). It gives alarms and alerts of all kinds. IT DOES NOT REPAINT and can be used for all currency pairs and timeframes. Yes, as easy and simple as that. Even a newbie can use it to make great and reliable trades. NB: For best results, get my other premium indicators for more powerful and reliable signals. Get them here: https://www.m
FREE
What is this indicator? This indicator is the MACD (Moving Average Convergence/Divergence) supporting Virtual Trading mode of  Knots Compositor . When the mode is turned on, the indicator will be recalculated based on the displayed candlesticks. When the mode is turned off, the indicator will be recalculated based on the original chart candlesticks. Types of the applied price - Close - Open - High - Low - Median Price (HL/2) - Typical Price (HLC/3) - Weighted Price (HLCC/4) KC-Indicators
FREE
Easy GOLD MT5
Franck Martin
4.67 (6)
Easy Gold is the latest addition to the BotGPT family. It is surprising and very powerful. It is ideal for beginners due to its simplicity.  There is absolutely nothing to do, it's 100% automated, simply indicate the percentage of risk you want to take per trade and the EA is ready. Whatever your capital, the EA takes care of everything. Optimized on (XAUUSD).  Unleash all the power with the professional version (AGI Gold) and its connection to the neural network, available in my store. My othe
FREE
Pivot Point Fibo RSJ, Fibonacci oranlarını kullanarak günün destek ve direnç çizgilerini izleyen bir göstergedir. Bu muhteşem gösterge, Fibonacci oranlarını kullanarak Pivot Point üzerinden 7 seviyeye kadar destek ve direnç oluşturur. Fiyatların, bir operasyonun olası giriş/çıkış noktalarını algılamanın mümkün olduğu bu destek ve direncin her bir düzeyine uyması harika. Özellikleri 7 seviyeye kadar destek ve 7 seviye direnç Seviyelerin renklerini ayrı ayrı ayarlayın Girişler Pivot Tipi
FREE
Fiyat Dalga Modeli   MT5 --(ABCD Modeli)--   hoş geldiniz ABCD modeli, teknik analiz dünyasında güçlü ve yaygın olarak kullanılan bir ticaret modelidir. Tüccarların piyasadaki potansiyel alım ve satım fırsatlarını belirlemek için kullandıkları uyumlu bir fiyat modelidir. ABCD modeliyle, tüccarlar potansiyel fiyat hareketlerini tahmin edebilir ve alım satımlara ne zaman girip çıkacakları konusunda bilinçli kararlar verebilir. EA Sürümü: Price Wave  EA MT5 MT4 Sürümü :   Price Wave Pattern
FREE
Period separators
Mykola Demko
4.56 (9)
The Period separators indicator separates time periods, specified by user. It supports all timeframes, greater or aliquot to current timeframe. In case of the incorect timeframe, the indicator modifies it to closest correct value. Additional bonus - the separation of non-standard time periods - MOON, MOON/2, MOON/4 (moon phases). The separators are plotted using the indicator's buffers. The indicator uses one graphic object for information about the progress and current bar properties. The grap
FREE
Are you tired of drawing trendlines every time you're analyzing charts? Or perhaps you would like more consistency in your technical analysis. Then this is for you. This indicator will draw trend lines automatically when dropped on a chart. How it works Works similar to standard deviation channel found on mt4 and mt5. It has 2 parameters: 1. Starting Bar 2. Number of bars for calculation The   starting bar   is the bar which drawing of the trend lines will begin, while the   number of bars for c
FREE
Description. The basis for the formation of the Renko chart is the price range. If the price goes beyond its limits, the chart shows a box above or below the previous one. As a result, we see price movement without additional "noise" and important support and resistance levels. Features. For use in conjunction with the Expert Advisor, an additional buffer is implemented-a box counter. For convenience and to increase the speed of testing, the user can use the "new box" event, which the indicato
FREE
MIDAS Super VWAP
Flavio Javier Jarabeck
4.29 (14)
Imagine VWAP, MVWAP and MIDAS in one place... Well, you found it! Now you can track the movement of Big Players in various ways, as they in general pursue the benchmarks related to this measuring, gauging if they had good execution or poor execution on their orders. Traders and analysts use the VWAP to eliminate the noise that occurs throughout the day, so they can measure what prices buyers and sellers are really trading. VWAP gives traders insight into how a stock trades for that day and deter
FREE
The indicator identifies when a divergence occurs between price and an indicator or oscillator. It identifies both regular and hidden divergences. Combined with your own rules and techniques, this indicator will allow you to create (or enhance) your own powerful system. Features Can detect divergences for the following oscillators/indicators:   MACD, OsMA, Stochastics, RSI, CCI, RVI, Awesome, ADX, ATR, OBV, Composite index, MFI and Momentum. Only one oscillator/indicator can be selected. Draws
FREE
PZ Penta O MT5
PZ TRADING SLU
4 (6)
The Penta-O is a 6-point retracement harmonacci pattern which usually precedes big market movements. Penta-O patterns can expand and repaint quite a bit. To make things easier this indicator implements a twist: it waits for a donchian breakout in the right direction before signaling the trade. The end result is an otherwise repainting indicator with a very reliable trading signal. The donchian breakout period is entered as an input. [ Installation Guide | Update Guide | Troubleshooting | FAQ | A
FREE
Dual RSI
Paul Conrad Carlson
Indicator alerts for Dual Relative strength index rsi. Large rsi preset at 14 is below 30 small rsi preset at 4 is below 10 for buy bullish signals . Large rsi preset are 14 is above 70 small rsi preset at 4 is above 90 for sell bearish signals . Includes mobile and terminal alerts. draws lines when alerts. This indicator can help identify extremes and then the tops or bottoms of those extremes .
FREE
Show Pips for MT5
Roman Podpora
4.59 (17)
This information indicator will be useful for those who always want to be aware of the current situation on the account. - More useful indicators The indicator displays data such as profit in points, percentage and currency, as well as the spread for the current pair and the time until the bar closes on the current timeframe. There are several options for placing the information line on the chart: - To the right of the price (runs behind the price); - As a comment (in the upper left corner
FREE
PZ Pivot Points MT5
PZ TRADING SLU
4.95 (22)
This indicator displays pivot points in the chart, including historical vales, and supports many calculation modes for Pivot Points and S/R levels. [ Installation Guide | Update Guide | Troubleshooting | FAQ | All Products ] It plots historical levels for backtesting purposes It allows you to select the reference timeframe It implements different Pivot Point calculation modes It implements different SR calculation modes It implements customizable colors and sizes Calculation Modes The indi
FREE
ROMAN5 Time Breakout Indicator automatically draws the boxes for daily support and resistance breakouts. It helps the user identifying whether to buy or sell. It comes with an alert that will sound whenever a new signal appears. It also features an email facility. Your email address and SMTP Server settings should be specified in the settings window of the "Mailbox" tab in your MetaTrader 5. Blue arrow up = Buy. Red arrow down = Sell. You can use one of my Trailing Stop products that automatical
FREE
Cumulative Delta MT5
Evgeny Shevtsov
4.47 (57)
The indicator analyzes the volume scale and splits it into two components - seller volumes and buyer volumes, and also calculates the delta and cumulative delta. The indicator does not flicker or redraw, its calculation and plotting are performed fairly quickly, while using the data from the smaller (relative to the current) periods. The indicator operation modes can be switched using the Mode input variable: Buy - display only the buyer volumes. Sell - display only the seller volumes. BuySell -
FREE
ContiStat restricted - Free DEMO version of the ContiStat indicator Free version of the indicator is ment as DEMO of full paid version. Full functionality is available, however The indicator work only on M30 chart period . Find the ContiStat indicator for full functionality Brief description The ContiStat indicator calculate statistic frequency of green (up) and red (down) movement in the chart and determine movement dynamics (silver curve). There are two key parameters to understand the Conti
FREE
Value Chart Candlesticks
Flavio Javier Jarabeck
4.75 (8)
The idea of a Value Chart indicator was presented in the very good book I read back in 2020 , " Dynamic Trading Indicators: Winning with Value Charts and Price Action Profile ", from the authors Mark Helweg and David Stendahl. The idea is simple and the result is pure genius: Present candlestick Price analysis in a detrended way! HOW TO READ THIS INDICATOR Look for Overbought and Oversold levels. Of course, you will need to test the settings a lot to find the "correct" one for your approach.
FREE
This indicator is based on the Parabolic SAR indicator. It helps the user identifying whether to buy or sell. It comes with an alert that will sound whenever a new signal appears. It also features an email facility. Your email address and SMTP Server settings should be specified in the settings window of the "Mailbox" tab in your MetaTrader 5. Blue arrow up = Buy. Red arrow down = Sell. Line = Trailing Stop. You can use one of my Trailing Stop products that automatically move the Stop Loss and i
FREE
ADR ST Patterns Strategy
Vladimir Poltoratskiy
4.5 (4)
ADR ST Patterns Strategy  is a modification of the classical  ADR  indicator. This simple indicator corresponds to the parameters specified in the  ST Patterns Strategy ( https://stpatterns.com/ ) .  Structural Target Patterns represents the market consistently divided into components. No trend lines, geometric proportions of the model itself, trading volume, or open market interest are needed for the formation of  ST Patterns . They are easily recognized and built only on the basis of breaking
FREE
Heiken Ashi DA
Vitaly Dodonov
4.5 (2)
Что такое Heiken Ashi?    Heiken Ashi — это метод построения графиков, который можно использовать для прогнозирования будущего движения цены. Он похож на традиционные свечные графики. Однако в отличие от обычного свечного графика, график Heiken Ashi пытается отфильтровать часть рыночного шума для лучшего определения трендовых движений на рынке. Как рассчитать Heiken Ashi? Heiken Ashi использует формулу COHL, которая означает «Закрытие, Открытие, Максимум, Минимум». Это четыре компонента, кото
FREE
Bu ürünün alıcıları ayrıca şunları da satın alıyor
Atomic Analyst MT5
Issam Kassas
3.64 (11)
Öncelikle belirtmek gerekir ki bu Ticaret Göstergesi Yeniden Çizim Yapmaz, Gecikmez ve Gecikme Göstermez, bu da hem manuel hem de robot ticareti için ideal hale getirir. Atom Analisti, Piyasada Daha İyi Bir Avantaj Bulmak İçin Fiyatın Gücünü ve Momentumunu Kullanan PA Fiyat Hareketi Göstergesidir. Gürültüleri ve Yanlış Sinyalleri Kaldırmaya ve Ticaret Potansiyelini Artırmaya Yardımcı Olan Gelişmiş Filtrelerle Donatılmıştır. Birden fazla katmanlı karmaşık göstergeler kullanarak, Atom Analisti
Öncelikle, bu Ticaret Sistemi'nin Non-Repainting, Non-Redrawing ve Non-Lagging Göstergesi olduğunu vurgulamak önemlidir, bu da hem manuel hem de robot ticareti için ideal hale getirir. "Smart Trend Trading System MT5", yeni ve deneyimli tüccarlar için özelleştirilmiş kapsamlı bir ticaret çözümüdür. 10'dan fazla premium göstergeyi birleştiriyor ve 7'den fazla sağlam ticaret stratejisi sunuyor, bu da çeşitli piyasa koşulları için esnek bir seçim yapar. Trend Takip Stratejisi: Trendleri etkili bir
Quantum Trend Sniper
Bogdan Ion Puscasu
5 (37)
Tanıtım       Kuantum Trend Keskin Nişancı Göstergesi   , trend tersine dönmeleri belirleme ve ticaret yapma şeklinizi değiştiren çığır açan MQL5 Göstergesi! 13 yılı aşkın ticaret tecrübesine sahip deneyimli tüccarlardan oluşan bir ekip tarafından geliştirilmiştir.       Kuantum Trend Keskin Nişancı Göstergesi       trend dönüşlerini son derece yüksek doğrulukla belirlemenin yenilikçi yolu ile ticaret yolculuğunuzu yeni zirvelere taşımak için tasarlanmıştır. ***Kuantum Trend Keskin Nişancı Gö
Trend Screener Pro MT5
STE S.S.COMPANY
4.89 (61)
Trend Göstergesi, Trend Alım Satım ve Filtreleme için Çığır Açan Benzersiz Çözüm, Tüm Önemli Trend Özellikleriyle Tek Bir Araç İçinde Yerleştirildi! Forex, emtialar, kripto para birimleri, endeksler ve hisse senetleri gibi tüm sembollerde/araçlarda kullanılabilen %100 yeniden boyamayan çoklu zaman çerçevesi ve Çoklu para birimi göstergesidir. Trend Screener, grafikte noktalarla ok trend sinyalleri sağlayan etkili bir trend trend göstergesidir. Trend analizörü göstergesinde bulunan özellikler: 1.
Gold Stuff mt5
Vasiliy Strukov
4.88 (162)
Gold Stuff mt5, özellikle altın için tasarlanmış bir trend göstergesidir ve herhangi bir finansal enstrümanda da kullanılabilir. Gösterge yeniden çizilmez ve gecikmez. Önerilen zaman dilimi H1. Ayarları ve kişisel bir bonusu almak için satın alma işleminden hemen sonra benimle iletişime geçin!   AYARLAR Ok Çiz - açık kapalı. grafik üzerinde oklar çizmek. Uyarılar - sesli uyarılar kapalı. E-posta bildirimi - açık kapalı. E-posta Bildirimleri. Puch bildirimi - açık kapalı. Push bildirimleri
RelicusRoad Pro MT5
Relicus LLC
4.81 (21)
Şimdi 147 $ (birkaç güncellemeden sonra 499 $ 'a yükseliyor) - Sınırsız Hesaplar (PC'ler veya Mac'ler) RelicusRoad Kullanım Kılavuzu + Eğitim Videoları + Özel Discord Grubuna Erişim + VIP Durumu PİYASAYA BAKMAK İÇİN YENİ BİR YOL RelicusRoad, forex, vadeli işlemler, kripto para birimleri, hisse senetleri ve endeksler için dünyanın en güçlü ticaret göstergesidir ve yatırımcılara kârlı kalmaları için ihtiyaç duydukları tüm bilgileri ve araçları sağlar. Başlangıç ​​seviyesinden ileri seviyey
FX Volume MT5
Daniel Stein
4.94 (17)
Sabah Brifingimiz aracılığıyla ayrıntılar ve ekran görüntüleri ile günlük piyasa güncellemenizi alın burada mql5 ve on Telegram ! FX Volume, bir brokerin bakış açısından piyasa duyarlılığı hakkında GERÇEK bir fikir veren İLK ve TEK hacim göstergesidir. COT raporlarından çok daha hızlı bir şekilde, brokerlar gibi kurumsal piyasa katılımcılarının Forex piyasasında nasıl konumlandıklarına dair harika bilgiler sağlar. Bu bilgileri doğrudan grafiğinizde görmek, ticaretiniz için gerçek oyun değiştir
FX Power MT5 NG
Daniel Stein
5 (4)
Sabah Brifingimiz burada mql5 ve on Telegram! FX Power MT5 NG , uzun zamandır çok popüler olan döviz gücü ölçerimiz FX Power'ın yeni neslidir. Peki bu yeni nesil güç ölçer ne sunuyor? Orijinal FX Power hakkında sevdiğiniz her şey PLUS GOLD/XAU güç analizi Daha da hassas hesaplama sonuçları Ayrı ayrı yapılandırılabilir analiz dönemleri Daha da iyi performans için özelleştirilebilir hesaplama limiti Özel çokluDaha fazlasını görmek isteyenler için örnek ayarlar Her grafikte en sevdiğiniz renkler i
Öncelikle, bu Ticaret Aracının Non-Repainting, Non-Redrawing ve Non-Lagging Gösterge olduğunu vurgulamakta fayda var, bu da onu profesyonel ticaret için ideal hale getiriyor. Akıllı Fiyat Hareketi Kavramları Göstergesi, hem yeni hem de deneyimli tüccarlar için çok güçlü bir araçtır. İleri ticaret fikirlerini, Inner Circle Trader Analizi ve Smart Money Concepts Ticaret Stratejileri gibi 20'den fazla kullanışlı göstergeyi bir araya getirerek bir araya getirir. Bu gösterge, büyük kurumların tica
Advanced Supply Demand MT5
Bernhard Schweigert
4.53 (15)
Herhangi bir Acemi veya Uzman Tüccar için En İyi Çözüm! Bu gösterge benzersiz, yüksek kaliteli ve uygun fiyatlı bir ticaret aracıdır çünkü bir dizi tescilli özelliği ve yeni bir formülü bir araya getirdik. Bu güncelleme ile çift zaman dilimi dilimlerini gösterebileceksiniz. Yalnızca daha yüksek bir TF gösteremeyeceksiniz, aynı zamanda TF grafiğini ve ARTIK daha yüksek TF'yi de gösterebileceksiniz: YUVARLAK BÖLGELERİ GÖSTERMEK. Tüm Arz Talebi tüccarları buna bayılacak. :) Önemli Bilgiler Açıkland
The Volume by Price Indicator for MetaTrader 5 features Volume Profile and Market Profile TPO (Time Price Opportunity). Get valuable insights out of currencies, equities and commodities data. Gain an edge trading financial markets. Volume and TPO histogram bar and line charts. Volume Footprint charts. TPO letter and block marker charts including split structures. Versatile segmentation and compositing methods. Static, dynamic and flexible ranges with relative and/or absolute visualizations. Lay
XQ Indicator MetaTrader 5
Marzena Maria Szmit
5 (1)
Step into the realm of Forex trading with confidence and precision using XQ, a cutting-edge Forex indicator designed to elevate your trading game to unprecedented heights. Whether you're a seasoned trader or just stepping into the world of currency exchange, XQ Forex Indicator empowers you with the insights and signals needed to make informed trading decisions. The signal conditions are a combination of three indicators, and XQ Forex Indicator only display  medium and long-term trends . The ind
AW Trend Predictor MT5
AW Trading Software Limited
4.76 (54)
Tek bir sistemde trend ve kırılma seviyelerinin kombinasyonu. Gelişmiş bir gösterge algoritması piyasa gürültüsünü filtreler, trendi, giriş noktalarını ve olası çıkış seviyelerini belirler. Gösterge sinyalleri, sinyal geçmişinin etkinliğini gösteren en uygun enstrümanların seçilmesine izin veren bir istatistiksel modüle kaydedilir. Gösterge Kâr Al ve Zararı Durdur işaretlerini hesaplar. Kılavuz ve talimatlar ->   BURAYA   / MT4 versiyonu ->   BURAYA Gösterge ile nasıl ticaret yapılır: Trend Pre
Top indicator for MT5   providing accurate signals to enter a trade without repainting! It can be applied to any financial assets:   forex, cryptocurrencies, metals, stocks, indices .  Watch  the video  (6:22) with an example of processing only one signal that paid off the indicator! MT4 version is here It will provide pretty accurate trading signals and tell you when it's best to open a trade and close it. Most traders improve their trading results during the first trading week with the help of
Tanıtım       Quantum Breakout PRO   , Breakout Bölgeleri ile ticaret yapma şeklinizi değiştiren çığır açan MQL5 Göstergesi! 13 yılı aşkın ticaret tecrübesine sahip deneyimli tüccarlardan oluşan bir ekip tarafından geliştirilmiştir.       Kuantum Breakout PRO       yenilikçi ve dinamik koparma bölgesi stratejisiyle ticaret yolculuğunuzu yeni zirvelere taşımak için tasarlanmıştır. Kuantum Breakout Göstergesi, size 5 kar hedefi bölgesi ile kırılma bölgelerinde sinyal okları ve kırılma kutusuna
ICT, SMC, SMART MONEY CONCEPTS, SMART MONEY, Smart Money Concept, Support and Resistance, Trend Analysis, Price Action, Market Structure, Order Blocks, BOS/CHoCH,   Breaker Blocks ,  Momentum Shift,   Supply&Demand Zone/Order Blocks , Strong Imbalance,   HH/LL/HL/LH,    Fair Value Gap, FVG,  Premium  &   Discount   Zones, Fibonacci Retracement, OTE, Buy Side Liquidity, Sell Side Liquidity, BSL/SSL Taken, Equal Highs & Lows, MTF Dashboard, Multiple Time Frame, BigBar, HTF OB, HTF Market Structure
Auto Order Block with break of structure based on ICT and Smart Money Concepts Futures Break of Structure ( BoS )             Order block ( OB )            Higher time frame Order block / Point of Interest ( POI )    shown on current chart           Fair value Gap ( FVG ) / Imbalance   ,  MTF      ( Multi Time Frame )    Volume Imbalance     ,  MTF          vIMB Gap’s Equal High / Low’s     ,  MTF             EQH / EQL Liquidity               Current Day High / Low           HOD /
Fiyat tersine döndükçe ve geri çekildikçe piyasa yapısından elde edilen kâr değişir. Piyasa yapısını tersine çevirme uyarısı göstergesi, bir trendin veya fiyat hareketinin ne zaman tükenmeye yaklaştığını ve tersine dönmeye hazır olduğunu tanımlar. Genellikle bir geri dönüş veya büyük bir geri çekilme meydana gelmek üzereyken meydana gelen piyasa yapısındaki değişiklikler konusunda sizi uyarır. Gösterge, olası bir tükenme noktasının yakınında her yeni yüksek veya düşük oluştuğunda, başlangıçta
TPSpro TRENDPRO  - is a trend indicator that automatically analyzes the market and provides information about the trend and each of its changes, as well as giving signals for entering trades without redrawing! The indicator uses each candle, analyzing them separately. referring to different impulses - up or down impulse. Exact entry points into transactions for currencies, crypto, metals, stocks, indices!  -  Version MT4                  DETAILED DESCRIPTION        /       TRADING SETUPS       
TrendMaestro5
Stefano Frisetti
note: this indicator is for METATRADER4, if you want the version for METATRADER5 this is the link:  https://www.mql5.com/it/market/product/108106 TRENDMAESTRO recognizes a new TREND in the bud, he never makes mistakes. The certainty of identifying a new TREND is priceless. DESCRIPTION TRENDMAESTRO identifies a new TREND in the bud, this indicator examines the volatility, volumes and momentum to identify the moment in which there is an explosion of one or more of these data and therefore the mome
Owl Smart Levels MT5
Sergey Ermolov
4.47 (36)
MT4 versiyonu  |  FAQ Owl Smart Levels Indicator , Bill Williams'ın gelişmiş fraktalları , piyasanın doğru dalga yapısını oluşturan Valable ZigZag ve kesin giriş seviyelerini gösteren Fibonacci seviyeleri gibi popüler piyasa analiz araçlarını içeren tek gösterge içinde eksiksiz bir ticaret sistemidir. pazara ve kar elde edilecek yerlere. Stratejinin ayrıntılı açıklaması Gösterge ile çalışma talimatı Baykuş Yardımcısı ticaretinde Danışman Yardımcısı Kullanıcıların özel sohbeti -> Satın aldıktan
Quantum Heiken Ashi PRO MT5
Bogdan Ion Puscasu
4.5 (8)
Quantum Heiken Ashi PRO ile   tanışın Pazar eğilimleri hakkında net bilgiler sağlamak üzere tasarlanan Heiken Ashi mumları, gürültüyü filtreleme ve yanlış sinyalleri ortadan kaldırma yetenekleriyle ünlüdür. Kafa karıştırıcı fiyat dalgalanmalarına veda edin ve daha sorunsuz, daha güvenilir bir grafik sunumuna merhaba deyin. Quantum Heiken Ashi PRO'yu gerçekten benzersiz kılan şey, geleneksel şamdan verilerini okunması kolay renkli çubuklara dönüştüren yenilikçi formülüdür. Kırmızı ve yeşil çubukl
IX Power MT5
Daniel Stein
5 (2)
IX Power   nihayet FX Power'ın rakipsiz hassasiyetini Forex dışı sembollere getiriyor. En sevdiğiniz endeksler, hisse senetleri, emtialar, ETF'ler ve hatta kripto para birimlerindeki kısa, orta ve uzun vadeli eğilimlerin yoğunluğunu doğru bir şekilde belirler. Terminalinizin sunduğu   her şeyi analiz   edebilirsiniz. Deneyin ve işlem yaparken   zamanlamanızın   nasıl   önemli ölçüde iyileştiğini   deneyimleyin. IX Power Temel Özellikler 100 hassas, yeniden boyanmayan hesaplama sonuçları -
TrendDecoder Premium MT5
Christophe, Pa Trouillas
5 (1)
Aralıkları ve bir sonraki olası hamleleri belirleyin     |    Trendlerin en erken sinyallerini ve gücünü alın     |    Geri dönüşten önce net çıkışlar alın     |    Fiyatın test edeceği Fibo seviyelerini tespit edin   |  Gecikmesiz, takip edilmeyen gösterge - manuel ve otomatik ticaret için ideal - tüm varlıklar ve tüm zaman birimleri için uygun 50 İNDİRİM   - lansman için sonra tekrar   >>   149 $ Satın aldıktan sonra, kişiselleştirilmiş ayarlar için   bu kanaldan benimle iletişime geçin . MT4
Gartley Hunter Multi
Siarhei Vashchylka
5 (5)
Gartley Hunter Multi - An indicator for searching for harmonic patterns simultaneously on dozens of trading instruments and on all classic timeframes: (m1, m5, m15, m30, H1, H4, D1, Wk, Mn). Manual (Be sure to read before purchasing) | Version for MT4 Advantages 1. Patterns: Gartley, Butterfly, Shark, Crab. Bat, Alternate Bat, Deep Crab, Cypher 2. Simultaneous search for patterns on dozens of trading instruments and on all classic timeframes 3. Search for patterns of all possible sizes. Fr
TrendLine PRO MT5
Evgenii Aksenov
4.78 (49)
The Trend Line PRO indicator is an independent trading strategy. It shows the trend change, the entry point to the transaction, as well as automatically calculates three levels of Take Profit and Stop Loss protection Trend Line PRO is perfect for all Meta Trader symbols: currencies, metals, cryptocurrencies, stocks and indices Advantages of Trend Line PRO Never redraws its signals The possibility of using it as an independent strategy It has three automatic levels Take Profit and Stop Loss lev
Was: $249  Now: $99   Market Profile defines a number of day types that can help the trader to determine market behaviour. A key feature is the Value Area, representing the range of price action where 70% of trading took place. Understanding the Value Area can give traders valuable insight into market direction and establish the higher odds trade. It is an excellent addition to any system you may be using. Inspired by Jim Dalton’s book “Mind Over Markets”, this indicator is designed to suit the
Golden Spikes Detector
Batsirayi L Marango
5 (1)
Golden Spikes Detector This indicator is based on an advanced strategy primarily for trading spikes on Boom and Crash Indices. Complex algorithms were implemented to detect high probability entries only. It alerts on potential Buy and Sell entries. To trade spikes on the Deriv or Binary broker, only take Buy Boom and Sell Cash alerts. It was optimised to be loaded on 5-minute timeframe although multiple timeframe analysis is done in the background. Features ·             Desktop pop up and sound
Matrix Arrow Indicator MT5
Juvenille Emperor Limited
5 (14)
Matrix Arrow Indicator MT5 ,   forex ,   emtialar ,   kripto   para birimleri ,   endeksler ,   hisse senetleri   gibi tüm sembollerde/araçlarda kullanılabilen   %100 yeniden boyamayan   çoklu zaman çerçevesi göstergesini izleyen benzersiz bir 10'u 1 arada trenddir.  Matrix Arrow Indicator MT5 , mevcut eğilimi erken aşamalarında belirleyecek ve aşağıdakiler gibi 10'a kadar standart göstergeden bilgi ve veri toplayacaktır: Ortalama Yönlü Hareket Endeksi (ADX) Emtia Kanal Endeksi (CCI) Klasik Hei
Blahtech Supply Demand MT5
Blahtech Limited
4.57 (14)
Was: $299  Now: $99   Supply Demand uses previous price action to identify potential imbalances between buyers and sellers. The key is to identify the better odds zones, not just the untouched ones. Blahtech Supply Demand indicator delivers functionality previously unavailable on any trading platform. This 4-in-1 indicator not only highlights the higher probability zones using a multi-criteria strength engine, but also combines it with multi-timeframe trend analysis, previously confirmed swings
Yazarın diğer ürünleri
Auto Fib Retracements
Ross Adam Langlands Nelson
4.33 (6)
Automatic Fibonacci Retracement Line Indicator. This indicator takes the current trend and if possible draws Fibonacci retracement lines from the swing until the current price. The Fibonacci levels used are: 0%, 23.6%, 38.2%, 50%, 61.8%, 76.4%, 100%. This indicator works for all charts over all timeframes. The Fibonacci levels are also recorded in buffers for use by other trading bots. Any comments, concerns or additional feature requirements are welcome and will be addressed promptly. 
FREE
Bollinger Band Scalper EA This EA opens trades when the price hits and bounces off the Bollinger Bands, it closes the trade when it reaches the opposite Bollinger band or if the price reverses into the trailing stoploss. Posisitions are sized dynamically depending on the user's account balance. The EA waits for the price to cross the Bollinger Band and then opens a market order at a set percentage of the bandwidth from the band chosen by the user. The position is sized a percentage of the user's
Channel Creator
Ross Adam Langlands Nelson
The auto-channel indicator creates a top line and bottom line that encloses a channel within which the symbol has been trading.  The channel is created by finding high points for the top line and low points for the bottom line, these points are shown with arrows. A line of best fit is then plotted through these points and extended until the end of the chart. This indicator is useful for trading both within the channel and for breakouts. Inputs: MAPeriod - The moving average period over which the
Auto Channel Trader
Ross Adam Langlands Nelson
The Auto Channel Trader creates a channel by plotting a line along the high points and low points of the chart, the EA then makes long trades near the bottom of the channel and short trades near the top of the channel. The channel is created by finding high points for the top line and low points for the bottom line, these points are shown with arrows. A line of best fit is then plotted through these points and extended until the end of the chart.  The length of the channel is determined by the M
Filtrele:
Brendan Wayne King
567
Brendan Wayne King 2023.02.10 12:18 
 

I use this on all my charts, great to quickly get the channels mapped out. Good work

gescobar
97
gescobar 2022.06.29 10:40 
 

Buen indicador. gracias

Pavel048
298
Pavel048 2022.03.17 11:21 
 

Я назвал его "Штакетник" за стойку с тремя полками. Что я могу сказать, первоначальное впечатление очень хорошее. Буду тестировать дальше.

Nicoletto
210
Nicoletto 2022.01.09 09:07 
 

Muy bueno, gracias.

İncelemeye yanıt