TheStrat FTFC
- Göstergeler
- Robert Gerald Wood
- Sürüm: 1.2
- Güncellendi: 16 Haziran 2021
- Etkinleştirmeler: 5
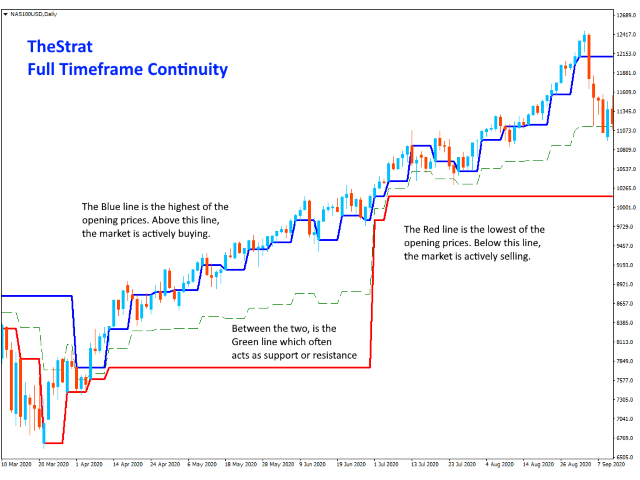
FTFC, Rob Smith'in The Strat tarafından tanımlandığı şekliyle Tam Zaman Çerçevesi Sürekliliği anlamına gelir.
Bu gösterge grafikte iki çizgi çizer; Üç Aylık, Aylık, Haftalık, Günlük veya Saatlik açılış seviyelerinin en yükseği ve bu değerlerin en küçüğünün ikincisi. Bu size, ticaretin tek yönde çok güçlü olma olasılığının daha yüksek olduğu bir kanal verir. Satırlar arasında fiyat hareketi daha dalgalı olacak ve daha geniş stoplar kullanabilirsiniz.
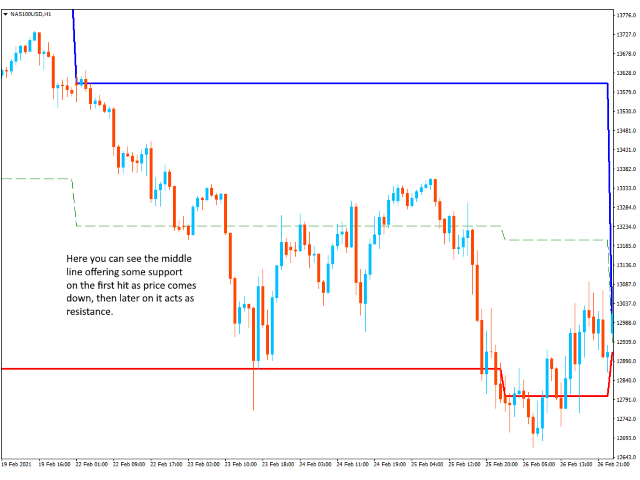
Yüksekler ve alçaklar arasındaki orta noktayı göstermek için üçüncü bir kesikli çizgi de çizilir. Piyasa fiyatı belirli bir yöne çekmeye çalışırken, burası genellikle destek veya direnç bulmak için iyi bir yerdir. Rengi HİÇBİRİ olarak ayarlayarak seçerseniz bu çizgi kapatılabilir.
AYARLAR
Üç Aylık Seviyeyi Dahil Et
Bazı insanlar görmezden gelmeyi tercih ettiğinden, Üç Aylık açık fiyatı hesaplamaya dahil etmeyi seçmenize olanak tanır.
DahilMevcutZaman ÇerçevesiAçık
Doğru olduğunda, o anda görüntülenen zaman çerçevesi H1, D1, W1 veya MN1 ise gösterge, hesaplamasında açık olan periyotları içerecektir. Bu, göstergenin en son sürümündeki yeni bir ayardır. Önceden, hesaplama şu anki açık dönemi İÇERMEZ ve bu TheStrat ile aynı fikirde değildir.
Ayar, varsayılan olarak yanlıştır, bu nedenle mevcut kullanıcılar, açmayı seçmedikleri sürece etkilenmezler.
MaxMilliSaniyeHesaplanacak
Çok fazla geçmiş yüklü (10.000 çubuğun üzerinde) grafikler için bu, göstergenin başlatılması gereken süreyi sınırlayacaktır. Varsayılan olarak ayar 1500 milisaniyedir, yani 1,5 saniyedir. Gösterge, bu süreden sonra tarihi çubuklar için tüm hesaplamalarını yapmayı başaramazsa, denemekten vazgeçecektir. Bu, her zaman önemli bir geçmiş alacağınız anlamına gelir, ancak bunun grafiğinizin durmasına neden olmayacağından emin olabilirsiniz.