• Genel bakış
  • İncelemeler (1)
  • Yorumlar (3)
  • Yenilikler

VPO Profile MT5

5

Definition :

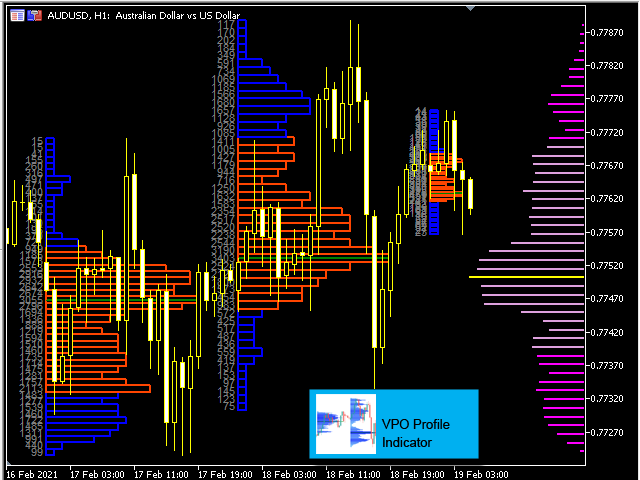
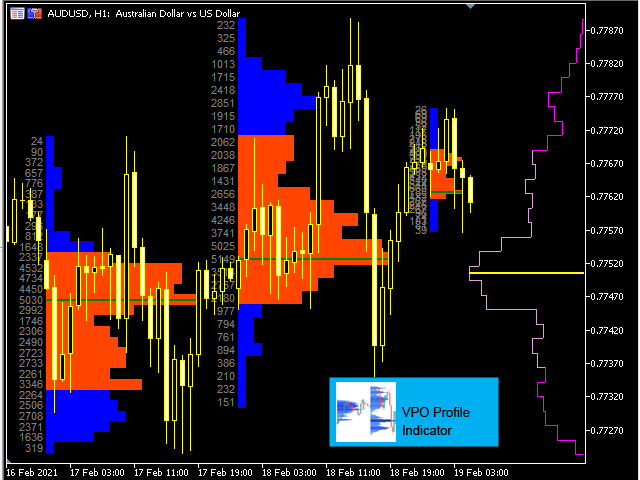
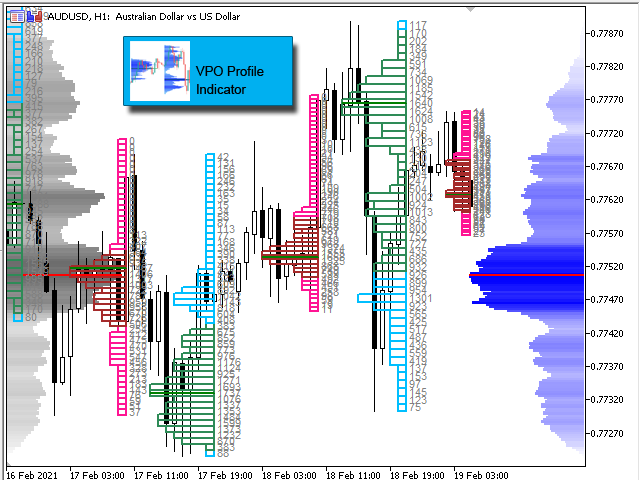
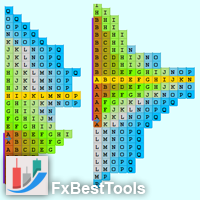
VPO is a Volume Price Opportunity. Instead of using bars or candles with an Open, High, Low, and Close price, each "bar" in a Market Profile is represented by horizontal bars against the price It is called Market Profile terminology.
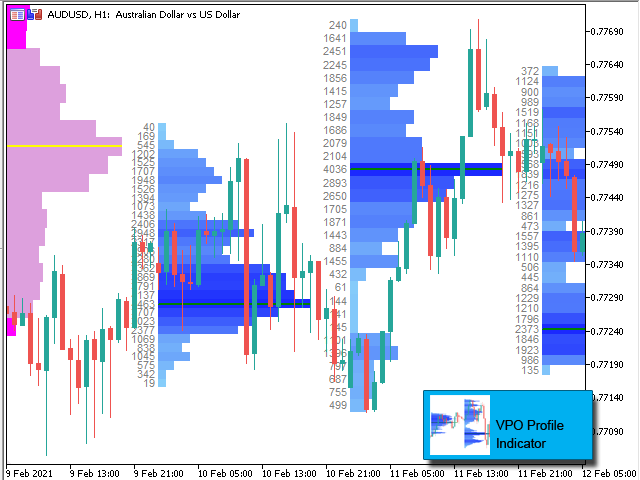
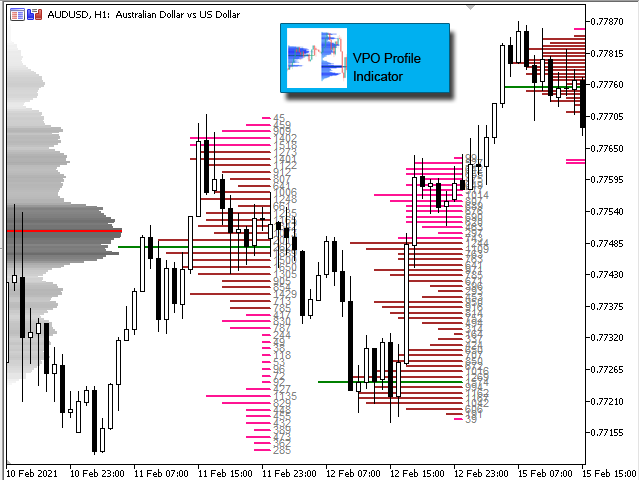
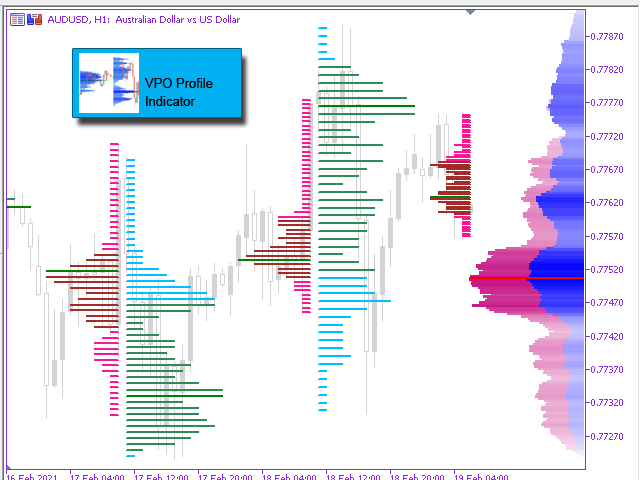
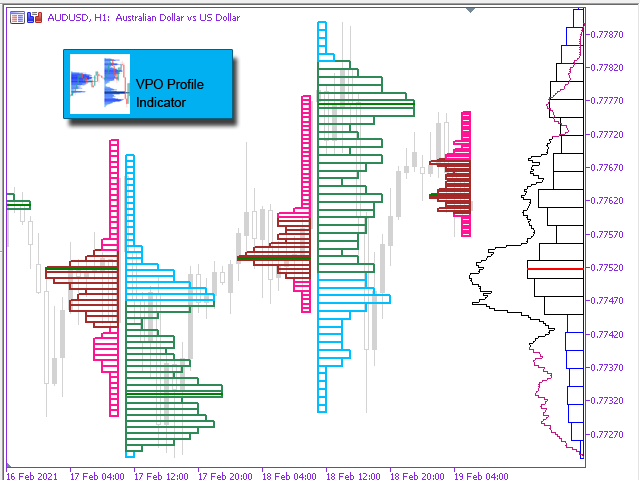
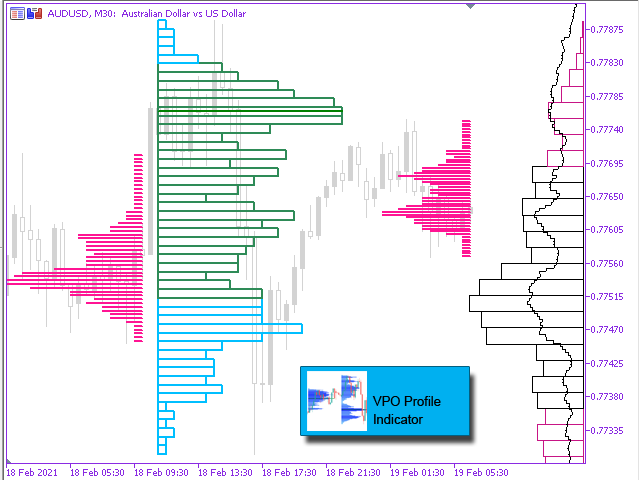
In other words volume-price-opportunity (VPO) profiles are histograms of how many volumes were traded at each price within the span of the profile.
By using a VPO chart, you are able to analyze the amount of trading activity, based on volume, for each price level the market traded at for any given time period. The VPO Profile Chart study allows you to clearly see the areas where the market is trading with the max volumes.

The indicator can help determine Support-Resistance levels.


Inputs :

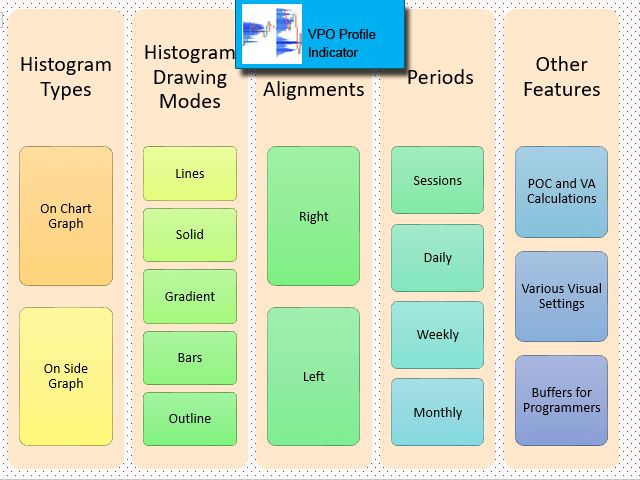
  • On Chart Profile Options
    • Enable/Disable
    • Volumes : Tick/Real Volumes
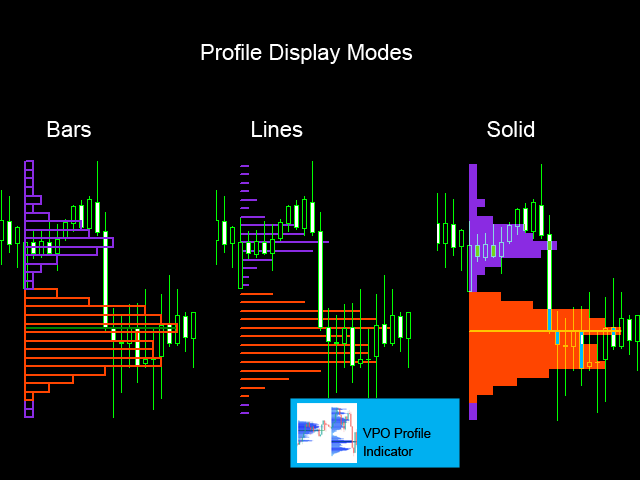
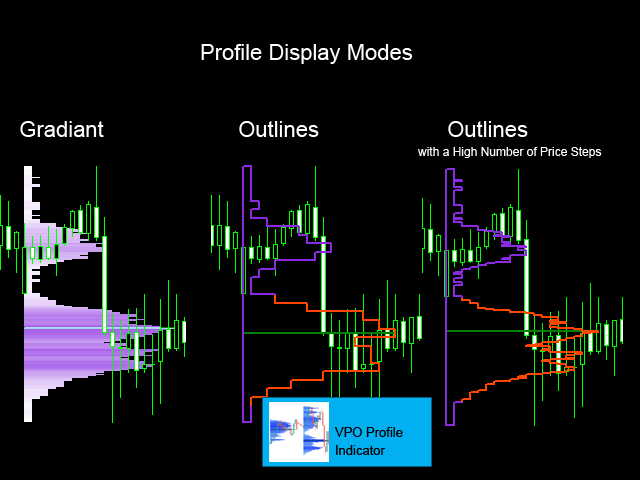
    • Profile Display Mode : Lines/Solid/Gradient/Bars/OutLine
    • Profile Alignment : Right/Left
    • Profile Periods : Session/Daily/Weekly/Monthly
    • Show Volume Text : Enable Text of Volumes
    • Number of Price Steps : Number of horizontal divisions of profile
    • VA Percentage : Percentage of Value Area
    • Number of Profiles (Sessions)
    • Session Start Time
    • Session End Time
  • On Side Profile Options
    • Enable/Disable
    • Volumes : Tick/Real Volumes
    • Profile Display Mode : Lines/Solid/Gradient/Bars/OutLine
    • Profile Alignment : Right/Left
    • Number of Days : Number of days included in profile calculation
    • Number of Price Steps : Number of horizontal divisions of profile
    • VA Percentage : Percentage of Value Area
    • Profile Size (% of Chart Width)
  • Visual Settings
    • On Chart Profile Color
    • On Chart Profile Back Color (for Gradient)
    • On Chart Profile Draw VA
    • On Chart Profile VA Color
    • On Chart Profile Draw POC
    • On Chart Profile POC Color
    • On Chart Profile POC Thickness
    • On Chart Profile Text Color
    • On Chart Profile Text Font Size
    • On Chart Profile Longitudinal Scale (%)
    • On Side Profile Color
    • On Side Profile Back Color (for Gradient)
    • On Side Profile Draw VA
    • On Side Profile VA Color
    • On Side Profile Draw POC
    • On Side Profile POC Color
    • On Side Profile POC Thickness

Buffers for programmers :

Manual of using buffers.


    Tips :

    • You can attach more than one indicator to a chart with different settings in these cases :
      • If you want multiple sessions on a day,
      • If you want both right and left on side histograms on a chart,
      • If you want 2 or more histograms overlapping each other.


    We are ready to help you for using the EA, Please don't hesitate to contact us.
    Visit our other useful utilities, Indicators and experts here.


    İncelemeler 1
    Florian Schaal
    28
    Florian Schaal 2023.07.16 11:35 
     

    Nice indicator, works with ticks on forex and real volume on others (didnt check yet). Recommended!

    Önerilen ürünler
    A "Volume Profile" is an advanced charting indicator that displays total volume traded at every price level over a user specified time period. The main components of the volume profile are POC ( Point Of Control - the price level, at which the maximum number of contracts were executed during a selected period), VAH ( Value Area High - the highest price in the Value Area) and VAL ( Value Area Low - the lowest price in the Value Area). When we settled on the original indicator, we spent a lot o
    150 USD
    Was: $249    Now: $149   Market Profile defines a number of day types that can help the trader to determine market behaviour. A key feature is the Value Area, representing the range of price action where 70% of trading took place. Understanding the Value Area can give traders valuable insight into market direction and establish the higher odds trade. It is an excellent addition to any system you may be using. Blahtech Limited presents their Market Profile indicator for the MetaTrader community.
    149 USD
    This indicator allows you to enjoy the two most popular products for analyzing request volumes and market deals at a favorable price: Actual Depth of Market Chart Actual Tick Footprint Volume Chart This product combines the power of both indicators and is provided as a single file. The functionality of Actual COMBO Depth of Market AND Tick Volume Chart is fully identical to the original indicators. You will enjoy the power of these two products combined into the single super-indicator! Below is
    40 USD
    Bu gösterge, bir gün içindeki en büyük ticaret faaliyetinin zamanını belirlemek için tasarlanmıştır. Bu hesaplamadan sonra, gösterge en önemli ticaret seviyelerini oluşturur. Bu seviyeleri fiili fiyat hareketiyle karşılaştırmak, piyasa eğilimlerinin gücü ve yönü hakkında bilgi sağlayabilir. Göstergenin özellikleri Zaman çerçevesi D1'in altında olmalıdır. Önerilen zaman dilimleri: M15, M30 ve H1. H1'in üzerindeki zaman dilimleri çok kaba bir resim verebilir. Ve M15'in altındaki zaman dilimleri
    30 USD
    BoxChart MT5
    Evgeny Shevtsov
    5 (6)
    The market is unfair if only because 10% of participants manage 90% of funds. An ordinary trader has slim changes to stand against these "vultures". This problem can be solved. You just need to be among these 10%, learn to predict their intentions and move with them. Volume is the only preemptive factor that faultlessly works on any timeframe and symbol. First, the volume appears and is accumulated, and only then the price moves. The price moves from one volume to another. Areas of volume accumu
    33 USD
    Market profile was developed by Peter Steidlmayer in the second half of last century. This is a very effective tool if you understand the nature and usage. It's not like common tools like EMA, RSI, MACD or Bollinger Bands. It operates independently of price, not based on price but its core is volume. The volume is normal, as the instrument is sung everywhere. But the special thing here is that the Market Profile represents the volume at each price level. 1. Price Histogram The Price Histogram
    50 USD
    The Volume by Price Indicator for MetaTrader 5 features Volume Profile and Market Profile TPO (Time Price Opportunity). Get valuable insights out of currencies, equities and commodities data. Gain an edge trading financial markets. Volume and TPO histogram bar, line and metric charts. TPO letter and block marker charts including split structures. Positioning and styling options to suit the user's needs and context. Volume Profile and Market Profile TPO Point of Control (VPOC and TPOC), Imbalanc
    259 USD
    Volume Profile V6
    Andrey Kolesnik
    4.5 (2)
    Market volume profile indicator.  It works on almost all instruments - currency pairs, stocks, futures, on real volumes and on ticks.  It can be set as automatic determination of the range of building a profile, for example, for a week or a month, etc.  and set the range manually by moving the borders (two vertical lines red and blue).  Shown as a bar graph.  The width of the histogram at a given level means, conventionally, the number of trades made on it.  With the "Mode level line color" para
    30 USD
    This indicator is a conventional analytical tool for tick volumes changes. It calculates tick volumes for buys and sells separately, and their delta on every bar, and displays volumes by price clusters (cells) within a specified bar (usually the latest one). The algorithm used internally is the same as in the indicator VolumeDeltaMT5 , but results are shown as cumulative volume delta bars (candlesticks). Analogous indicator for MetaTrader 4 exists - CumulativeDeltaBars . This is a limited substi
    30 USD
    Multicurrency and multitimeframe modification of the Relative Strength Index (RSI) indicator. You can specify any desired currencies and timeframes in the parameters. Also, the panel can send notifications when crossing overbought and oversold levels. By clicking on a cell with a period, this symbol and period will be opened. This is MTF Scanner. The key to hide the dashboard from the chart is "D" by default. Similar to the Currency Strenghth Meter, the Dashboard can automatically select pairs
    37.50 USD
    The balance of supply and demand is a simple and effective market analysis method. The supply and demand diagram can show you in advance, even before the trend reversal, where the supply ends and the demand is already emerging, where the demand ends and the supply is emerging, while substantially increasing the probability of making a deal in the right direction and with a high profit factor. Indicator signals The indicator uses the price/volume values to generate signals: ED – excess demand.
    35 USD
    UPD1 Profile Levels MT5
    Vitaliy Kuznetsov
    5 (2)
    Gösterge, belirtilen sayıda çubuk için çalışma histogramında maksimum ve minimum fiyat hacminin (piyasa profili) seviyelerini bulur.   Kompozit profil. Histogramın yüksekliği tamamen otomatiktir ve herhangi bir enstrümana ve zaman dilimine uyarlanabilir. Yazarın algoritması kullanılır ve bilinen analogları tekrarlamaz. İki histogramın yüksekliği yaklaşık olarak mumun ortalama yüksekliğine eşittir. Akıllı uyarı (akıllı uyarı), hacim seviyesine ilişkin fiyatı bildirmenize yardımcı olur. Konsept
    45 USD
    Blahtech Supply Demand MT5
    Blahtech Limited
    4.54 (13)
    Was: $299    Now: $149   Supply Demand uses previous price action to identify potential imbalances between buyers and sellers. The key is to identify the better odds zones, not just the untouched ones. Blahtech Supply Demand indicator delivers functionality previously unavailable on any trading platform. This 4-in-1 indicator not only highlights the higher probability zones using a multi-criteria strength engine, but also combines it with multi-timeframe trend analysis, previously confirmed swi
    149 USD
    Simple ATR modern
    Pavel Bereznichenko
    Indicator  Simple ATR  Modern It is used in technical analysis to measure market volatility and show it as a level that is more understandable to the eye and not as an oscillator. ATR Daily - Blue The possibilities of using the ATR in trade can be found in the internet. It can also be used in conjunction with another author's indicator  Volatility Vision The Average True Range indicator measures market volatility. Volatility can be low while the market is growing (and vice versa). It is
    30 USD
    Market Profile Heat indicator  — is a classic Market Profile implementation that can show the price density over time, outlining the most important price levels, value area, and control value of a given trading session. This indicator can be attached to timeframes between M1 and D1 and will show the Market Profile for daily, weekly, monthly, or even intraday sessions. Lower timeframes offer higher precision. Higher timeframes are recommended for better visibility. It is also possible to use a f
    150 USD
    VolumeProfile MT5
    Robert Hess
    3.57 (7)
    Description: The Volume Profile displays detailed informations of historical trading activities at certain price levels (Market Profile). Locate the areas with the best prices in the market and get an advantage over other market participants. Support: The indicator is constantly being developed and improved. Please do not hesitate to contact me via the MQL5 Platform. I am very grateful about any Bug report, so that i can constantly improve the indicator. I appreciate any public review for this
    140 USD
    FastAutolot MT5
    Francesco Vitale
    5 (2)
    Introducing Autolot 2.0 Trade Management : The Revolutionary Trading Utility is Now Even MORE POWERFUL and EFFICIENT! We're proud to announce the launch of Autolot 2.0, the upgrade that takes your trading to a whole new level! We've listened to your feedback and improved the utility to make it even more versatile and user-friendly. Here are the key features we've added: Fixed Risk: Now you can set a fixed risk for your trades, regardless of the balance percentage. For example, in the settings,
    80 USD
    This indicator provides an original mix of WPR, VSA, and volume delta. It shows ratio of buy/sell volumes scaled on 100% range based on total volume change for a selected period. The convetional VSA (Volume Spread Analysis) studies interconnections of price action and volume change in absolute values, whereas WPR (Williams Percent Range) offers a convenient approach of price moves normalization into the fixed percentage metric: 0 - 100%. Hence overbough and oversold states are easily spotted. N
    30 USD
    KT Volume Profile MT5
    KEENBASE SOFTWARE SOLUTIONS
    5 (1)
    KT Volume Profile shows the volume accumulation data as a histogram on the y-axis providing an ability to find out the trading activity over specified time periods and price levels. Point of Control (POC) in a Volume Profile POC represents a price level that coincides with the highest traded volume within the whole volume profile histogram. POC is mostly used as a support/resistance or as an essential price level where market retest before going in a specific direction. Features Very easy
    30 USD
    This is a multi timeframe version of the  Supply and Demand indicator . It allows you to analyze a chart using the law of supply and demand on three different timeframes at a time. You will see zones of sales and purchases and determine the most profitable points to open positions. The indicator is based on the principle of market fractality. Supply and demand zones show places where a strong buyer or seller has made the price reverse and change its direction. The indicator has several types of
    69 USD
    Gösterge, tarihsel olanlarla karşılaştırılabilecek güncel teklifler oluşturur ve bu temelde bir fiyat hareketi tahmini yapar. Gösterge, istenen tarihe hızlı navigasyon için bir metin alanına sahiptir. Seçenekler: Sembol - göstergenin göstereceği sembolün seçimi; SymbolPeriod - göstergenin veri alacağı dönemin seçimi; GöstergeRenk - gösterge rengi; Ters - doğru tırnakları tersine çevirir, yanlış - orijinal görünüm; Sonraki, tarihi girebileceğiniz ve 'enter' tuşuna basa
    55 USD
    Kimsenin size söylemediği en önemli bilgi 'Tüp Yoğunluğu Ölçer' göstergesi tarafından sağlanmaktadır. Bir tüccar olarak her piyasa koşulunda işlem yapamayacağınızı, iyi ve kötü koşulların bulunduğunu ve yapabileceğiniz tek eylemin olduğunu biliyorsunuz. kötü piyasa koşullarında hiçbir işlem yapmamak ve sadece izlemektir. Bu gösterge, işlem yaptığınız paritenin bir aylık istatistiklerine göre en uygun piyasa koşulları karşılandığında sizi uyaracaktır. Kişisel stratejiniz ne olursa olsun. Tic
    60 USD
    The   Supply and Demand Zones indicator   is one of the best tools we have ever made. This great tool automatically draws supply and demand zones, the best places for opening and closing positions. It has many advanced features such as multi timeframe zones support, displaying the width of zones, alert notifications for retouched zones, and much more. Because of market fractality, this indicator can be used for any kind of trading. Whether you are a positional, swing, or intraday trader does no
    99 USD
    Strong Support mt5
    Vasiliy Strukov
    5 (9)
    Destek ve direnç seviyeleri eski zamanlardan beri piyasayı analiz etmek için en güçlü araç olmuştur. Güçlü Destek göstergesi, destek seviyelerini yerel fiyat düşüklerine ve direnç seviyelerini yerel fiyat yükseklerine göre oluşturur.  Diğer gelişimlerim burada görülebilir Örneğin, Gold Stuff gibi bir eğilim göstergesiyle birlikte kullanılması önerilir; bu, trend üzerinde işlem yapmanıza ve aynı zamanda konsolidasyon veya eğilim tersine çevrilme bölgelerini belirlemenize ve destek ve direnç
    50 USD
    Bu göstergenin benzersizliği, hacim hesaplama algoritmasında yatmaktadır: birikim, günün başlangıcına bakılmaksızın doğrudan seçilen dönem için gerçekleşir. Son çubuklar hesaplamanın dışında tutulabilir, bu durumda mevcut veriler daha önce oluşturulan önemli seviyeler (hacimler) üzerinde daha az etkiye sahip olacaktır. Daha doğru bir hesaplama için varsayılan olarak M1 grafiğindeki veriler kullanılır. Fiyat hacimlerinin dağıtım adımı düzenlenir. Varsayılan olarak, ekranın sağ sınırı, analiz için
    35 USD
    Before installing the HeatMap indicator make sure you are using a broker that gives you access to the Depth of market (DOM) !! This indicator creates a heatmap on your chart allowing you to see the buy or sell limit orders easily and in real time. You have the possibility to change the setting and the colors of the HeatMap in order to adapt to all markets and all charts. Here is an example of a setting you can use with the NASDAQ100 on the AMPGlobal broker :  https://www.youtube.com/watch?v=x0
    80 USD
    PZ Trend Trading MT5
    PZ TRADING SLU
    3.67 (3)
    Trend Trading is an indicator designed to profit as much as possible from trends taking place in the market, by timing pullbacks and breakouts. It finds trading opportunities by analyzing what the price is doing during established trends. [ Installation Guide | Update Guide | Troubleshooting | FAQ | All Products ] Trade financial markets with confidence and efficiency Profit from established trends without getting whipsawed Recognize profitable pullbacks, breakouts and early reversals The ind
    249 USD
    ClusterSecond
    Rafil Nurmukhametov
    4.77 (30)
    The utility allows you to build different types of graphs: Seconds chart from 1 second to 86400 seconds Tick chart from 1 tick and above The volume chart Delta chart Renko chart Range chart Demo version of the utility https://www.mql5.com/ru/channels/clustersecond Built-in indicators for volumetric analysis: daily market profile and market profile of the selected timeframe, Cluster Search Imbalance VWAP Dynamic POC, VAH, VAL the profile depth of the market vertical volume with various display op
    100 USD
    The Gann Box (or Gann Square) is a market analysis method based on the "Mathematical formula for market predictions" article by W.D. Gann. This indicator can plot three models of Squares: 90, 52(104), 144. There are six variants of grids and two variants of arcs. You can plot multiple squares on one chart simultaneously. Parameters Square — selection of a square model: 90 — square of 90 (or square of nine); 52 (104) — square of 52 (or 104); 144 — universal square of 144; 144 (full) — "full"
    52 USD
    Pipfinite creates unique, high quality and affordable trading tools. Our tools may or may not work for you, so we strongly suggest to try the Demo Version for MT4 first. Please test the indicator prior to purchasing to determine if it works for you. We want your good reviews, so hurry up and test it for free...we hope you will find it useful. Combo Energy Beam with Swing Control Strategy: Confirm swing pullback signals Watch Video: (Click Here) Energy Beam with Trend Laser Strategy: Confirm Tr
    88 USD
    Bu ürünün alıcıları ayrıca şunları satın alıyor
    Top indicator for MT5   providing accurate signals to enter a trade without repainting! It can be applied to any financial assets: forex, cryptocurrencies, metals, stocks, indices .  MT4 version is here It will provide pretty accurate trading signals and tell you when it's best to open a trade and close it. Watch  the video  (6:22) with an example of processing only one signal that paid off the indicator! Most traders improve their trading results during the first trading week with the help of
    125 USD
    Owl Smart Levels MT5
    Sergey Ermolov
    4.39 (31)
    MT4 versiyonu  |  Nasıl kurulur?   |   FAQ Owl Smart Levels Indicator , Bill Williams'ın gelişmiş fraktalları , piyasanın doğru dalga yapısını oluşturan Valable ZigZag ve kesin giriş seviyelerini gösteren Fibonacci seviyeleri gibi popüler piyasa analiz araçlarını içeren tek gösterge içinde eksiksiz bir ticaret sistemidir. pazara ve kar elde edilecek yerlere. Stratejinin ayrıntılı açıklaması Gösterge ile çalışma talimatı Baykuş Yardımcısı ticaretinde Danışman Yardımcısı Kullanıcıların özel sohbe
    97 USD
    Price action trading, Trend trading strategies, Trend following indicators, Trend detection, Range identification, Smart Trend Trading System Indicator, Comprehensive trading system, Multi-indicator approach, Trend following strategy, Range reversal strategy, Smart Trend Cloud, Smart Reversal Zones, Trend Breakout Catcher, Smart Trailing Stop, Multi-timeframe trend finder, Complete trading toolkit, Market trend analysis, Range-bound market signals, Confident trading decisions, Price movement in
    100 USD
    ICT, SMC, SMART MONEY CONCEPTS, SMART MONEY, Smart Money Concept, Support and Resistance, Trend Analysis, Price Action, Market Structure, Order Blocks, BOS/CHoCH,   Breaker Blocks ,  Momentum Shift,   Supply&Demand Zone/Order Blocks , Strong Imbalance,   HH/LL/HL/LH,    Fair Value Gap, FVG,  Premium  &   Discount   Zones, Fibonacci Retracement, OTE, Buy Side Liquidity, Sell Side Liquidity, BSL/SSL Taken, Equal Highs & Lows, MTF Dashboard, Multiple Time Frame, BigBar, HTF OB, HTF Market Structure
    65 USD
    Matrix Arrow Indicator MT5
    Juvenille Emperor Limited
    5 (13)
    Matrix Arrow Indicator MT5 ,   forex ,   emtialar ,   kripto   para birimleri ,   endeksler ,   hisse senetleri   gibi tüm sembollerde/araçlarda kullanılabilen   %100 yeniden boyamayan   çoklu zaman çerçevesi göstergesini izleyen benzersiz bir 10'u 1 arada trenddir.  Matrix Arrow Indicator MT5 , mevcut eğilimi erken aşamalarında belirleyecek ve aşağıdakiler gibi 10'a kadar standart göstergeden bilgi ve veri toplayacaktır: Ortalama Yönlü Hareket Endeksi (ADX) Emtia Kanal Endeksi (CCI) Klasik Hei
    75 USD
    FX Volume MT5
    Daniel Stein
    4.8 (15)
    Sabah Brifingimiz aracılığıyla ayrıntılar ve ekran görüntüleri ile günlük piyasa güncellemenizi alın burada mql5 ve on Telegram ! FX Volume, bir brokerin bakış açısından piyasa duyarlılığı hakkında GERÇEK bir fikir veren İLK ve TEK hacim göstergesidir. COT raporlarından çok daha hızlı bir şekilde, brokerlar gibi kurumsal piyasa katılımcılarının Forex piyasasında nasıl konumlandıklarına dair harika bilgiler sağlar. Bu bilgileri doğrudan grafiğinizde görmek, ticaretiniz için gerçek oyun değiştir
    99 USD
    Auto Order Block with break of structure Detect Break of Structure , Mark Order Block and draw Entry / Stop and Risk to Reward lines when Order block is touch by price with Alert. Trend is Manually set to filter signals in a direction by a button on the chart. Entry / Stop and Risk to Reward lines can also be switch on / off by button on chart. Futures Auto Mark Break of Structure Auto Mark Order block Auto Mark higher time frame Point Of  Interest ( POI ) Popup Alert when BoS , Order block
    65 USD
    Quantum Trend Sniper
    Bogdan Ion Puscasu
    5 (7)
    Tanıtım       Kuantum Trend Keskin Nişancı Göstergesi   , trend tersine dönmeleri belirleme ve ticaret yapma şeklinizi değiştiren çığır açan MQL5 Göstergesi! 13 yılı aşkın ticaret tecrübesine sahip deneyimli tüccarlardan oluşan bir ekip tarafından geliştirilmiştir.       Kuantum Trend Keskin Nişancı Göstergesi       trend dönüşlerini son derece yüksek doğrulukla belirlemenin yenilikçi yolu ile ticaret yolculuğunuzu yeni zirvelere taşımak için tasarlanmıştır. ***Kuantum Trend Keskin Nişancı Gö
    99.99 USD
    FX Power MT5 NG
    Daniel Stein
    5 (1)
    Sabah Brifingimiz burada mql5 ve on Telegram! FX Power MT5 NG , uzun zamandır çok popüler olan döviz gücü ölçerimiz FX Power'ın yeni neslidir. Peki bu yeni nesil güç ölçer ne sunuyor? Orijinal FX Power hakkında sevdiğiniz her şey PLUS GOLD/XAU güç analizi Daha da hassas hesaplama sonuçları Ayrı ayrı yapılandırılabilir analiz dönemleri Daha da iyi performans için özelleştirilebilir hesaplama limiti Özel çokluDaha fazlasını görmek isteyenler için örnek ayarlar Her grafikte en sevdiğiniz renkler i
    99 USD
    Tanıtım       Quantum Breakout PRO   , Breakout Bölgeleri ile ticaret yapma şeklinizi değiştiren çığır açan MQL5 Göstergesi! 13 yılı aşkın ticaret tecrübesine sahip deneyimli tüccarlardan oluşan bir ekip tarafından geliştirilmiştir.       Kuantum Breakout PRO       yenilikçi ve dinamik koparma bölgesi stratejisiyle ticaret yolculuğunuzu yeni zirvelere taşımak için tasarlanmıştır. Kuantum Breakout Göstergesi, size 5 kar hedefi bölgesi ile kırılma bölgelerinde sinyal okları ve kırılma kutusuna
    99.99 USD
    Support and Resistance, Trading System, Indicator, Candlestick Patterns, VWAP, Trend Catcher, Multi-Timeframe Trend, Support Levels, Resistance Levels, Trading Strategies, Complete Trading System, Technical Analysis, Forex Trading, Price Action, Market Trends, Trading Signals, Trend Identification, Swing Trading, Day Trading, Swing Trading Strategies, Technical Indicators, Trading Tools, Trend Confirmation, Entry and Exit Points, Trading Panel, Forex Signals, Trend Reversals, Trading Algorithms
    100 USD
    IVISTscalp5
    Vadym Zhukovskyi
    5 (1)
    We present you the iVISTscalp5 indicator, which is not only unique, but also effective in the analysis of trading operations. This indicator is based on time data and is the result of many years of experience and deep analysis of financial markets. The iVISTscalp5 indicator is an excellent assistant for manual trading. Convenience, simplicity and visualization. All the most difficult is hidden inside. We have simplified the settings and use of the iVISTscalp5 indicator as much as possible. The i
    500 USD
    Quantum Heiken Ashi PRO ile   tanışın Pazar eğilimleri hakkında net bilgiler sağlamak üzere tasarlanan Heiken Ashi mumları, gürültüyü filtreleme ve yanlış sinyalleri ortadan kaldırma yetenekleriyle ünlüdür. Kafa karıştırıcı fiyat dalgalanmalarına veda edin ve daha sorunsuz, daha güvenilir bir grafik sunumuna merhaba deyin. Quantum Heiken Ashi PRO'yu gerçekten benzersiz kılan şey, geleneksel şamdan verilerini okunması kolay renkli çubuklara dönüştüren yenilikçi formülüdür. Kırmızı ve yeşil çubukl
    99.99 USD
    The idea of this trading system from the EMA with a Mediante price from the EMA indicators is based exactly 100% from Ripster47 trading system, me is just the person to create it on the MT5 platform, but with alerts for your own buy/sell settings.  Hereby I make a copy from Ripster47 explanation for using that system: " EMA  Cloud By Ripster EMA  Cloud System is a Trading System Invented by Ripster where areas are shaded between two desired EMAs. The concept implies the  EMA  cloud area
    89 USD
    Advanced Supply Demand MT5
    Bernhard Schweigert
    4.36 (11)
    Herhangi bir Acemi veya Uzman Tüccar için En İyi Çözüm! Bu gösterge benzersiz, yüksek kaliteli ve uygun fiyatlı bir ticaret aracıdır çünkü bir dizi tescilli özelliği ve yeni bir formülü bir araya getirdik. Bu güncelleme ile çift zaman dilimi dilimlerini gösterebileceksiniz. Yalnızca daha yüksek bir TF gösteremeyeceksiniz, aynı zamanda TF grafiğini ve ARTIK daha yüksek TF'yi de gösterebileceksiniz: YUVARLAK BÖLGELERİ GÖSTERMEK. Tüm Arz Talebi tüccarları buna bayılacak. :) Önemli Bilgiler Açıkland
    199 USD
    MetaBands M5
    Vahidreza Heidar Gholami
    5 (2)
    All my products are currently 50% off until September 1st. Explore the products and develop your own strategy. MetaBands uses powerful and unique algorithms to draw channels and detect trends so that it can provide traders with potential points for entering and exiting trades. It’s a channel indicator plus a powerful trend indicator. It includes different types of channels which can be merged to create new channels simply by using the input parameters. MetaBands uses all types of alerts to noti
    69 USD
    Royal Scalping Indicator M5
    Vahidreza Heidar Gholami
    5 (8)
    All my products are currently 50% off until September 1st. Explore the products and develop your own strategy. Royal Scalping Indicator is an advanced price adaptive indicator designed to generate high-quality trading signals. Built-in multi-timeframe and multi-currency capabilities make it even more powerful to have configurations based on different symbols and timeframes. This indicator is perfect for scalp trades as well as swing trades. Royal Scalping is not just an indicator, but a trading
    69 USD
    - 50% OFF - Telegram group : https://t.me/+5RIceImV_OJmNDA0 MT4 version : https://www.mql5.com/en/market/product/84526?source=Unknown%3Ahttps%3A%2F%2Fwww.mql5.com%2Fen%2Fmarket%2Fmy Master Pullback is a complete system that gives unique trading opportunities and a clear indication of the market: trend, signals as well as stop loss and take profit levels. This system has been designed to be as simple as possible and detects extreme overbought and oversold zones, support and resistance levels,
    99.99 USD
    This is arguably the most complete harmonic price formation auto-recognition indicator you can find for the MetaTrader Platform. It detects 19 different patterns, takes fibonacci projections as seriously as you do, displays the Potential Reversal Zone (PRZ) and finds suitable stop-loss and take-profit levels. [ Installation Guide | Update Guide | Troubleshooting | FAQ | All Products ] It detects 19 different harmonic price formations It plots primary, derived and complementary Fibonacci p
    299 USD
    Tired of plotting support and resistance lines? This is a multi-timeframe indicator that detects and plots supports and resistance lines in the chart with the same precision as a human eye would. As price levels are tested over time and its importance increases, the lines become thicker and darker, making price leves easy to glance and evaluate. [ Installation Guide | Update Guide | Troubleshooting | FAQ | All Products ] Boost your technical analysis Customizable timeframe selection Read pri
    149 USD
    XQ Indicator MT5
    Marzena Maria Szmit
    3.25 (4)
    The signal conditions are a combination of three indicators, and XQ Forex Indicators only display  medium and long-term trends . The indicator's efficacy has been improved with the addition of a filter that blocks out false signals. The XQ Forex Indicator can be used on  FX pairs, CFDs, and Cryptocurrencies . There are two type of signals:  Buy or Sell and Big Long or Big Short It is possible to enable sending emails when a major trend-change signal is detected, as well as to display the alerts
    179 USD
    The Price Action Finder Multi indicator is a multi-currency and multi-timeframe indicator. It searches for patterns of the Price Action system on all standard time frames at once and on a large (up to 60) number of instruments (currencies, stocks, metals, etc.). The resulting patterns are placed by the indicator in a table at the bottom of the screen. Patterns: At the moment, the indicator contains the following patterns: Outside bar , Inside bar , Pin bar , Force bar , PPR , as well as the In
    149 USD
    Introduction to Fibonacci Volatility Indicator Volatility indicator can help you to detect any statistical advantage for your trading. Especially, if you are trading with Price Action and Price Patterns, then we recommend to use the Volatility indicator together with your strategy. Especically, Fibonacci Volatility indicator combines the market volatiltiy with Fibonacci Analysis to provide you more advanced volatiltiy indicator. Main Features Fibonacci Volatility in Z score Configuration Mode Fi
    100 USD
    TPA True Price Action indicator reveals the true price action of the market makers through 100% non-repainting signals strictly at the close of a candle! TPA shows entries and re-entries, every time the bulls are definitely stronger than the bears and vice versa. Not to confuse with red/green candles. The shift of power gets confirmed at the earliest stage and is ONE exit strategy of several. There are available now two free parts of the TPA User Guide for our customers. The first "The Basics"
    168 USD
    ICT Analysis, SMC Trading Strategies, Smart Money Concepts, Smart Money Insights,   Institutional Perspective,     Banks and Institutions Liquidity,   Liquidity Analysis, Institutional Trading, Market Predictions, Price Movement Analysis,   Trading with Institutions,  Trend Analysis Tool, Price Action Indicator, Market Structure Analysis, Order Block Detection,   Support and Resistance Levels,   BOS and CHoCH Patterns,  Momentum Shift Indicator, Supply and Demand Zones Locator, Strong Imbalance
    100 USD
    User Support Paid subscribers may request to join the WTGS Workshop @DB_WTI after emailing your Twitter handle and the proof of subscription to wtg.system.international@gmail.com . The System WTGS Navigator Saturn consists of six components: TrendFinder Saturn: Internal Trending   Confirmation   Titan: Internal Trending   Indicator Outer Ring: External Trending Indicator Inner Ring: External Trending Confirmation Data: The time-lapse of a trend on any given timeframe Disclaimers Although every
    90 USD
    User Support Paid subscribers may request to join the WTGS Workshop   @DB_WTI after emailing your Twitter handle and the proof of subscription to   wtg.system.international@gmail.com . The System WTGS Navigator Overlay consists of two components: Dynamic Butterfly Footprints Overlay Disclaimers Although every effort has been made when designing WTGS Navigator Overlay, WTG makes no warranties, expressed or implied, or representations as to the accuracy or profitability of the system. WTG assume
    90 USD
    FX Trend MT5
    Daniel Stein
    4.62 (34)
    Get your daily market update with details and screenshots via our Morning Briefing  here on mql5  and  on Telegram ! Do you want to become a constantly profitable 5-star forex trader? Then  get our Stein Investments trading tools  and send us a screenshot to get your personal invitation to our exclusive trading chat with 500+ members. FX Trend displays the trend direction, duration, intensity and the resulting trend rating for all time frames in real time. You'll see at a glance at which dir
    66 USD
    RubdFx Perfect Reversal , The reversal indicator is used to determine areas of support and resistance by Drawing an arrow with a level of supply and demand ( ReversalZones ). - You will catch more swings by reducing the period, and less swings if you increase period - Mobile, computer and email alerts available . it is not pushed by price which means the arrow will stay in one place,suitable for scalping and long term trading  Also Compatible with all forex paris , BUY RULES;  open a buy positio
    159 USD
    Heatmap Volume Profile
    Olexandr Savchuk
    4.25 (4)
    A Heatmap with a Volume Profile is like a thermal imager or x-ray machine. It will help you to estimate the relative distribution of volume during the price movement and to understand  the relationship between volume and price. Indicator Volume Profile "Volumos Maxima" is a powerful tool for analyzing this relationship. After simple experimentation with heatmap, you can find that each trading instrument has its own “ characteristic ” way of distributing volume. And this will help you to make a b
    80 USD
    Yazarın diğer ürünleri
    Loss Recovery 1 MT4
    Kyra Nickaline Watson-gordon
    4.6 (5)
    Loss Recovery 1 is an Expert Advisor for recovering losses of positions that were opened in the wrong direction (that were opened by another EA or manually). This EA recovers your loss and closes your position without using dangerous martingale/Averaging methods. This EA places some positions in opposite directions and some positions in direction of wrong position and manages these positions with mathematical methods until recovering total loss of the position. Using EA : EA Action: Sin
    190 USD
    Loss Recovery 1 MT5
    Kyra Nickaline Watson-gordon
    3 (2)
    Loss Recovery 1 is an Expert Advisor for recovering losses of positions that were opened in the wrong direction (that were opened by another EA or manually). This EA recovers your loss and closes your position without using dangerous martingale/Averaging methods. This EA places some positions in opposite directions and some positions in direction of wrong position and manages these positions with mathematical methods until recovering total loss of the position. Using EA : EA Action: Sin
    190 USD
    Loss Recovery 3 MT4
    Kyra Nickaline Watson-gordon
    3.5 (2)
    Loss Recovery 3 is an Expert Advisor for recovering losses of positions that were opened in the wrong direction (that were opened by another EA or manually). This EA recovers your loss and closes your position on Break Even or with determined profit. Trading Strategy: Loss Recover3 EA try to Recover Wrong Positions, by using Averaging method. There are various features on the EA to control risk of the strategy. Using EA : The EA is very simple and without complicated input para
    60 USD
    First Scalper MT5
    Kyra Nickaline Watson-gordon
    5 (4)
    First Scalper is an Expert Advisor based on Scalping, Using the best and safest scalping EA on market. Large number of inputs and settings are tested and optimized and embedded in the program thus inputs are limited and very simple. Using EA  doesn't need any professional information or Forex Trading Knowledge. First Scalper can trade on all symbols and all time frames, using a special and unique strategy developed by the author. Using EA : General Options Trade Type : Long/Short/Both S
    200 USD
    VWAP Indicator MT5
    Kyra Nickaline Watson-gordon
    Description : VWAP (Volume-Weighted Average Price) is the ratio of the value traded to total volume traded over a particular time horizon. It is a measure of the average price at which pair is traded over the trading horizon. Read More. All Symbols and All Timeframes are supported. Indicator Inputs :     VWAP Mode : Mode of VWAP Calculation. Options can be selected : Single,Session,Daily,Weekly,Monthly     Volumes : Real Volumes,Tick Volumes     Price Type : Used price for cal
    50 USD
    Account Graph MT4
    Kyra Nickaline Watson-gordon
    5 (2)
    An indicator to draw a graph of account current and historical state such as Balance, Equity, Margin, Free Margin, Margin Level, Drawdown, Account Profit, Deposit and Withdrawals. Indicator Inputs : Draw Balance Graph Draw Equity Graph Draw Margin Graph Draw Free Margin Graph Draw Margin Level Graph Draw Drawdown Graph Draw Account Profit Graph Connect Gaps by Lines Sign of DDs on Profit Sign of DDs on Loss Tips : The Indicator will draw historical balance graphs and deposit/withdraw arrow
    60 USD
    TPO Profile MT5
    Kyra Nickaline Watson-gordon
    Definition : TPO is a Time Price Opportunity. Instead of using bars or candles with an Open, High, Low, and Close price, each "bar" in a Market Profile is represented by horizontal bars against the price It is called Market Profile terminology. In other words time-price-opportunity (TPO) profiles are histograms of how much time was spent at each price within the span of the profile. By using a TPO chart, you are able to analyze the amount of trading activity, based on time, for each price leve
    60 USD
    Smart Copy Local MT5
    Kyra Nickaline Watson-gordon
    5 (2)
    Smart Copy is an Easy-to-Use EA that supports Multi Copying Metatrader4 and Metatrader5 and Local/Remote Copying. (Remote Version is coming soon) Free version is available on Smart Copy Local Free MT5 Specifications :     Real Time, Multi Terminal - Multi Account - MT4/MT5 trade copying     Copy from netting to hedge and hedge to netting is supported.     Fast and instant copy     All settings are input visually.     Easy modifying symbol names, prefix, suffix     Enable/Disable
    50 USD
    Loss Recovery 2 MT4
    Kyra Nickaline Watson-gordon
    3.6 (5)
    Loss Recovery 2 is an Expert Advisor for recovering losses of positions that were opened in the wrong direction (that were opened by another EA or manually). This EA recovers your loss and closes your position without using dangerous martingale/Averaging methods. Trading Strategy: Loss Recover2 EA try to close wrong positions without any loss (Recover Wrong Positions), by using Zone Recovery method and without using martingale methods. Anytime price exits from zone, EA will close basket
    90 USD
    Smart Copy Local MT4
    Kyra Nickaline Watson-gordon
    5 (6)
    Smart Copy is an Easy-to-Use EA that supports Multi Copying Metatrader4 and Metatrader5 and Local/Remote Copying. (Remote Version is coming soon) Free version is available on Smart Copy Local Free MT4 Specifications :     Real Time, Multi Terminal - Multi Account - MT4/MT5 trade copying     Copy from netting to hedge and hedge to netting is supported.     Fast and instant copy     All settings are input visually.     Easy modifying symbol names, prefix, suffix     Enable/Disable co
    50 USD
    OneClick Auto Close MT5
    Kyra Nickaline Watson-gordon
    5 (1)
    A utility to close all orders automatically when conditions meet. Various options are available to filter or select orders : Conditions : Closing conditions. 3 different conditions can be defined. EA will close orders anytime one or more defined conditions meet. Conditions can be defined based on account properties or selected orders properties. Also a fixed time to close orders is available. Type of orders : Buy / Sell / Buy Limit / Sell Limit / Buy Stop / Sell Stop Symbol Selection : All /
    50 USD
    Market View MT4
    Kyra Nickaline Watson-gordon
    5 (1)
    Definition : Market View is a dashboard (scanner) to view price graphs of all symbols and all timeframes at a glance. The utility is designed user friendly and added a wide range of customization options. Main features of Market View : Visual settings window on the chart Customizable list of symbols and timeframes Different shapes : Real Candles, Schematic Candles, Arrows Customizable number of candles Changeable size of dashboard (scanner) Highlight timeframes with gaps on candles Open appr
    50 USD
    TPO Profile MT4
    Kyra Nickaline Watson-gordon
    5 (1)
    Definition : TPO is a Time Price Opportunity. Instead of using bars or candles with an Open, High, Low, and Close price, each "bar" in a Market Profile is represented by horizontal bars against the price It is called Market Profile terminology. In other words time-price-opportunity (TPO) profiles are histograms of how much time was spent at each price within the span of the profile. By using a TPO chart, you are able to analyze the amount of trading activity, based on time, for each price lev
    60 USD
    Triangular EA Limited vMT5
    Kyra Nickaline Watson-gordon
    3 (3)
    Note : Limited version can trade with the volume less than 0.05 lots. Important : This is Arbitrage EA and may not work on all accounts. It is recommended to follow the testing process described on product screenshots. If you are not familiar with arbitrage trading, It is recommended to use our other trading robots . Strategy : EA will place trades based on Triangular Arbitrage strategy. Triangular arbitrage (also referred to as cross currency arbitrage or three-point arbitrage) is t
    30 USD
    OneClick Screenshot MT5
    Kyra Nickaline Watson-gordon
    Description : A utility to create and save screenshots automatically and send to a chat/group/channel on telegram. The saved/sent image file will include all objects that exist on the chart and also all indicators are displayed on the chart. Features: Save screenshot of chart including all objects, indicators, ... Send screenshots to a telegram chat/group/channel Wide range options to select when create screenshots Logo and text adding feature Inputs and How to setup the EA : Variou
    30 USD
    Fundamental Signals Scanner MT4
    Kyra Nickaline Watson-gordon
    Fundamental Scanner is a Non-Repaint, Multi Symbol and Multi Time Frame Dashboard based on Fundamental Signals Indicator . Fundamental Signals Indicator has a powerful calculation engine that can predict market movement over 3000 pips (30000 points). The indicator is named fundamental because it can predict trends with large movements, no complicated inputs and low risk. Features : Multi-Symbol Support (Support automatic listing of market watch symbols) Multi-TimeFrame Support (Over 7
    110 USD
    Fundamental Signals Scanner MT5
    Kyra Nickaline Watson-gordon
    Fundamental Scanner is a Non-Repaint, Multi Symbol and Multi Time Frame Dashboard based on Fundamental Signals Indicator . Fundamental Signals Indicator has a powerful calculation engine that can predict market movement over 3000 pips (30000 points). The indicator is named fundamental because it can predict trends with large movements, no complicated inputs and low risk. Features : Multi-Symbol Support (Support automatic listing of market watch symbols) Multi-TimeFrame Support (Over 7
    110 USD
    Loss Recovery 2 MT5
    Kyra Nickaline Watson-gordon
    1 (1)
    Loss Recovery 2 is an Expert Advisor for recovering losses of positions that were opened in the wrong direction (that were opened by another EA or manually). This EA recovers your loss and closes your position without using dangerous martingale/Averaging methods. Trading Strategy: Loss Recover2 EA try to close wrong positions without any loss (Recover Wrong Positions), by using Zone Recovery method and without using martingale methods. Anytime price exits from zone, EA will close basket
    90 USD
    VWAP Indicator MT4
    Kyra Nickaline Watson-gordon
    5 (2)
    Description : VWAP (Volume-Weighted Average Price) is the ratio of the value traded to total volume traded over a particular time horizon. It is a measure of the average price at which pair is traded over the trading horizon. Read More. All Symbols and All Timeframes are supported. Indicator Inputs :     VWAP Mode : Mode of VWAP Calculation. Options can be selected : Single,Session,Daily,Weekly,Monthly     Volumes : Real Volumes,Tick Volumes     Price Type : Used price for ca
    50 USD
    Customized Copy MT4
    Kyra Nickaline Watson-gordon
    Customized Copy is a Multi-Terminal visual trade copying utility that supports Metatrader4 and Metatrader5 for Trade Copying.  You can activate EA on 10 different PCs/VPS. On each PC/VPS can install on Unlimited Terminals. Specifications :     Real Time, Multi Terminal - Multi Account - MT4/MT5 trade copying (support over 50 accounts at same time)     All settings are input visually.     Visual display and modify of copy map and network     Each copy path can be used with different setti
    100 USD
    Customized Copy MT5
    Kyra Nickaline Watson-gordon
    Customized Copy is a Multi-Terminal visual trade copying utility that supports Metatrader4 and Metatrader5 for Trade Copying.  You can activate EA on 10 different PCs/VPS. On each PC/VPS can install on Unlimited Terminals. Specifications :     Real Time, Multi Terminal - Multi Account - MT4/MT5 trade copying (support over 50 accounts at same time)     All settings are input visually.     Visual display and modify of copy map and network     Each copy path can be used with different setti
    100 USD
    Fundamental Signals Indicator is a Non-Repaint Indicator with a powerful calculation engine that can predict market movement over 3000 pips (30000 points). The indicator does not analyze the market fundamentally, it is named fundamental because it can predict trends with large movements, no complicated inputs and low risk. Also Indicator can alert on market trend changes. Using Indicator : The Indicator is very simple and without complicated input parameters. (No need to optimize anythin
    90 USD
    Loss Recovery 3 MT5
    Kyra Nickaline Watson-gordon
    Loss Recovery 3 is an Expert Advisor for recovering losses of positions that were opened in the wrong direction (that were opened by another EA or manually). This EA recovers your loss and closes your position on Break Even or with determined profit. Trading Strategy: Loss Recover3 EA try to Recover Wrong Positions, by using Averaging method. There are various features on the EA to control risk of the strategy. Using EA : The EA is very simple and without complicated input para
    60 USD
    Triangular EA Free vMT5
    Kyra Nickaline Watson-gordon
    2.5 (2)
    Note : Free version can be used for trading on Demo Accounts. Important : This is Arbitrage EA and may not work on all accounts. It is recommended to follow the testing process described on product screenshots. Strategy : EA will place trades based on Triangular Arbitrage strategy. Triangular arbitrage (also referred to as cross currency arbitrage or three-point arbitrage) is the act of exploiting an arbitrage opportunity resulting from a pricing discrepancy among three different cu
    FREE
    OneClick Close All MT4
    Kyra Nickaline Watson-gordon
    5 (2)
    A utility to close all orders with one simple click at once. Various options are available to filter or select orders : Type of orders : Buy / Sell / Buy Limit / Sell Limit / Buy Stop / Sell Stop Symbol Selection : All / Chart Symbol / Custom Symbols. You can enter custom symbols separated by comma. (for example you can enter EURUSD,GBPUSD,AUDJPY) Order Open Type : Manual Opened / Opened by EA Magic Number : You can enter more than one magic number separated by comma. (for example you can ente
    30 USD
    Account Graph MT5
    Kyra Nickaline Watson-gordon
    5 (1)
    An indicator to draw a graph of account current and historical state such as Balance, Equity, Margin, Free Margin, Margin Level, Drawdown, Account Profit, Deposit and Withdrawals. Indicator Inputs : Draw Balance Graph Draw Equity Graph Draw Margin Graph Draw Free Margin Graph Draw Margin Level Graph Draw Drawdown Graph Draw Account Profit Graph Hide Data on Chart and Buffers Connect Gaps by Lines Sign of DDs on Profit Sign of DDs on Loss Tips : The Indicator will draw historical balance gra
    60 USD
    Triangular EA Free MT4
    Kyra Nickaline Watson-gordon
    Note: MT4 Backtest cannot test EAs that trades with several symbols simultaneously. For backtest use MT5 versions download here . Note : Free version can be used for trading on Demo Accounts. Important : This is Arbitrage EA and may not work on all accounts. It is recommended to follow the testing process described on product screenshots. Strategy : EA will place trades based on Triangular Arbitrage strategy. Triangular arbitrage (also referred to as cross currency arbitrage or three-
    FREE
    Smart Copy Local Free MT5
    Kyra Nickaline Watson-gordon
    4.67 (3)
    Smart Copy is an Easy-to-Use EA that supports Multi Copying Metatrader4 and Metatrader5 and Local/Remote Copying. (Remote Version is coming soon) This is Free Version and can be used on Demo accounts only. Use the Full Version for real trading. Specifications :     Real Time, Multi Terminal - Multi Account - MT4/MT5 trade copying     Copy from netting to hedge and hedge to netting is supported.     Fast and instant copy     All settings are input visually.     Easy modifying symbol
    FREE
    Triangular EA Limited MT4
    Kyra Nickaline Watson-gordon
    1 (2)
    Note: MT4 Backtest cannot test EAs that trades with several symbols simultaneously. For backtest use MT5 versions download here . Note : Limited version can trade with the volume less than 0.05 lots. Important : This is Arbitrage EA and may not work on all accounts. It is recommended to follow the testing process described on product screenshots. If you are not familiar with arbitrage trading, It is recommended to use our other trading robots . Strategy : EA will place trades based o
    30 USD
    Risk Monitor MT4
    Kyra Nickaline Watson-gordon
    Definition : Risk Monitor is an expert for Analyzing, monitoring, controlling account risks. Strategy :     Analyze Each Currency Volume and Direction on Account and Sort Them     Find and Suggest Best Three Symbols in Opposite Direction (Hedging Positions) for Controlling Risk.     Analyze User-Defined Position and preview effect before placing /Closing Features of EA :     Graphical Interface     Show Risk Graph for each currency     Smart Analyze and suggest best hedging positi
    30 USD
    Filtre:
    Florian Schaal
    28
    Florian Schaal 2023.07.16 11:35 
     

    Nice indicator, works with ticks on forex and real volume on others (didnt check yet). Recommended!

    İncelemeye yanıt
    Sürüm 1.3 2023.01.27
    Minor updates on buffers filling.
    Sürüm 1.2 2021.10.03
    Added more buffers for developers.
    Sürüm 1.1 2021.03.13
    Optimized Performance when multiple indicators run on chart.