Candle Timer Countdown
- Göstergeler
- JETINVEST
- Sürüm: 4.0
- Güncellendi: 25 Ocak 2022
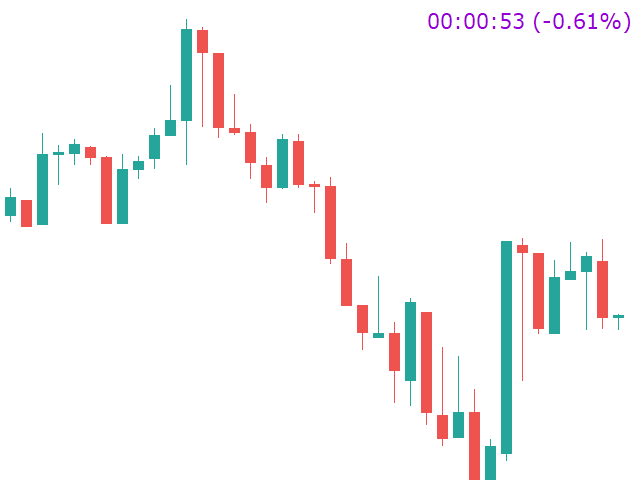
Candle Timer Countdown displays the remaining time before the current bar closes and a new bar forms. It can be used for time management.
Feature Highlights
- Tracks server time not local time
- Configurable Text Color and Font Size
- Optional Visualization of the Symbol Daily Variation
- Optimized to reduce CPU usage
Input Parameters
- Show Daily Variation: true/false
- Text Font Size
- Text Color
If you still have questions, please contact me by direct message: https://www.mql5.com/en/users/robsjunqueira/


Works good no problems